Abstract
Bile acids (BAs) are cholesterol derivatives that regulate lipid metabolism, through their dual abilities to promote lipid absorption and activate BA receptors. However, different BA species have varying abilities to perform these functions. Eliminating 12α-hydroxy BAs in mice via Cyp8b1 knockout causes low body weight and improved glucose tolerance. The goal of this study was to determine mechanisms of low body weight in Cyp8b1−/− mice. We challenged Cyp8b1−/− mice with a Western-type diet and assessed body weight and composition. We measured energy expenditure, fecal calories, and lipid absorption and performed lipidomic studies on feces and intestine. We investigated the requirement for dietary fat in the phenotype using a fat-free diet. Cyp8b1−/− mice were resistant to Western diet-induced body weight gain, hepatic steatosis, and insulin resistance. These changes were associated with increased fecal calories, due to malabsorption of hydrolyzed dietary triglycerides. This was reversed by treating the mice with taurocholic acid, the major 12α-hydroxylated BA species. The improvements in body weight and steatosis were normalized by feeding mice a fat-free diet. The effects of BA composition on intestinal lipid handling are important for whole body energy homeostasis. Thus modulating BA composition is a potential tool for obesity or diabetes therapy.
Keywords: bile acids, lipid absorption, obesity, diabetes, triglyceride
bile acids (BAs) are amphipathic molecules synthesized in the liver from cholesterol. They are well known for their role as surfactants, and this function is fundamental for the absorption of lipids and liposoluble vitamins upon the ingestion of a meal (8, 10, 34). Since the discovery of farnesoid X receptor (FXR) and G protein-coupled bile acid receptor 1 (TGR5) as target receptors for BAs, a wealth of data has shown that BAs act as signaling molecules in various tissues throughout the body, regulating a variety of metabolic pathways (21, 24, 27, 28, 31, 41).
Two key enzymes of BA synthesis are cholesterol 7-α-hydroxylase (CYP7A1) and sterol 12-alpha-hydroxylase (CYP8B1). The former performs the rate-limiting first step of BA synthesis. The latter, CYP8B1, is a BA 12α-hydroxylase that determines the production of cholic acid (CA, which is 12α-hydroxylated) vs. chenodeoxycholic acid (CDCA, which is not). In rodents, CDCA is 6-hydroxylated soon after its synthesis into muricholic acids (MCA). Endogenously produced primary BAs can be further modified by intestinal microbes into secondary BAs, such as deoxycholic acid, which is generated from CA and is 12α-hydroxylated. Every BA species has unique physicochemical properties that can affect its interaction with BA receptors (25, 33), as well as its ability to solubilize lipids and cholesterol (40, 43).
The importance of BA composition in metabolism in humans was underscored by our finding that individuals who are very insulin sensitive have lower levels of 12α-hydroxylated BAs, whereas those who are insulin resistant have higher levels (13). These alterations are consistent with 1) the regulation of Cyp8b1 by the insulin-repressible forkhead box class O (FoxO) transcription factors (15), 2) the increases in 12α-hydroxylated BAs in rodent models of diabetes (2, 3, 36, 37), and 3) the observations that obese and type 2 diabetic subjects preferentially synthesize 12α-hydroxylated BAs (6, 14). Moreover, we found that low BA 12α-hydroxylation was associated with lower body mass index, lower triglycerides, improvements in fatty liver, and enhanced insulin-stimulated glucose disposal (13). These findings raised the possibility that 12α-hydroxy BAs regulate metabolic homeostasis. Indeed, the absence of 12α-hydroxy BAs, as found in Cyp8b1−/− mice, has been linked to reduced cholesterol absorption (30) and reduced atherosclerosis (32), as well as low body weight and improved glucose homeostasis (4, 20).
In this work, we investigated the role of 12α-hydroxylated BAs in intestinal lipid absorption and the implications of this pathway on Western diet-induced body weight gain. We show that ablating Cyp8b1, thereby eliminating 12α-hydroxylated BAs (26), leads to reduced absorption of dietary triglyceride, with intact triglyceride hydrolysis. This prevents Western diet-induced body weight gain, fat accumulation, and steatosis and improves insulin sensitivity. These alterations occur because of alterations in BA composition, not total levels, as Cyp8b1−/− mice have no decrease—and, in fact, a slight increase—in total BAs (26). Taken together, these data suggest CYP8B1 as a potential therapeutic target for obesity and diabetes.
MATERIALS AND METHODS
Mice and diets.
Cyp8b1−/− mice were generated at Taconic using a C57BL/6 background (model 11784). All the mice used in the experiments came from crossing of a heterozygous couple to have control, Cyp8b1+/−, and Cyp8b1−/− littermates. Only male mice between 8 and 12 wk of age were used for the experiments.
Mice were fed a standard chow diet (3.4 kcal/g, Purina 5053), a Western-type diet (4.5 kcal/g, 42% kcal from fat and 0.2% from cholesterol, TD 88137; Envigo), or a fat-free diet (3.3 kcal/g, 24.2% kcal from protein and 75.8% from carbohydrate, TD 03314; Envigo) for up to 4 wk before euthanasia. Mice were housed in a 12:12-h light-dark cycle. The 16-h fast began at 6 PM, and the refeeding was at 10 AM. Food intake measurement was obtained from mice caged individually with a food dispenser located inside the cage. Euthanasia was performed by CO2 asphyxiation followed by cervical dislocation. All experiments were approved by, and conducted in accordance with the guidelines of, the Columbia University Institutional Animal Care and Use Committee.
Gene expression.
RNA was extracted from liver using TRIzol (Life Technologies), and cDNA was obtained using High-Capacity cDNA Reverse Transcription Kit (Applied Biosystems). Quantitative PCR was performed with iTaq Universal SYBR Green Supermix (Bio-Rad), and 36b4 was used as housekeeping gene for normalization: 36b4 forward, AGATGCAGCAGATCCGCAT; 36b4 reverse, GTTCTTGCCCATCAGCACC; Cyp8b1 forward, GCCCACAGCCTTCAAGTATG; Cyp8b1 reverse, CGACCAGCTTGAAGTCGAAG.
Metabolic tests.
The oral glucose tolerance test was performed 2 wk after the start of Western-type diet (WTD) feeding. We subjected mice to a 16-h overnight fast followed by oral administration of glucose by gavage (2 g/kg). Glucose levels were assessed with OneTouch glucose monitor and strips (LifeScan). Insulin was measured using an ELISA kit (Mercodia). Fasted glucose and insulin were measured at 10 AM after a 16-h overnight fast. Body composition was assessed using time domain NMR (Minispec Analyst AD; Bruker Optics) (16).
Lipid extraction from liver was performed as described (11). Lipids were measured using colorimetric assays for triglycerides (Infinity; Thermo Scientific) and cholesterol (Cholesterol E; Wako), and values were normalized by liver weight. Oil Red O staining was performed on snap-frozen liver sections.
For the glycogen measurement, 200 mg of liver from mice refed for 5 h were homogenized in 1 ml of 6% perchloric acid and centrifuged at 18,000 g for 10 min at 4°C. The supernatant was added to distilled water in a ratio of 1:1 and centrifuged again. The supernatant was adjusted to pH 7.0 with KOH and centrifuged, and the supernatant was incubated with amyloglucosidase (Sigma A7420, from Aspergillus niger 30–60 unit/mg) at 42°C for 2 h. Released glucose was quantified using a glucose assay kit (Sigma-Aldrich).
Bile acid pool measurements.
To measure the total BA pool, we fasted chow-fed mice for 5 h, euthanized them, and collected the liver + gallbladder + small intestine. We doubly homogenized these tissues together in two volumes of 50% methanol using a rotor-stator homogenizer, followed by a Dounce Teflon-glass homogenizer. To 200 μl of each sample, we added deuterated bile acid standard (20 μl of 25 μM d4-cholic acid). In parallel, we generated calibrator curves of each BA measured, in charcoal-stripped tissue. To each sample/calibrator, we added 2 ml of ice-cold acetonitrile, vortexed for 1 h at 2,000 rpm, and centrifuged for 10 min at 11,000 g. Supernatants were transferred to clean glass tube and dried down at 45°C under nitrogen. We then extracted each sample/calibrator a second time in 1 ml of ice-cold acetonitrile, vortexed for 1 h at 2,000 rpm, and centrifuged 10 min at 11,000 g. The supernatant of the second extraction was combined with the first and dried down at 45°C under nitrogen. We resuspended each sample in 200 μl of 55:45 (vol/vol) methanol-water, both with 5 mM ammonium formate. Samples were spun in UltraFree MC 0.2-μm centrifugal filters (Millipore) and transferred to liquid chromatography-mass spectrometry (LC-MS) vials, and 10 μl were injected into ultraperformance liquid chromatography-tandem mass spectrometry vials (UPLC-MS/MS; Waters).
Metabolic cages.
Indirect calorimetry and activity measurements were performed with Comprehensive Laboratory Animal Monitoring system (CLAMS) open-circuit Oxymax system (Columbus Instruments). Mice were individually housed in cages with a known O2 concentration and flow rate. After 1 day of acclimation, measurements were performed for 4 days.
Bomb calorimetry.
Feces were collected from mice caged individually for a 24-h period either during ad libitum feeding or during 24-h refeeding after a 16-h fast. Samples were ground to a fine powder, and calorie content of each sample was determined with a calorimeter (Parr Instrument).
Triolein gavage.
For lipid absorption analysis, the mice underwent a 4-h fast between 7 and 11 AM and then were injected intraperitoneally with poloxamer 407 (1 g/kg body wt; BASA) in PBS (29), before receiving an oral gavage with 200 μl of olive oil containing 2.5 μCi of [3H]triolein {[9–10-3H(N)]triolein; PerkinElmer}.
Mice were bled before the gavage as time 0, and then at 1-, 2-, 4-, 8-, and 24-h postgavage. Plasma samples were analyzed for radioactivity (Tricarb 2910TR Scintillation Counter; PerkinElmer). Lipid extraction from intestine was performed as described (1). For taurocholic acid (TCA) treatment, mice were orally gavaged with 17 mg/kg taurocholic acid in 1.5% NaHCO3 for 3 consecutive days at 6 PM (20), and the experiment was performed on the fourth day. This dose was chosen on the basis of earlier publications demonstrating that a dose in this range has limited or no effects on the BA pool of wild-type mice but can be expected to raise the TCA levels in the TCA-deficient Cyp8b1 knockout mice (19, 22).
TLC separation of lipids.
Lipids extracted from the feces or jejunum of mice gavaged with [3H]triolein were spotted on a silica plate for thin layer chromatography (Millipore), and these were developed with a solvent mixture: hexane-diethyl ether-acetic acid (70:30:1, vol/vol). The lipid species were identified using a running standard composed of the following lipids: oleic acid, 1-oleoyl-rac-glycerol, 1,2-dioleoyl-sn-glycerol, 1,3-diolein, and triolein (all from Sigma-Aldrich). Lipid species were visualized with iodine staining, and corresponding spots were scraped in a scintillation tube for following radioactive counting.
Analysis of lipids using HPLC-MS.
Lipids extracted from intestine and feces were measured separately on two platforms. Free fatty acids were measured at the Biomarkers Core Laboratory of Columbia University on a Waters Xevo TQ MS ACQUITY UPLC system (Waters, Milford, MA) as previously described (9). Other lipid species were analyzed using a 6490 Triple Quadrupole LC-MS system (Agilent Technologies, Santa Clara, CA). Glycerophospholipids and sphingolipids were separated with normal-phase HPLC as reported before (7), with a few modifications. An Agilent Zorbax Rx-Sil column (inner diameter 2.1 × 100 mm) was used under the following conditions: chloroform-methanol-1 M ammonium hydroxide, 89.9:10:0.1, vol/vol (mobile phase A), and chloroform-methanol-water-ammonium hydroxide, 55:39.9:5:0.1, vol/vol (mobile phase B); 95% phase A for 2 min, linear gradient to 30% phase A over 18 min and held for 3 min, and linear gradient to 95% phase A over 2 min and held for 6 min. Sterols and glycerolipids were separated with reverse-phase HPLC using an isocratic mobile phase as before (7) except with an Agilent Zorbax Eclipse XDB-C18 column (4.6 × 100 mm). Quantification of lipid species was accomplished using multiple-reaction-monitoring transitions and instrument settings that were developed in earlier studies (7, 12). Each sample was spiked with a mix of internal standards, containing known concentrations for each of the following species: phosphatidic acid 14:0/14:0, phosphatidylcholine (PC) 14:0/14:0, phosphatidylethanolamine (PE) 14:0/14:0, phosphatidylinositol 12:0/13:0, phosphatidylserine 14:0/14:0, sphingomyelin (SM) d18:1/12:0, monoacylglycerol (MG) 17:0, 1,2-di-O-phytanyl-sn-glycero-3-phosphocholine (4ME) 16:0, diether diacylglycerol (DG), and D5-triacylglycerol 16:0/18:0/16:0 (Avanti Polar Lipids, Alabaster, AL). Endogenous lipid species levels were calculated by measuring the signal intensity of the species relative to the signal intensity of the relevant internal standard species and multiplying by the concentration of the internal standard species.
Statistical analyses.
Data are presented as means ± SE. Data were analyzed by one- and two-way ANOVA or Student’s t-tests, as reported in figure legends.
RESULTS
Cyp8b1−/− ablation eliminates 12α-hydroxy BA production and increases total BA production.
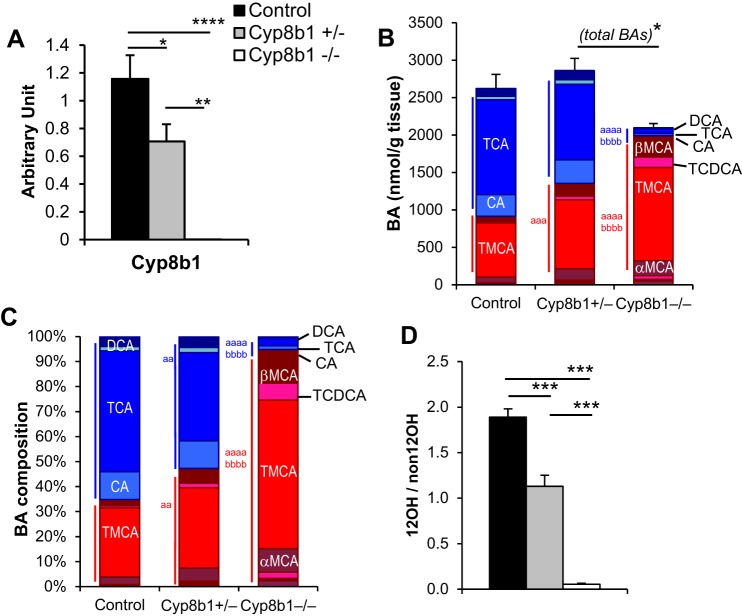
We confirmed in our independently generated, C57BL/6-backcrossed Cyp8b1−/− mouse line that expression levels of Cyp8b1 mRNA were undetectable in knockouts, while heterozygous mice had an intermediate reduction (Fig. 1A). Mice lacking Cyp8b1 have previously been shown to lack all 12α-hydroxylated BAs, whereas total BAs is not reduced, because of compensatory increases in non-12α-hydroxylated BAs (26). To investigate this in our mouse line and test the gene dosage effects, we measured the total BA pool (liver + gallbladder + small intestine) in each genotype. Complete BA data sets are provided in Table 1. We found that Cyp8b1−/− mice had extremely low levels of 12α-hydroxylated BAs and an expansion of the non-12α-hydroxylated BAs (Fig. 1, B and C), as expected. This led to a substantial reduction in the ratio of 12α-hydroxylated to non-12α-hydroxylated BAs (Fig. 1D). There was no significant difference in BA pool size between knockouts and controls, although there was a decrease in the knockouts compared with the heterozygous mice (Fig. 1B). The heterozygous mice showed an intermediate change in BA pool composition (Fig. 1, B–D). These findings demonstrate that deletion of Cyp8b1 leads to gene dosage-dependent decreases in 12α-hydroxy BA composition.
Fig. 1.
Cyp8b1 expression and bile acid quantitation. A: liver gene expression of Cyp8b1. B: absolute quantitation of the total bile acid pool. 12-Hydroxylated bile acids are colored in shades of blue. Non-12-hydroxylated bile acids are colored in shades of red. C: relative bile acid pool composition. D: ratio of 12-hydroxylated to non-12-hydroxylated bile acids. *P < 0.05, **P < 0.01, ***P < 0.001, ****P < 0.0001 between indicated groups. aaP < 0.01, aaaP < 0.001, aaaaP < 0.0001 compared with control; bbbbP < 0.0001 compared with heterozygous. Symbols in blue show statistics for comparisons of 12-hydroxylated bile acids. Symbols in red show statistics for comparisons of non-12-hydroxylated bile acids. DCA, deoxycholic acid; TCDCA, taurochenodeoxycholic acid; TMCA, tauro-α- and tauro-β-muricholic acid.
Table 1.
Total levels of bile acids assessed by LC-MS/MS
| Control | Cyp8b1+/− | Cyp8b1−/− | |
|---|---|---|---|
| CA (12-OH) | 292.1 ± 45.1 | 314.5 ± 75.8 | 31.2 ± 7.8a,e |
| DCA (12-OH) | 94.5 ± 10.9 | 116.6 ± 12.1 | 11.1 ± 2.6c,h |
| TCA (12-OH) | 1,267 ± 115.9 | 1,009.8 ± 17.8 | 63.4 ± 20.4d,g |
| GCA (12-OH) | 8.9 ± 0.5 | 7.7 ± 0.9 | 1.3d,h |
| TDCA (12-OH) | 46.9 ± 5.3 | 60.5 ± 11.9 | 2.4 ± 0.6b,g |
| GDCA (12-OH) | nd | nd | nd |
| CDCA | 6.1 ± 1.1 | 18.33 ± 3 | 50.5 ± 10.2c,f |
| LCA | 2.9 ± 0.3 | 7.0 ± 0.5 | 13.2 ± 3.4b,e |
| UDCA | 8.1 ± 1.2 | 20.2 ± 7 | 48.9 ± 10.5b,e |
| HDCA | 5.2 ± 0.8 | 14.9 ± 1.4b | 6.6 ± 2.4f |
| TCDCA | 21 ± 1.7 | 50.8 ± 6.2 | 142.8 ± 27.2d,g |
| GCDCA | 0.2 | 0.3 ± 0.02 | 0.8 ± 0.2b,f |
| TLCA | 0.4 ± 0.1 | 0.9 ± 0.1 | 1.5 ± 0.4b |
| GUDCA | nd | 0.6 ± 0.0 | 1 ± 0.1 |
| α-MCA | 78.2 ± 7.4 | 152 ± 8.2a | 198.3 ± 41b |
| β-MCA | 65.8 ± 13.3 | 168.4 ± 47.1 | 279.6 ± 36.8b |
| TMCA | 724.7 ± 64.9 | 920.3 ± 47.4 | 1,246 ± 107c,e |
| Total | 2,622.7 ± 189.2 | 2,862.8 ± 163.6 | 2,098.9 ± 54.2e |
| Sum 12-hydroxy | 1,709.5 ± 124 | 1,509 ± 155 | 109.5 ± 21.4d,h |
| Sum non-12-hydroxy | 913.2 ± 74.3 | 1,353.4 ± 63.5c | 1,989.4 ± 44.3d,h |
Values are means ± SE and are given in nanomoles per gram. CA, cholic acid; DCA, deoxycholic acid; TCA, taurocholic acid; GCA, glycocholic acid; TDCA, taurodeoxycholic acid; GDCA, glycodeoxycholic acid; CDCA, chenodeoxycholic acid; LCA, lithocholic acid; UDCA, ursodeoxycholic acid; HDCA, hyodeoxycholic acid; TCDCA taurochenodeoxycholic acid; GCDCA, glycochenodeoxycholic acid; TLCA, taurolithocholic acid; GUDCA, glycoursodeoxycholic acid; α-MCA, α-muricholic acid; β-MCA, β-muricholic acid; TMCA, tauro-α- and tauro-β-muricholic acid; nd, not detected. Species marked “(12-OH)” are 12α-hydroxylated. Those that are unmarked are non-12α-hydroxylated. Sum 12-hydroxy, sum of CA, DCA, TCA, and TDCA.
P < 0.05,
P < 0.01,
P < 0.001,
P < 0.0001 vs. control,
P < 0.05,
P < 0.01,
P < 0.001,
P < 0.0001 vs. Cyp8b1+/− measured by one-way ANOVA (n = 6).
Cyp8b1−/− mice gain less weight when fed a WTD.
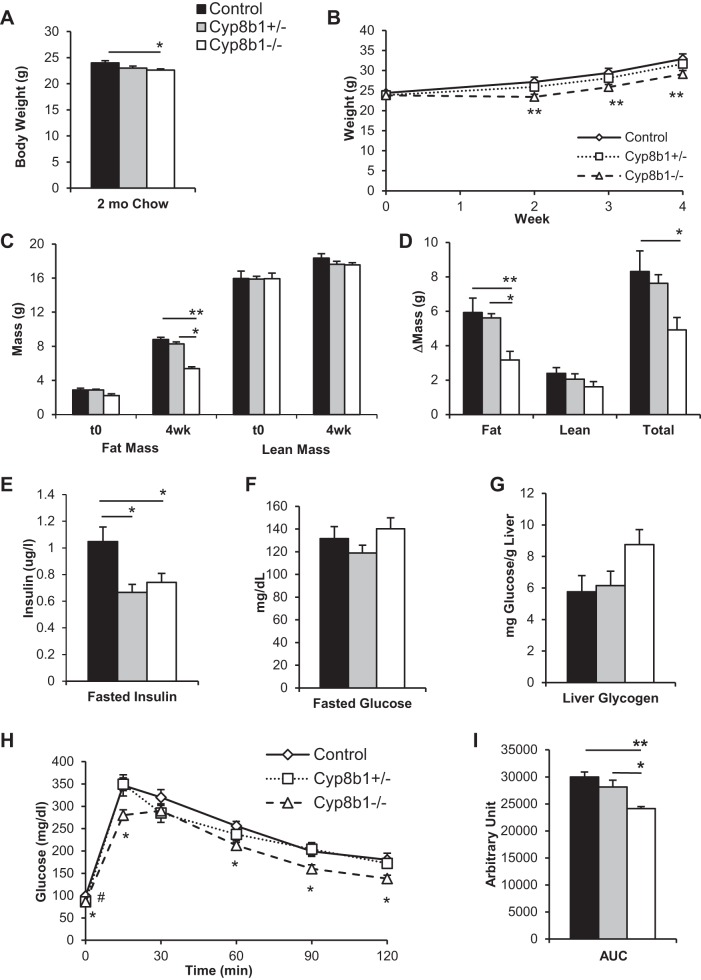
We analyzed the body weight of mice fed a standard chow diet, and at 8 wk of age, Cyp8b1−/− mice had a lower body weight than littermate controls (Fig. 2A), similar to what was previously reported (20). Next, we selected mice from each genotype that were weight-matched, because of natural variation, and fed them for 4 wk with a WTD containing 42% kcal from milk fat and 0.2% cholesterol. We found that Cyp8b1−/− mice gained less weight than controls, leading to 15.2% lower body weight after 4 wk (Fig. 2B). Analysis of body composition revealed that this difference was entirely due to fat mass, as Cyp8b1−/− mice gained 47% less fat mass than controls (Fig. 2, C and D). There were no differences in body length (control, 9.50 ± 0.08 cm; Cyp8b1+/−, 9.41 ± 0.05 cm; Cyp8b1−/−, 9.31 ± 0.03 cm, P = 0.4 and 0.07). Cyp8b1 heterozygous mice showed no significant differences in body weight or body composition compared with wild-type controls.
Fig. 2.
Body weight, mass composition, and glucose tolerance. A: body weight of mice on chow diet. B: body weight curve on Western-type diet (WTD). C: body mass composition at the beginning (t0) and after 4-wk WTD feeding. D: change in mass due to WTD. E and F: plasma insulin and glucose after an overnight fast. G: hepatic content of glycogen after 4-h refeeding WTD. H and I: oral glucose tolerance test and area under the curve (AUC). Values are displayed as means ± SE; n = 7. For acylglycerols and cholesterol, values were averaged from two technical replicates. Statistical significance is represented as *P < 0.05, **P < 0.01 measured by one-way ANOVA. For B, we used ANOVA with repeated measures.
Consistent with their low body weight and with previously published findings (4, 20), WTD-fed Cyp8b1-deficient mice showed improved insulin sensitivity. Both Cyp8b1−/− and Cyp8b1+/− mice showed lower insulin levels after a 6-h fast, with normal plasma glucose (Fig. 2, E and F). The knockouts tended to have increased liver glycogen upon refeeding (P = 0.052, Fig. 2G). These mice also showed improved oral glucose tolerance, with a 20% decreased area under the curve compared with wild-type controls (Fig. 2, H and I). These findings demonstrate that WTD-fed Cyp8b1−/− mice have improved insulin sensitivity compared with WTD-fed littermate controls. Heterozygous Cyp8b1+/− mice showed no significant difference in liver glycogen or glucose tolerance compared with controls, although their fasting insulin was lower; thus their improvements in insulin sensitivity were milder than total knockouts.
Cyp8b1−/− mice are resistant to liver lipid accumulation.
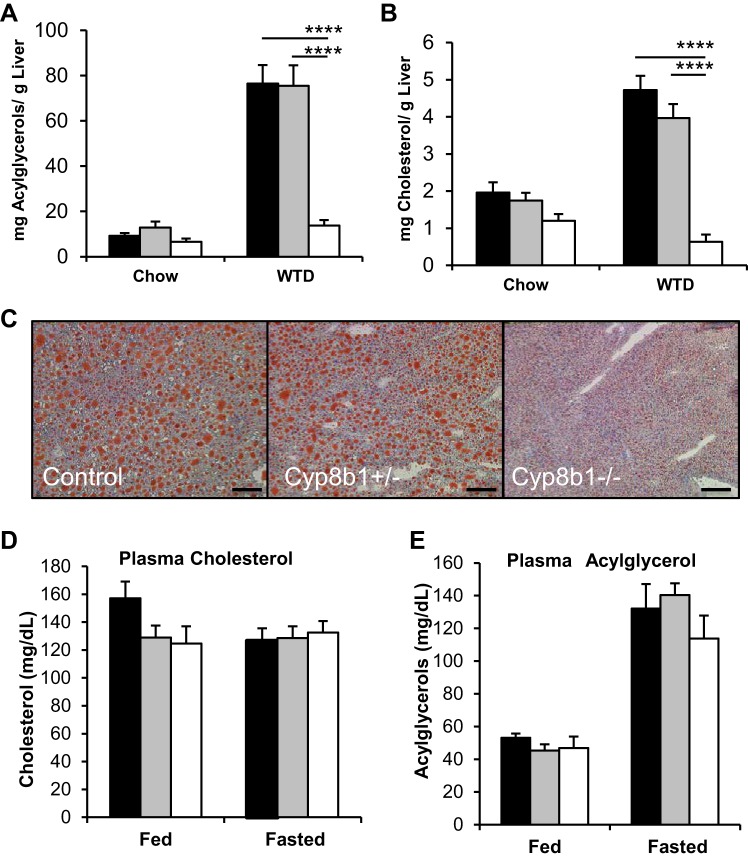
There was an 80% reduction in liver acylglycerols and cholesterol of Cyp8b1-deficient mice fed a WTD compared with littermate controls (Fig. 3, A–C). Cyp8b1−/− mice showed a trend toward decreased plasma cholesterol in refed conditions (P = 0.078) but no changes in plasma triglycerides (Fig. 3, D and E). These findings demonstrate that the absence of Cyp8b1 protects almost completely against WTD-induced hepatic steatosis.
Fig. 3.
Hepatic and circulating lipids. A–C: hepatic acylglycerols and cholesterol during chow and WTD feeding and Oil Red O staining of frozen livers. Scale bar is 200 μm. D and E: plasma levels of cholesterol and acylglycerols in the ad libitum fed and overnight fasted state. Values are displayed as means ± SE; n = 7. For cholesterol and acylglycerols, results are averaged from two technical replicates. Statistical significance is represented as ****P < 0.0001 Cyp8b1+/− vs. control, measured by one-way ANOVA.
Fecal caloric content, but not energy expenditure, can contribute to protection from WTD feeding.
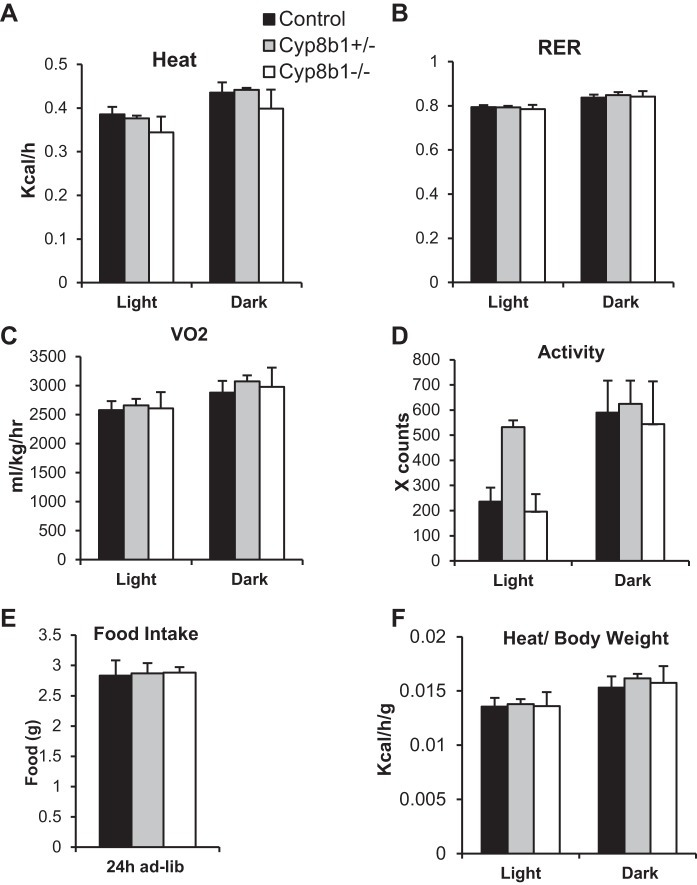
Next, we measured energy expenditure and metabolic fuel selection in WTD-fed mice to identify any imbalances in energy metabolism. We found no differences in energy expenditure, respiratory exchange ratio, oxygen consumption, locomotor activity, or food intake between the genotypes (Fig. 4, A–E). Thus neither excess energy expenditure nor decreased food intake can explain the low body weight of WTD-fed Cyp8b1 knockout mice. To exclude the possibility that the difference in body weight could influence energy expenditure calculations, we also normalized the measurement per gram of body weight but still found no differences between the genotypes (Fig. 4F).
Fig. 4.
Energy expenditure and fecal caloric output. A–D: indirect calorimetry measurement of heat production, respiratory exchange ratio (RER), volume of oxygen consumed (V̇o2), and locomotor activity. E: 24-h food intake on WTD. F: quantification of heat production per gram of body weight. Values are displayed as means ± SE; n = 8; ad-lib, ad libitum.
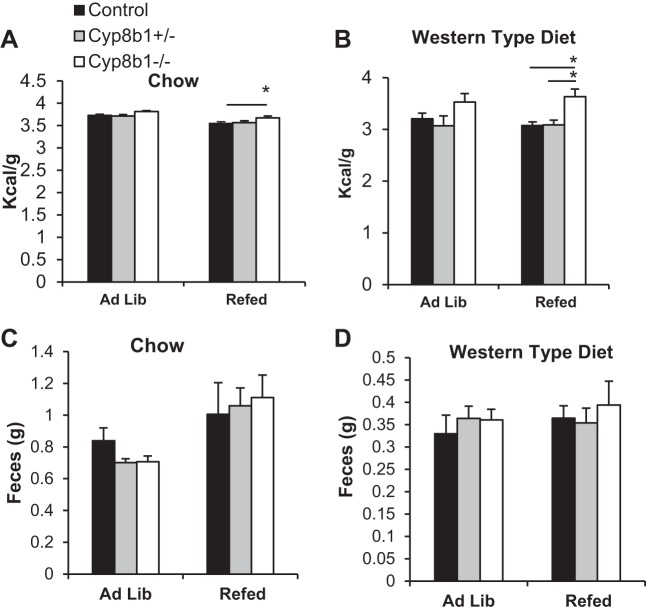
We hypothesized that reduced intestinal lipid absorption due to the altered BA composition might explain the protection from both the body weight gain and liver lipid accumulation in Cyp8b1−/− mice. We first investigated this by performing bomb calorimetry to analyze the calorie content of the feces. We found that during both standard chow and WTD feeding, Cyp8b1−/− mice had increased fecal calorie excretion, with a greater discrepancy with the latter diet (Fig. 5, A and B), while still producing the same amount of feces (Fig. 5, C and D).
Fig. 5.
Fecal caloric output. A and B: fecal caloric content from chow- and WTD-fed mice, as measured by bomb calorimetry. C and D: fecal mass output from chow- and WTD-fed mice collected over a 24-h period. Values are displayed as means ± SE; n = 8. Values were averaged from two technical replicates. Statistical significance is shown as *P < 0.05, measured by two-way ANOVA.
Cyp8b1 deficiency increases excretion of hydrolyzed fats.
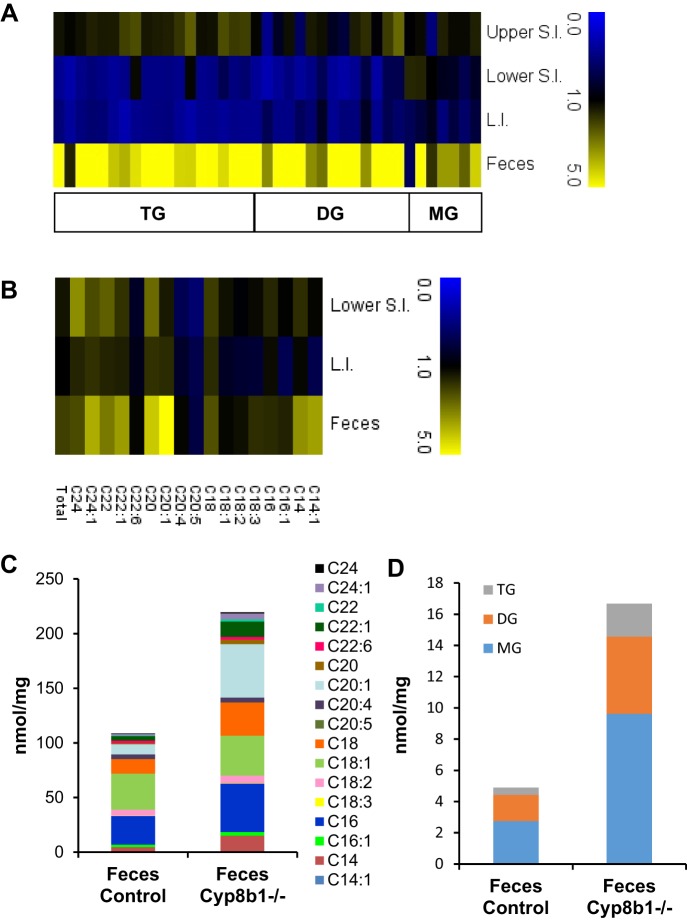
We expected that the increased calories in feces of Cyp8b1−/− mice were caused by lipid excretion. Indeed, these mice are known to have poor cholesterol absorption (30), however, the mechanisms responsible for the absorption of cholesterol and triglyceride are distinct (18). For example, bile acid composition regulates cholesterol absorption through effects on solubility of cholesterol in the lumen as well as esterification of cholesterol within the enterocyte (44). To test the absorption of dietary fat and to determine the types of lipids excreted, we performed lipidomic analysis of fecal samples, collected over a 24-h period. We also analyzed intestinal samples, collected after a 5-h refeeding period. Intestinal samples contained intact tissue as well as any lumenal contents. When expressed as relative values (Cyp8b1−/− vs. controls), we found that acylglycerols and free fatty acids were substantially higher in feces of Cyp8b1−/− mice, particularly for fatty acids with longer acyl chain lengths (Fig. 6, A and B, and Tables 2 and 3). In the upper small intestine, most lipid species were normal or slightly elevated in Cyp8b1−/− mice. In the lower small intestine and large intestine, Cyp8b1−/− mice had marked decreases in most lipids, except free fatty acids, which were higher, especially saturated fatty acids.
Fig. 6.
Lipidomic analysis. A and B: heat maps representing the ratio of Cyp8b1−/− mice to littermate controls for lipid species in intestinal tissue and feces. Triacylglycerol, diacylglycerol, and monoacylglycerol (TG, DG, and MG; A) and free fatty acids (B). C and D: quantitation of lipid species in feces (n = 8). L.I., large intestine; S.I., small intestine.
Table 2.
Total levels of free fatty acids in intestine and feces assessed by HPLC-MS
| Small Intestine |
Large Intestine |
Feces |
||||
|---|---|---|---|---|---|---|
| Control | Cyp8b1−/− | Control | Cyp8b1−/− | Control | Cyp8b1−/− | |
| C14 | 11.47 ± 1.70 | 19.78 ± 1.54† | 5.61 ± 0.69 | 6.35 ± 0.94 | 4.54 ± 1.82 | 14.92 ± 4.89 |
| C14:1 | 0.29 ± 0.03 | 0.33 ± 0.03 | 0.13 ± 0.01 | 0.09 ± 0.01 | 0.05 ± 0.01 | 0.18 ± 0.04† |
| C16 | 29.90 ± 2.91 | 47.93 ± 3.00‡ | 18.35 ± 2.06 | 21.95 ± 2.70 | 26.36 ± 7.17 | 44.25 ± 12.50 |
| C16:1 | 10.69 ± 1.23 | 11.15 ± 1.27 | 4.74 ± 0.51 | 3.23 ± 0.52 | 2.18 ± 0.85 | 3.40 ± 1.23 |
| C18 | 8.89 ± 0.88 | 17.50 ± 1.30‡ | 7.04 ± 1.15 | 11.97 ± 1.69* | 13.32 ± 2.87 | 30.36 ± 7.95 |
| C18:1 | 50.49 ± 4.04 | 64.56 ± 4.04* | 31.34 ± 2.92 | 26.77 ± 3.66 | 32.95 ± 11.38 | 36.57 ± 10.67 |
| C18:2 | 26.05 ± 1.69 | 25.31 ± 1.74 | 17.12 ± 1.62 | 13.94 ± 2.16 | 5.50 ± 2.13 | 6.91 ± 3.59 |
| C18:3 | 2.04 ± 0.18 | 2.38 ± 0.27 | 1.16 ± 0.14 | 0.92 ± 0.16 | 0.24 ± 0.10 | 0.41 ± 0.20 |
| C20 | 0.16 ± 0.02 | 0.43 ± 0.04§ | 0.28 ± 0.07 | 0.50 ± 0.07* | 1.02 ± 0.11 | 4.24 ± 0.66‡ |
| C20:1 | 2.65 ± 0.30 | 3.75 ± 0.30* | 2.79 ± 0.62 | 4.72 ± 0.80 | 9.37 ± 2.17 | 48.94 ± 12.63† |
| C20:4 | 5.76 ± 0.60 | 3.91 ± 0.47* | 3.56 ± 0.49 | 2.97 ± 0.33 | 4.01 ± 2.21 | 4.21 ± 2.10 |
| C20:5 | 0.62 ± 0.06 | 0.35 ± 0.05† | 0.32 ± 0.05 | 0.23 ± 0.03 | 0.28 ± 0.16 | 0.21 ± 0.12 |
| C22 | 0.04 ± 0.01 | 0.11 ± 0.01‡ | 0.16 ± 0.03 | 0.26 ± 0.03 | 0.66 ± 0.06 | 1.94 ± 0.31† |
| C22:1 | 0.26 ± 0.02 | 0.47 ± 0.04‡ | 0.64 ± 0.16 | 0.97 ± 0.13 | 4.07 ± 0.96 | 14.11 ± 2.80† |
| C22:6 | 1.70 ± 0.25 | 1.45 ± 0.09 | 1.21 ± 0.15 | 1.09 ± 0.12 | 2.24 ± 1.26 | 2.36 ± 0.95 |
| C24 | 0.03 ± 0.01 | 0.10 ± 0.01‡ | 0.15 ± 0.02 | 0.24 ± 0.02* | 0.46 ± 0.04 | 1.01 ± 0.20* |
| C24:1 | 0.09 ± 0.01 | 0.19 ± 0.01§ | 0.26 ± 0.04 | 0.45 ± 0.07* | 1.45 ± 0.32 | 5.40 ± 1.20† |
| Total | 151.13 ± 10.92 | 199.69 ± 11.99* | 94.85 ± 9.34 | 96.65 ± 11.72 | 108.70 ± 32.92 | 219.44 ± 49.42 |
| Saturated | 50.49 ± 5.35 | 85.85 ± 5.16‡ | 31.58 ± 3.92 | 41.26 ± 5.33 | 46.36 ± 11.95 | 96.72 ± 25.9 |
| Unsaturated | 100.64 ± 6.86 | 113.83 ± 7.52 | 63.26 ± 5.9 | 55.38 ± 7.42 | 62.33 ± 21.14 | 122.72 ± 31.1 |
| LCFA (C14–C20) | 149.01 ± 10.98 | 197.38 ± 11.96* | 92.42 ± 9.04 | 93.64 ± 11.44 | 99.81 ± 30.39 | 194.62 ± 45.55 |
| VLCFA (≥C22) | 2.11 ± 0.23 | 2.3 ± 0.11 | 2.42 ± 0.34 | 3.00 ± 0.31 | 8.89 ± 2.58 | 24.82 ± 5.12* |
Values are means ± SE and given as nanomoles per milligram. LCFA, long chain fatty acids; VLCFA, very long chain fatty acids.
P < 0.05,
P < 0.01,
P < 0.001,
P < 0.0001 measured by Student’s t-test (n = 8).
Table 3.
Total levels of other lipid species in intestine and feces assessed by HPLC-MS
| Upper Small Intestine |
Lower Small Intestine |
Large Intestine |
Feces |
|||||
|---|---|---|---|---|---|---|---|---|
| Control | Cyp8b1−/− | Control | Cyp8b1−/− | Control | Cyp8b1−/− | Control | Cyp8b1−/− | |
| MG | 3.30 ± 0.14 | 4.12 ± 0.19† | 7.37 ± 0.35 | 6.32 ± 0.37 | 9.09 ± 0.94 | 6.65 ± 0.44* | 2.76 ± 0.96 | 9.63 ± 7.03 |
| DG | 11.86 ± 1.89 | 14.75 ± 1.15 | 18.51 ± 2.49 | 8.67 ± 1.74† | 8.86 ± 1.68 | 5.15 ± 0.44* | 1.67 ± 0.44 | 4.95 ± 2.08 |
| TG | 36.63 ± 6.01 | 59.34 ± 10.22 | 135.84 ± 20.79 | 70.68 ± 10.77† | 69.39 ± 10.73 | 31.72 ± 4.95† | 0.46 ± 0.13 | 2.10 ± 0.91 |
| SM | 12.70 ± 0.69 | 14.05 ± 0.92 | 8.36 ± 0.87 | 5.10 ± 0.70† | 4.48 ± 0.43 | 3.32 ± 0.32* | 0.06 ± 0.02 | 0.75 ± 0.51 |
| PC | 32.35 ± 2.26 | 34.46 ± 1.38 | 23.38 ± 1.89 | 15.38 ± 1.72† | 14.68 ± 1.56 | 11.82 ± 1.27 | 0.09 ± 0.05 | 0.44 ± 0.20 |
| PE | 11.80 ± 1.08 | 10.99 ± 0.58 | 0.36 ± 0.03 | 0.20 ± 0.04† | 0.19 ± 0.03 | 0.16 ± 0.02 | 0.01 ± 0.01 | 0.01 ± 0.01 |
Values are means ± SE and given as nanomoles per milligram. MG, monoacylglycerol; DG, diacylglycerol; TG, triacylglycerol; SM, sphingomyelin; PC, phosphatidylcholine; PE, phosphatidylethanolamine. MG group is composed of MG 16:0, MG 16:1, MG 18:0, MG 18:1, MG 18:2, MG 18:3, MG 20:0, MG 20:2, MG 20:3, MG 20:4, MG 22:0, MG 22:3, MG 22:4, and MG 22:5. DG group is composed of DG 28:0/14:0, DG 30:0/14:0, DG 30:1/14:0, DG 32:0/16:0, DG 32:1/16:0, DG 32:2/16:1, DG 34:0/16:0, DG 34:1/16:0, DG 34:2/16:0, DG 34:2/16:1, DG 36:0/18:0, DG 36:1/18:0, DG 36:2/18:0, DG 36:2/18:1, DG 36:3/18:1, DG 36:4/18:0, DG 38:2/18:0, DG 38:2/18:1, DG 38:3/18:0, DG 38:3/18:1, DG 38:4/18:0, DG 38:4/18:1, DG 40:4/18:0, DG 40:5/18:0, DG 40:5/18:1, DG 40:6/18:0, and DG 40:6/18:1. TG group is composed of TG 48:0/16:0, TG 48:1/16:0, TG 50:0/16:0, TG 50:1/16:1, TG 50:2/16:1, TG 52:0/18:0, TG 52:1/18:0, TG 52:2/18:0, TG 52:3/18:1, TG 52:4/18:1, TG 52:5/20:4, TG 54:0/18:0, TG 54:1/18:0, TG 54:2/18:0, TG 54:3/18:0, TG 54:4/18:1, TG 54:4/20:4, TG 54:5/18:1, TG 54:6/18:1, TG 54:6/20:4, TG 54:7/18:1, TG 56:4/18:1, TG 56:4/20:4, TG 56:5/18:1, TG 56:8/20:4, TG 56:9/20:4, TG 58:7/20:4, TG 58:8/22:6, and TG 58:9/22:6. SM group is composed of SM d18:1/16:0, SM d18:1/16:1, SM d18:1/18:0, SM d18:1/18:1, SM d18:1/20:0, SM d18:1/20:1, SM d18:1/22:0, SM d18:1/22:1, SM d18:1/24:0, and SM d18:1/24:1. PC group is composed of PC 30:0, PC 32:0, PC 32:1, PC 34:0, PC 34:1, PC 34:2, PC 36:0, PC 36:1, PC 36:2, PC 36:3, PC 36:4, PC 38:1, PC 38:2, PC 38:3, PC 38:4, PC 38:5, PC 38:6, PC 40:4, PC 40:5, PC 40:6, and PC 40:7. PE group is composed of PE 30:0, PE 32:0, PE 32:1, PE 34:0, PE 34:1, PE 34:2, PE 36:0, PE 36:1, PE 36:2, PE 36:3, PE 36:4, PE 38:0, PE 38:1, PE 38:2, PE 38:3, PE 38:4, PE 38:5, PE 38:6, PE 40:4, PE 40:5, and PE 40:6.
P < 0.05,
P < 0.01 in Cyp8b1−/− vs. controls measured by Student’s t-test (n = 8).
When expressed quantitatively, we found that free fatty acids were the most abundant lipids in feces of Cyp8b1−/− mice, at a total concentration of 219 nmol/mg (Fig. 6C), followed by monoacylglycerols at 9.62 nmol/mg (Fig. 6D). Triglycerides, although tending to be relatively higher in Cyp8b1−/− feces compared with controls, were present at low concentrations. This indicates that the excess fat excreted by Cyp8b1−/− mice primarily consists of hydrolyzed triglycerides.
Intestinal lipid absorption is reduced in mice lacking Cyp8b1.
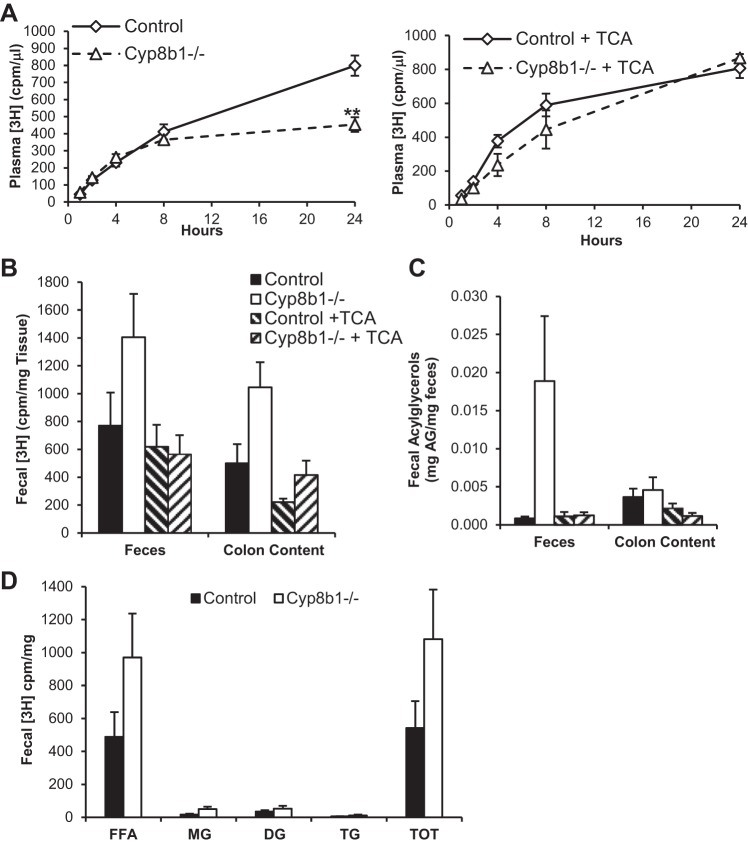
To directly test the absorption of intestinal triglycerides, we used a radiolabeled triglyceride tracer. We injected mice with poloxamer 407 to block lipoprotein clearance (29) and administered olive oil containing [3H]triolein by oral gavage. For each genotype, we used untreated mice and those treated for 3 days with TCA, the major 12α-hydroxylated BA species absent from Cyp8b1−/− mice (Table 1 and Fig. 1B; 26). We found that plasma [3H] levels of untreated mice reached a level 43.1% lower in Cyp8b1−/− compared with controls (Fig. 7A). However, plasma tracer levels were fully restored in mice treated with TCA, indicating that this BA species is sufficient to promote triglyceride absorption.
Fig. 7.
Lipid absorption. A: plasma [3H]triolein-derived counts [counts/min (cpm)] in untreated (left) and TCA-treated mice (right). B: [3H] counts in feces and colon contents (cpm/mg). C: total acylglycerols (AG) in feces and colon contents. D: triolein-derived [3H] counts in lipid species separated by thin layer chromatography. Here, n = 6. Statistical significance is represented as **P < 0.01, measured by one-way ANOVA. TOT, total.
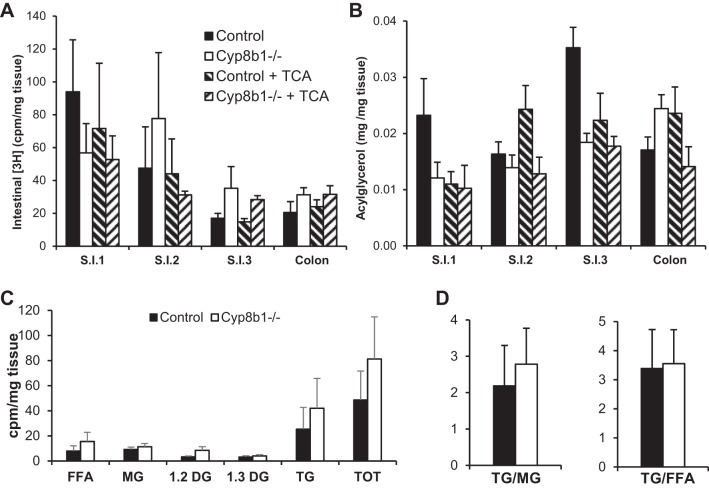
To determine the fate of the tracer, we measured its levels in the intestine, in the lumenal contents of the colon, and in the feces. Twenty-four hours after delivering the tracer, we found no differences between genotypes in the [3H] content of the intestine (Fig. 8A). However, Cyp8b1−/− mice tended to have higher levels of the tracer in colon contents (P = 0.06) and feces (P = 0.16), which were normalized after TCA treatment (Fig. 7B).
Fig. 8.
Lipid accumulation in the enterocytes. A: triolein-derived [3H] in intestinal wall (cpm/mg). B: total acylglycerols in intestine. C: triolein-derived counts in lipid species separated by thin layer chromatography in jejunum (cpm/mg). D: ratio of TG to MG and TG to FFA. Here, n = 6.
We also analyzed the total acylglycerol content in these same tissues and feces. We found that in Cyp8b1−/− mice, acylglycerols tended to be decreased in the small intestine (Fig. 8B) but increased in stool, and this was normalized after TCA treatment (Fig. 7C).
To assess the hydrolysis of the triglyceride tracer, we separated lipid species from fecal lipid extracts using thin layer chromatography. Feces from Cyp8b1−/− mice tended to have increases in all lipid species, but the vast majority of tracer was found in the free fatty acid fraction (Fig. 7D). This indicates that the altered BA composition in these mice causes defective lipid absorption but sustains normal triglyceride hydrolysis. To assess the reesterification of the absorbed lipids within the enterocytes, we performed thin layer chromatography on jejunal tissue (Fig. 8C). We found no differences in the ratio of triglyceride to monoacylglycerol or the ratio of triglyceride to free fatty acid (Fig. 8D). This indicates that the altered BA composition in these mice does not adversely impact triglyceride synthesis in enterocytes.
Fat-free diet feeding normalizes body weight and steatosis phenotypes.
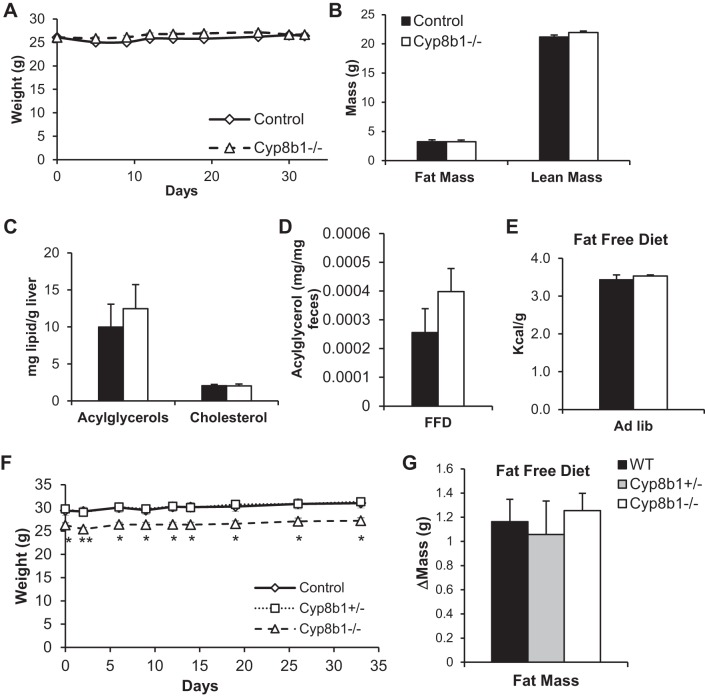
To determine whether the dampened absorption of dietary fat was responsible for the differences between genotypes, we fed the mice with a fat-free diet (FFD). We performed this experiment in mice that were weight matched, because of natural variation. In opposition to what we witnessed for normal chow and WTD, no differences in body weight developed between the two genotypes over the 4-wk FFD feeding period (Fig. 9A). Moreover, FFD-fed mice showed no differences between genotypes in fat mass, liver fat, fecal acylglycerols, or fecal calories (Fig. 9, B–E).
Fig. 9.
Fat-free diet feeding. A: body weight curves of mice on fat-free diet, for mice starting at the same body weight. B–E show measurements from these mice. B: body mass composition after 3-wk FFD feeding. C: hepatic levels of acylglycerols and cholesterol. D: levels of fecal acylglycerols. E: fecal caloric content from mice fed FFD, ad libitum. F: body weight curve of mice on FFD. G: fat mass gain after 4 wk of FFD feeding, for same mice shown in F. Values are displayed as mean ± SE; n = 6. Statistical significance is represented as *P < 0.05, **P < 0.01, Cyp8b1−/− vs. control, measured by one-way ANOVA. WT, wild type.
We also performed this experiment in typical cohorts where Cyp8b1−/− mice weigh less than controls at baseline and then fed the mice the FFD. In this experiment, there was no further divergence in body weight between genotypes, and the mice gained an equal amount of fat over the 4-wk FFD feeding period (Fig. 9, F and G). Overall, these findings demonstrate that dietary fat is the primary cause of the lean phenotype of Cyp8b1-deficient mice.
DISCUSSION
In this work, we show that CYP8B1 is necessary to promote dietary lipid absorption in mice. The absence of Cyp8b1 led to reductions in WTD-induced weight gain, improved insulin sensitivity, and remarkable resistance to fatty liver. These changes were due to malabsorption of dietary fat, subsequent to altered BA composition, without any depletion of the total BA pool size. Amid the robust interest in the metabolic effects of BA signaling pathways, these findings reemphasize the importance of the surfactant function of these molecules in regulating systemic energy metabolism.
Cholic acid (CA), the major product of CYP8B1 activity, has been studied at length for its importance in cholesterol homeostasis. In mice, it is required for activating FXR and the downstream negative feedback loops that regulate the conversion of cholesterol into BA (26). CA also has a central role in promoting intestinal cholesterol absorption (30), an effect that is independent of FXR (32). This combination of increased cholesterol catabolism and decreased cholesterol absorption leads to reduced atherosclerosis and reduced gallstone formation in Cyp8b1-deficient mice (32, 39, 42). Thus eliminating CA may be cardioprotective.
On the other hand, the links between 12α-hydroxylated BAs and energy metabolism have only recently been appreciated. Our laboratory demonstrated that human subjects in the lowest quartile of BA 12α-hydroxylation had improvements in insulin-stimulated glucose disposal as well as lower free fatty acids, triglycerides, and fatty liver (13). Thus understanding the direct links between 12α-hydroxy BAs and lipid homeostasis is relevant to humans. Recent work from two laboratories has demonstrated that Cyp8b1−/− mice have low body weight, improved glucose tolerance, and higher calorie excretion (4, 20). In the present work we demonstrate that these changes are due to reduced absorption of dietary triglycerides, despite normal triglyceride hydrolysis and normal triglyceride synthesis in the intestinal wall. We showed that the absorption can be restored with TCA treatment. Finally, we definitively demonstrated that the effects of Cyp8b1 on body weight are due to intestinal fat, as there are no changes in energy expenditure, and the phenotypes are normalized when mice are fed a fat-free diet. These findings suggest the possibility of treating obesity by altering the bile acid pool composition to decrease 12α-hydroxy BAs (such as TCA). Such a treatment strategy may require substantial alterations in BA composition to affect whole body energy metabolism, as indicated by the mild phenotype of Cyp8b1 heterozygous mice. Nevertheless, it may have the dual effect of reducing intestinal fat absorption and, at the same time, improving glucose metabolism.
A key mechanism by which BAs promote lipid absorption is by solubilizing lipids near the brush border membrane, to allow uptake into enterocytes. However, BAs are also important for the activity of pancreatic lipase, particularly in acidic conditions, as found in the duodenum and jejunum (5). Our findings demonstrate that the altered BA composition of Cyp8b1−/− mice affects the ultimate uptake of fat into the enterocytes, despite relatively normal fat hydrolysis. Although there are some limitations in our methods—collecting feces over 24 h may introduce some bias due to metabolism by fecal microbiota, and our intestinal samples are a combination of lumenal contents as well as intestinal tissue—overall, these findings suggest that the physicochemical properties of BAs affect fat uptake and fat hydrolysis differently.
A wealth of prior evidence demonstrates the importance of intestinal fat absorption in body weight maintenance. A critical step in fat absorption is the glycerol phosphate pathway, where free fatty acids and monoacylglycerols absorbed by the enterocytes are reesterified into triglycerides to be packaged into chylomicrons. This process is performed by monoacylglycerol and diacylglycerol acyltransferases (MGATs and DGATs). Indeed, deletion or inhibition of MGAT2 or DGAT1 results in reduced fat absorption, resistance to obesity, improved glucose tolerance, and reduced fatty liver (1, 35, 38, 45). Inhibitors of pancreatic lipase also reduce intestinal fat absorption and cause weight loss, because of excretion of intact dietary triglycerides (17, 23). Our current finding that Cyp8b1−/− mice excrete hydrolyzed fats and show no aberrant accumulation of lipid in the intestinal wall indicates that the mechanisms and consequences of the lipid malabsorption in these mice are unique compared with inhibition of MGAT, DGAT, or pancreatic lipase.
These new data may shed light on whether aberrant regulation of Cyp8b1 can contribute to the pathogenesis of obesity and insulin resistance. Cyp8b1 expression is regulated by insulin action: its expression requires FoxO transcription factors, which are inactivated by insulin signaling. This is clearly shown in mice lacking FoxO1, which are insulin sensitive and have low levels of 12α-hydroxy BAs (15). On the other hand, murine models of diabetes have increased 12α-hydroxy BAs: genetic ablation of hepatic insulin receptor causes an increase in FoxO1 activity and a higher abundance of CA (3). A similar result was found in nonobese spontaneously diabetic mice (36) and alloxan-treated mice (2). This effect also occurs in human subjects with obesity and type 2 diabetes, who have higher 12α-hydroxy BA synthesis (6, 14). Our findings suggest that this change in BA pool composition may increase the absorption not only of cholesterol (2) but also dietary triglycerides. Thus it is possible that the effect of insulin resistance to change BA composition in the natural history of type 2 diabetes further worsens metabolic outcomes in a feed-forward fashion.
We have demonstrated that eliminating 12α-hydroxy BAs improves body weight, liver steatosis, and lipid homeostasis during Western diet feeding. This is due to reduced intestinal absorption of fat. This is no particular hindrance in normal feeding conditions but is protective when consuming a fat-rich diet. These findings suggest the possibility of CYP8B1 as a therapeutic target for obesity, fatty liver, and hypertriglyceridemia.
GRANTS
This work was supported by funds from the National Institutes of Health including R00-HL-111206, P30-DK-063608, the Hormone and Metabolite Core Facility (P30-DK-026687), and the Biomarkers Core Facility (UL1-TR-001873) and unrestricted funds from Merck Research Laboratories, the New York Community Trust (P14-000886), and the Russell Berrie Foundation.
DISCLAIMERS
The content is solely the responsibility of the authors and does not necessarily represent the official views of the National Institutes of Health.
DISCLOSURES
K. K. Jensen, L. Wang, and J. Castro-Perez are former employees of Merck Research Laboratories. G. Di Paolo is an employee at Denali Therapeutics Incorporated. All other authors have no conflicts of interest to declare.
AUTHOR CONTRIBUTIONS
E.B. and R.A.H. conceived and designed research; E.B., Y.X., G.D.P., and R.B.C. performed experiments; E.B., Y.X., G.D.P., R.B.C., and R.A.H. analyzed data; E.B., K.K.J., J.C.-P., L.W., and R.A.H. interpreted results of experiments; E.B. prepared figures; E.B. and R.A.H. drafted manuscript; E.B., K.K.J., J.C.-P., Y.X., G.D.P., R.B.C., L.W., and R.A.H. edited and revised manuscript; E.B., K.K.J., J.C.-P., Y.X., G.D.P., R.B.C., L.W., and R.A.H. approved final version of manuscript.
ACKNOWLEDGMENTS
We gratefully acknowledge Thomas Kolar and Ana Flete for technical assistance and Mark Erion, David Kelley, Martin Brenner, Rudy Leibel, Henry Ginsberg, Domenico Accili, Utpal Pajvani, Sei Higuchi, Santhosh Satapati, Qing Dallas-Yang, and Xiaodong Yang for helpful advice and support.
Present address of J. Castro-Perez: Waters Corporation, 34 Maple St., Milford, MA 01757.
Present address of K. K. Jensen: Schrodinger, 120 West 45th St., 17th floor. New York, NY 10035.
Present address of L. Wang: Morphic Therapeutic, 35 Gatehouse Dr., Waltham, MA 02451.
REFERENCES
- 1.Ables GP, Yang KJ, Vogel S, Hernandez-Ono A, Yu S, Yuen JJ, Birtles S, Buckett LK, Turnbull AV, Goldberg IJ, Blaner WS, Huang LS, Ginsberg HN. Intestinal DGAT1 deficiency reduces postprandial triglyceride and retinyl ester excursions by inhibiting chylomicron secretion and delaying gastric emptying. J Lipid Res 53: 2364–2379, 2012. doi: 10.1194/jlr.M029041. [DOI] [PMC free article] [PubMed] [Google Scholar]
- 2.Akiyoshi T, Uchida K, Takase H, Nomura Y, Takeuchi N. Cholesterol gallstones in alloxan-diabetic mice. J Lipid Res 27: 915–924, 1986. [PubMed] [Google Scholar]
- 3.Biddinger SB, Haas JT, Yu BB, Bezy O, Jing E, Zhang W, Unterman TG, Carey MC, Kahn CR. Hepatic insulin resistance directly promotes formation of cholesterol gallstones. Nat Med 14: 778–782, 2008. doi: 10.1038/nm1785. [DOI] [PMC free article] [PubMed] [Google Scholar]
- 4.Bonde Y, Eggertsen G, Rudling M. Mice abundant in muricholic bile acids show resistance to dietary induced steatosis, weight gain, and to impaired glucose metabolism. PLoS One 11: e0147772, 2016. doi: 10.1371/journal.pone.0147772. [DOI] [PMC free article] [PubMed] [Google Scholar]
- 5.Borgstroem B. Influence of bile salt, pH, and time on the action of pancreatic lipase; physiological implications. J Lipid Res 5: 522–531, 1964. [PubMed] [Google Scholar]
- 6.Brufau G, Stellaard F, Prado K, Bloks VW, Jonkers E, Boverhof R, Kuipers F, Murphy EJ. Improved glycemic control with colesevelam treatment in patients with type 2 diabetes is not directly associated with changes in bile acid metabolism. Hepatology 52: 1455–1464, 2010. doi: 10.1002/hep.23831. [DOI] [PubMed] [Google Scholar]
- 7.Chan RB, Oliveira TG, Cortes EP, Honig LS, Duff KE, Small SA, Wenk MR, Shui G, Di Paolo G. Comparative lipidomic analysis of mouse and human brain with Alzheimer disease. J Biol Chem 287: 2678–2688, 2012. doi: 10.1074/jbc.M111.274142. [DOI] [PMC free article] [PubMed] [Google Scholar]
- 8.Chiang JY. Bile acids: regulation of synthesis. J Lipid Res 50: 1955–1966, 2009. doi: 10.1194/jlr.R900010-JLR200. [DOI] [PMC free article] [PubMed] [Google Scholar]
- 9.Clugston RD, Jiang H, Lee MX, Piantedosi R, Yuen JJ, Ramakrishnan R, Lewis MJ, Gottesman ME, Huang LS, Goldberg IJ, Berk PD, Blaner WS. Altered hepatic lipid metabolism in C57BL/6 mice fed alcohol: a targeted lipidomic and gene expression study. J Lipid Res 52: 2021–2031, 2011. doi: 10.1194/jlr.M017368. [DOI] [PMC free article] [PubMed] [Google Scholar]
- 10.de Aguiar Vallim TQ, Tarling EJ, Edwards PA. Pleiotropic roles of bile acids in metabolism. Cell Metab 17: 657–669, 2013. doi: 10.1016/j.cmet.2013.03.013. [DOI] [PMC free article] [PubMed] [Google Scholar]
- 11.Folch J, Lees M, Sloane Stanley GH. A simple method for the isolation and purification of total lipides from animal tissues. J Biol Chem 226: 497–509, 1957. [PubMed] [Google Scholar]
- 12.Gulati S, Ekland EH, Ruggles KV, Chan RB, Jayabalasingham B, Zhou B, Mantel PY, Lee MC, Spottiswoode N, Coburn-Flynn O, Hjelmqvist D, Worgall TS, Marti M, Di Paolo G, Fidock DA. Profiling the essential nature of lipid metabolism in asexual blood and gametocyte stages of Plasmodium falciparum. Cell Host Microbe 18: 371–381, 2015. doi: 10.1016/j.chom.2015.08.003. [DOI] [PMC free article] [PubMed] [Google Scholar]
- 13.Haeusler RA, Astiarraga B, Camastra S, Accili D, Ferrannini E. Human insulin resistance is associated with increased plasma levels of 12α-hydroxylated bile acids. Diabetes 62: 4184–4191, 2013. doi: 10.2337/db13-0639. [DOI] [PMC free article] [PubMed] [Google Scholar]
- 14.Haeusler RA, Camastra S, Nannipieri M, Astiarraga B, Castro-Perez J, Xie D, Wang L, Chakravarthy M, Ferrannini E. Increased bile acid synthesis and impaired bile acid transport in human obesity. J Clin Endocrinol Metab 101: 1935–1944, 2016. doi: 10.1210/jc.2015-2583. [DOI] [PMC free article] [PubMed] [Google Scholar]
- 15.Haeusler RA, Pratt-Hyatt M, Welch CL, Klaassen CD, Accili D. Impaired generation of 12-hydroxylated bile acids links hepatic insulin signaling with dyslipidemia. Cell Metab 15: 65–74, 2012. doi: 10.1016/j.cmet.2011.11.010. [DOI] [PMC free article] [PubMed] [Google Scholar]
- 16.Halldorsdottir S, Carmody J, Boozer CN, Leduc CA, Leibel RL. Reproducibility and accuracy of body composition assessments in mice by dual energy X-ray absorptiometry and time domain nuclear magnetic resonance. Int J Body Compos Res 7: 147–154, 2009. [PMC free article] [PubMed] [Google Scholar]
- 17.Heck AM, Yanovski JA, Calis KA. Orlistat, a new lipase inhibitor for the management of obesity. Pharmacotherapy 20: 270–279, 2000. doi: 10.1592/phco.20.4.270.34882. [DOI] [PMC free article] [PubMed] [Google Scholar]
- 18.Iqbal J, Hussain MM. Intestinal lipid absorption. Am J Physiol Endocrinol Metab 296: E1183–E1194, 2009. doi: 10.1152/ajpendo.90899.2008. [DOI] [PMC free article] [PubMed] [Google Scholar]
- 19.Jones RD, Repa JJ, Russell DW, Dietschy JM, Turley SD. Delineation of biochemical, molecular, and physiological changes accompanying bile acid pool size restoration in Cyp7a1−/− mice fed low levels of cholic acid. Am J Physiol Gastrointest Liver Physiol 303: G263–G274, 2012. doi: 10.1152/ajpgi.00111.2012. [DOI] [PMC free article] [PubMed] [Google Scholar]
- 20.Kaur A, Patankar JV, de Haan W, Ruddle P, Wijesekara N, Groen AK, Verchere CB, Singaraja RR, Hayden MR. Loss of Cyp8b1 improves glucose homeostasis by increasing GLP-1. Diabetes 64: 1168–1179, 2015. doi: 10.2337/db14-0716. [DOI] [PubMed] [Google Scholar]
- 21.Kawamata Y, Fujii R, Hosoya M, Harada M, Yoshida H, Miwa M, Fukusumi S, Habata Y, Itoh T, Shintani Y, Hinuma S, Fujisawa Y, Fujino M. A G protein-coupled receptor responsive to bile acids. J Biol Chem 278: 9435–9440, 2003. doi: 10.1074/jbc.M209706200. [DOI] [PubMed] [Google Scholar]
- 22.Keane MH, Overmars H, Wikander TM, Ferdinandusse S, Duran M, Wanders RJ, Faust PL. Bile acid treatment alters hepatic disease and bile acid transport in peroxisome-deficient PEX2 Zellweger mice. Hepatology 45: 982–997, 2007. doi: 10.1002/hep.21532. [DOI] [PubMed] [Google Scholar]
- 23.Kelley DE, Bray GA, Pi-Sunyer FX, Klein S, Hill J, Miles J, Hollander P. Clinical efficacy of orlistat therapy in overweight and obese patients with insulin-treated type 2 diabetes: A 1-year randomized controlled trial. Diabetes Care 25: 1033–1041, 2002. doi: 10.2337/diacare.25.6.1033. [DOI] [PubMed] [Google Scholar]
- 24.Kuipers F, Bloks VW, Groen AK. Beyond intestinal soap--bile acids in metabolic control. Nat Rev Endocrinol 10: 488–498, 2014. doi: 10.1038/nrendo.2014.60. [DOI] [PubMed] [Google Scholar]
- 25.Lew JL, Zhao A, Yu J, Huang L, De Pedro N, Peláez F, Wright SD, Cui J. The farnesoid X receptor controls gene expression in a ligand- and promoter-selective fashion. J Biol Chem 279: 8856–8861, 2004. doi: 10.1074/jbc.M306422200. [DOI] [PubMed] [Google Scholar]
- 26.Li-Hawkins J, Gåfvels M, Olin M, Lund EG, Andersson U, Schuster G, Björkhem I, Russell DW, Eggertsen G. Cholic acid mediates negative feedback regulation of bile acid synthesis in mice. J Clin Invest 110: 1191–1200, 2002. doi: 10.1172/JCI0216309. [DOI] [PMC free article] [PubMed] [Google Scholar]
- 27.Makishima M, Okamoto AY, Repa JJ, Tu H, Learned RM, Luk A, Hull MV, Lustig KD, Mangelsdorf DJ, Shan B. Identification of a nuclear receptor for bile acids. Science 284: 1362–1365, 1999. doi: 10.1126/science.284.5418.1362. [DOI] [PubMed] [Google Scholar]
- 28.Maruyama T, Miyamoto Y, Nakamura T, Tamai Y, Okada H, Sugiyama E, Nakamura T, Itadani H, Tanaka K. Identification of membrane-type receptor for bile acids (M-BAR). Biochem Biophys Res Commun 298: 714–719, 2002. doi: 10.1016/S0006-291X(02)02550-0. [DOI] [PubMed] [Google Scholar]
- 29.Millar JS, Cromley DA, McCoy MG, Rader DJ, Billheimer JT. Determining hepatic triglyceride production in mice: comparison of poloxamer 407 with Triton WR-1339. J Lipid Res 46: 2023–2028, 2005. doi: 10.1194/jlr.D500019-JLR200. [DOI] [PubMed] [Google Scholar]
- 30.Murphy C, Parini P, Wang J, Björkhem I, Eggertsen G, Gåfvels M. Cholic acid as key regulator of cholesterol synthesis, intestinal absorption and hepatic storage in mice. Biochim Biophys Acta 1735: 167–175, 2005. doi: 10.1016/j.bbalip.2005.06.001. [DOI] [PubMed] [Google Scholar]
- 31.Parks DJ, Blanchard SG, Bledsoe RK, Chandra G, Consler TG, Kliewer SA, Stimmel JB, Willson TM, Zavacki AM, Moore DD, Lehmann JM. Bile acids: natural ligands for an orphan nuclear receptor. Science 284: 1365–1368, 1999. doi: 10.1126/science.284.5418.1365. [DOI] [PubMed] [Google Scholar]
- 32.Slätis K, Gåfvels M, Kannisto K, Ovchinnikova O, Paulsson-Berne G, Parini P, Jiang ZY, Eggertsen G. Abolished synthesis of cholic acid reduces atherosclerotic development in apolipoprotein E knockout mice. J Lipid Res 51: 3289–3298, 2010. doi: 10.1194/jlr.M009308. [DOI] [PMC free article] [PubMed] [Google Scholar]
- 33.Song P, Rockwell CE, Cui JY, Klaassen CD. Individual bile acids have differential effects on bile acid signaling in mice. Toxicol Appl Pharmacol 283: 57–64, 2015. doi: 10.1016/j.taap.2014.12.005. [DOI] [PMC free article] [PubMed] [Google Scholar]
- 34.Thomas C, Pellicciari R, Pruzanski M, Auwerx J, Schoonjans K. Targeting bile-acid signalling for metabolic diseases. Nat Rev Drug Discov 7: 678–693, 2008. doi: 10.1038/nrd2619. [DOI] [PubMed] [Google Scholar]
- 35.Tsuchida T, Fukuda S, Aoyama H, Taniuchi N, Ishihara T, Ohashi N, Sato H, Wakimoto K, Shiotani M, Oku A. MGAT2 deficiency ameliorates high-fat diet-induced obesity and insulin resistance by inhibiting intestinal fat absorption in mice. Lipids Health Dis 11: 75, 2012. doi: 10.1186/1476-511X-11-75. [DOI] [PMC free article] [PubMed] [Google Scholar]
- 36.Uchida K, Makino S, Akiyoshi T. Altered bile acid metabolism in nonobese, spontaneously diabetic (NOD) mice. Diabetes 34: 79–83, 1985. doi: 10.2337/diab.34.1.79. [DOI] [PubMed] [Google Scholar]
- 37.Uchida K, Satoh T, Takase H, Nomura Y, Takasu N, Kurihara H, Takeuchi N. Altered bile acid metabolism related to atherosclerosis in alloxan diabetic rats. J Atheroscler Thromb 3: 52–58, 1996. doi: 10.5551/jat1994.3.52. [DOI] [PubMed] [Google Scholar]
- 38.Villanueva CJ, Monetti M, Shih M, Zhou P, Watkins SM, Bhanot S, Farese RV Jr. Specific role for acyl CoA:diacylglycerol acyltransferase 1 (Dgat1) in hepatic steatosis due to exogenous fatty acids. Hepatology 50: 434–442, 2009. doi: 10.1002/hep.22980. [DOI] [PMC free article] [PubMed] [Google Scholar]
- 39.Wang DQ, Lammert F, Cohen DE, Paigen B, Carey MC. Cholic acid aids absorption, biliary secretion, and phase transitions of cholesterol in murine cholelithogenesis. Am J Physiol Gastrointest Liver Physiol 276: G751–G760, 1999. [DOI] [PubMed] [Google Scholar]
- 40.Wang DQ, Tazuma S, Cohen DE, Carey MC. Feeding natural hydrophilic bile acids inhibits intestinal cholesterol absorption: studies in the gallstone-susceptible mouse. Am J Physiol Gastrointest Liver Physiol 285: G494–G502, 2003. doi: 10.1152/ajpgi.00156.2003. [DOI] [PubMed] [Google Scholar]
- 41.Wang H, Chen J, Hollister K, Sowers LC, Forman BM. Endogenous bile acids are ligands for the nuclear receptor FXR/BAR. Mol Cell 3: 543–553, 1999. doi: 10.1016/S1097-2765(00)80348-2. [DOI] [PubMed] [Google Scholar]
- 42.Wang J, Gåfvels M, Rudling M, Murphy C, Björkhem I, Einarsson C, Eggertsen G. Critical role of cholic acid for development of hypercholesterolemia and gallstones in diabetic mice. Biochem Biophys Res Commun 342: 1382–1388, 2006. doi: 10.1016/j.bbrc.2006.02.108. [DOI] [PubMed] [Google Scholar]
- 43.Watt SM, Simmonds WJ. Effects of four taurine-conjugated bile acids on mucosal uptake and lymphatic absorption of cholesterol in the rat. J Lipid Res 25: 448–455, 1984. [PubMed] [Google Scholar]
- 44.Watt SM, Simmonds WJ. The specificity of bile salts in the intestinal absorption of micellar cholesterol in the rat. Clin Exp Pharmacol Physiol 3: 305–322, 1976. doi: 10.1111/j.1440-1681.1976.tb00607.x. [DOI] [PubMed] [Google Scholar]
- 45.Yen CL, Cheong ML, Grueter C, Zhou P, Moriwaki J, Wong JS, Hubbard B, Marmor S, Farese RV Jr. Deficiency of the intestinal enzyme acyl CoA:monoacylglycerol acyltransferase-2 protects mice from metabolic disorders induced by high-fat feeding. Nat Med 15: 442–446, 2009. doi: 10.1038/nm.1937. [DOI] [PMC free article] [PubMed] [Google Scholar]


