

Abstract
The goals of this study were to 1) develop a computational model of solute transport and oxygenation in the kidney of the female spontaneously hypertensive rat (SHR), and 2) apply that model to investigate sex differences in nitric oxide (NO) levels in SHR and their effects on medullary oxygenation and oxidative stress. To accomplish these goals, we first measured NO synthase (NOS) 1 and NOS3 protein expression levels in total renal microvessels of male and female SHR. We found that the expression of both NOS1 and NOS3 is higher in the renal vasculature of females compared with males. To predict the implications of that finding on medullary oxygenation and oxidative stress levels, we developed a detailed computational model of the female SHR kidney. The model was based on a published male kidney model and represents solute transport and the biochemical reactions among O2, NO, and superoxide () in the renal medulla. Model simulations conducted using both male and female SHR kidney models predicted significant radial gradients in interstitial fluid oxygen tension (Po2) and NO and concentration in the outer medulla and upper inner medulla. The models also predicted that increases in endothelial NO-generating capacity, even when limited to specific vascular segments, may substantially raise medullary NO and Po2 levels. Other potential sex differences in SHR, including production rate, are predicted to significantly impact oxidative stress levels, but effects on NO concentration and Po2 are limited.
Keywords: sex differences, hypertension, nitric oxide, reactive oxygen species, oxidative stress, gender
hypertension is a complex and multifaceted disease that affects 33% of US adults and is the leading cause of premature death in the world. It is generally believed that men typically have higher blood pressure than age-matched women, putting them at greater risk for hypertension-related cardiovascular and renal disease. However, recent studies have indicated no significant difference in the incidence and progression of chronic kidney diseases (CKD) between sexes (with some exceptions noted below), although more men have advanced-stage CKD than women (34). Furthermore, studies have indicated that women have a lower risk of progression than men (39), that CKD progresses more rapidly in women of postmenopausal age than in men (20), and that men with CKD of various etiologies show a more rapid decline in renal function than women with CKD over time (33). Despite these well known sex differences, men and women are typically treated using the same approach. Strikingly, only 45% of treated women achieve blood pressure control compared with 51% of men (18). In this study, we consider sex differences in blood pressure control, with a focus on renal bioavailability of nitric oxide (NO), a powerful vasodilator.
The kidney plays a central role in long-term control of blood pressure. By a mechanism called pressure natriuresis, elevated blood pressure increases sodium (Na+) excretion. This is followed by decreased water excretion, decreased extracellular fluid volume, and decreased blood pressure. Thus the kidney’s function, in particular its ability to regulate Na+ excretion, is critical in blood pressure control. It is noteworthy that, although Na+ retention may lead to hypertension, this is not the only mechanism that regulates blood pressure, especially in the long term; others include changes in vascular tone, which impacts hemodynamics.
NO contributes to blood pressure control by regulating vascular tone and hemodynamics; NO also promotes natriuresis and diuresis by inhibiting tubular Na+ reabsorption. Indeed, NO has a central role in hypertension-related end-organ damage. Female spontaneously hypertensive rats (SHR) are known to have greater levels of NO than males (42). We hypothesize that the discrepancy may be attributable to the sex differences in the NO-generating capacity of renal microvessels.
In this study, we used a combination of experimental and computational modeling techniques to assess the validity of the above hypothesis. Additionally, we sought to assess the potential of other physiological factors, including superoxide () production rate and antioxidant capacity, in explaining the higher NO bioavailability in the female SHR kidneys. To accomplish these goals and provide data to inform the computational model, we first measured NO synthase (NOS) protein expression in the vascular tree isolated from the whole kidneys in male and female SHR. We also developed and applied computational models of the renal medulla of the male and female SHR kidneys. We conducted model simulations to assess the extent to which sex differences in SHR may contribute to the lower levels of oxidative stress and the higher level of NO bioavailability reported in female SHR (42).
METHODS
Experimental Methods
Animals.
Thirteen-week-old male and female SHR were used in this study (Harlan Laboratories, Indianapolis, IN). Male and female SHR weighed 310 ± 5 and 176 ± 8 g, respectively. All experiments were conducted in accordance with the National Institutes of Health’s Guide for the Care and Use of Laboratory Animals and were approved and monitored by the Augusta University Institutional Animal Care and Use Committee. Rats were anesthetized with ketamine-xylazine (48 mg/kg and 6.4 mg/kg ip, respectively; Phoenix Pharmaceuticals, St. Joseph, MO) and were killed by a thoracotomy. Kidneys were removed, decapsulated, and placed in ice-cold phosphate-buffered saline (PBS; pH 7.4) containing phenylmethylsulfonyl fluoride (PMSF; 1 mM). The kidneys were minced and filtered through a mesh filter (200 m) in ice-cold PBS; the vascular bed was retained on the mesh. The isolated microvessels (which contains glomeruli, arteries, arterioles, veins, and venules) were placed in a tube containing 1 ml of homogenization buffer (50 mM Tris·HCl, pH 7.4, 0.1 mM EDTA, 0.1 mM EGTA, 250 mM sucrose, and 10% glycerol) in the presence of protease inhibitors (1 mM PMSF, 1 M pepstatin A, 2 M leupeptin, and 0.1% aprotinin) and then snap-frozen in liquid nitrogen. Note that this vascular preparation is not a microdissected arterial preparation from one region of the kidney, but instead includes glomeruli, arteries, arterioles, veins, and venules from the entire kidney. The preparation also includes some nonvascular components, although it is a highly enriched vascular preparation.
Western blot analysis.
Slightly thawed microvessel preparations were homogenized on ice in the presence of fresh protease inhibitors with a glass-glass homogenizer for 10 strokes. Protein concentrations were determined by the Bradford assay (Bio-Rad; Hercules, CA) using bovine serum albumin as the standard. Proteins were separated on 7.5% SDS-PAGE and transferred onto polyvinylidene difluoride membranes with a trans-blot (Bio-Rad) for 45 min. The blots were allowed to air dry for 30 min and were blocked with 5% nonfat dry milk diluted in Tris-buffered saline for 1 h at room temperature. Two-color immunoblots were performed using polyclonal primary antibodies NOS1 and NOS3 (BD Biosciences, San Jose, CA). Specific bands were detected using the Odyssey infrared imager in conjunction with the appropriate IRDye secondary antibodies (LI-COR Biosciences, Lincoln, NE). β-Actin (monoclonal; Sigma) was used to verify equal protein loading, and all densitometric results are reported normalized to β-actin.
Computational Models
Our laboratory previously published a model of solute transport and oxygenation in the renal medulla of the kidney of a male rat in moderate antidiuretic state (15–17). Based on that model, we developed a computational model of the renal medulla of the female SHR kidney. The models represent the three-dimensional architecture of the renal medulla and include the loops of Henle, collecting ducts, vasa recta, and capillaries (see Fig. 1); the model vasa recta and capillaries are divided into plasma and red blood cell compartments. The models simulate the renal tubular and vascular transport of NaCl, urea, O2, NO, and . Solute and water transport are represented using the single-barrier approach. The model predicts tubular and vascular flows, solute concentrations, and water and solute fluxes at all levels of the renal medulla. Below we highlight aspects of the models that are particularly relevant to medullary oxygenation and oxidative stress, and we describe the parameters that were adjusted in the male SHR kidney model to yield a female model. For other model equations, see Refs. 8 and 15.
Fig. 1.
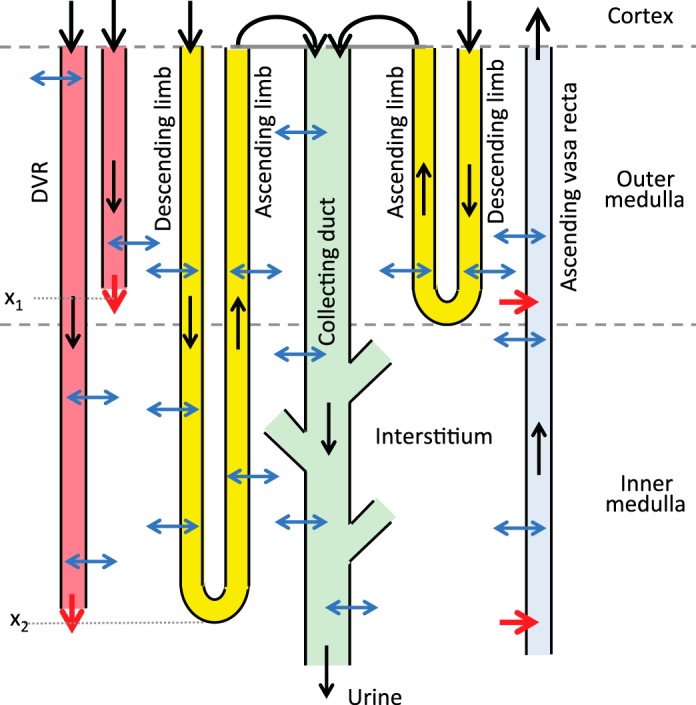
Schematic diagram of model structure. A short loop, which consists of a descending limb and a contiguous ascending limb and which turns at the outer-inner medullary boundary, is represented. The diagram also depicts a long loop that turns within the inner medulla (at x2). Although only one long loop is shown, the model represents one long loop that turns at every spatial point in the inner medulla. Similarly, only two representative descending vasa recta (DVR) are shown (with one terminating at x1 and one at x2), whereas the model represents one DVR that terminates at every spatial point. A representative collecting duct is shown; the “branches” represent the coalescence of the collecting ducts in the inner medulla. The black arrows at the corticomedullary boundary represent boundary flows. The outflow of the ascending limbs determines the inflow of the collecting duct. Collecting duct outflow becomes urine.
Active Na+ transport and O2 consumption.
Active transport of Na+ occurs along the thick ascending limbs, proximal straight tubules, and collecting ducts. We assume that, for tubule i, active Na+ transport rate () depends on local oxygen tension (Po2), [NO], [], and luminal [Na+] (where brackets denote concentration), given by
| (1) |
where Vmax,i,Na (in nmol·cm–2·s–1) is the maximal rate of Na+ transport, KM,Na is the Michaelis constant (taken here to be 70 mM), and the functions fact ([O2]), gact ([NO]), and hact ([]) represent the effects of O2, NO, and , respectively, on the rate of active Na+ reabsorption.
As in our laboratory’s previous studies (15–17), we assume that, below a critical Po2 threshold Pc [taken to be 10 mmHg (16)], active Na+ transport becomes limited and is partially compensated by anaerobic metabolism. This process is modeled by
| (2) |
where FAN describes the capacity of the tubular segment for anaerobic transport and is taken to be 0.5 in the outer medullary collecting duct (44, 50), 0.4 in the inner medullary collecting duct (41), 0.1 in the thick ascending limbs (3), and 0.14 in the proximal straight tubules (12).
NO and have opposite effects on Na+ transport, with NO having an inhibitory effect and enhancing Na+ transport. These effects are represented by
| (3) |
| (4) |
where the Michaelis constants βi and γi are set to 47 nM and 0.2 pM in the thick ascending limbs and to 232 nM and 0.06 pM in the collecting ducts, respectively (15).
O2 consumption consists of an active component that depends on active Na+ transport, and a basal component that depends on local Po2:
| (5) |
| (6) |
where ri is the inner radius of tubule i, TQi denotes the number of moles of Na+ actively reabsorbed per mole of O2 consumed, is the Michaelis constant associated with basal metabolism, and is the maximal volumetric rate of O2 consumption. Θ([O2]) denotes the fraction of the Na+ active transport supported by aerobic respiration. We assume that, below a certain threshold, aerobic respiration decreases progressively, so that Θ([O2]) is given by
| (7) |
Generation of NO and .
The generation rates of NO and are assumed to depend on local Po2, such that for tubule or vessel i
| (8) |
| (9) |
where and are the maximal rates of NO and production, which vary among different types of tubule and vessel (15), and KM,No and are the associated Michaelis constants, set to 50.9 and 20.6 μM, respectively (9, 48). In SHR, is divided by a factor of 2 and is increased by a factor of 10, relative to values in normotensive rats.
NO-induced vasodilation.
Following our laboratory’s previous phenomenological approach (17), we assume that the descending vasa recta (DVR) radius (denoted RDVR) increases with local increases in [NO]. We further assume that RDVR cannot fall below the radius of a single erythrocyte, or 3.5 μm. Because [NO] varies throughout the medulla, RDVR varies spatially. Thus, at a given medullary level, the model RDVR is given (in μm) by
| (10) |
where [NO]avg denotes the average of the DVR plasma and local interstitial [NO], and [NO]* denotes the reference [NO], taken to be 15 nM for both male and female. R* denotes the reference radius, taken to be 7.5 and 6.15 μm, for male and female, respectively. A is a dimensionless parameter, chosen to be 1.0962 so that the baseline DVR volume flow at the corticomedullary boundary is ~8 and 6 nl/min, for male and female, respectively.
The model represents medullary blood flow as Poiseuille flow, which relates blood flow (QDVR) along each DVR to pressure drop (ΔPDVR) and vascular resistance; the latter scales inversely with the fourth power of the RDVR. That is,
| (11) |
where μ is the blood viscosity, and LDVR denotes the DVR length. Since the DVR terminate at every medullary depth, the LDVR can take values from 0 to 0.7 cm, the total length of the medulla. Because of the differing lengths and radii of the DVR, blood flow distribution may be inhomogeneous among the DVR. To determine the blood flow entering the DVR, we connect each DVR to a downstream resistance in series, and assume that pressures at the two ends, denoted by PE and PV (E, efferent arteriole; V, renal vein), are known in advance. The pressure drop (PE − PV) from efferent arteriole to renal vein is given by the pressure drop along that DVR and along its downstream resistance Γdown:
| (12) |
here is volume flow at the end of the DVR, and Γdown is a function of LDVR. ΔPDVR is calculated along LDVR:
| (13) |
We refer readers to Ref. 17 for more details.
Sex differences in model parameters.
To produce a female SHR model, we adjusted model parameters to account for the substantial differences in size and blood flow between the male and female rat kidneys. The renal mass of a female rat is approximately one-half that of an age-matched male rat (29, 37), while the number of glomeruli per kidney is similar in both sexes (32). We assume that both male and female model SHR kidneys have 30,000 nephrons, a 17% reduction from the 36,000 nephrons that we typically assume for a normotensive rat. The lower nephron count is consistent with findings reported by Skov et al. (40). We reduce the lengths and radii of all tubules and vessels to 82% (cube root of 55%) in the female model. Additionally, we assume that single-nephron glomerular filtration rate (SNGFR) in the female kidney is 20% lower than in the male. That assumption is consistent with reports that SNGFR in female rat kidneys is a fraction of that in the male (32, 36) and yields urinary outputs that are not substantially different in both sexes (37). Medullary blood flow has not been measured in female rats; we assume that SNGFR and medullary blood flow scale proportionally, so that medullary blood flow in female is 20% lower than in male. Flows and solute concentrations for descending tubules and vessels at the corticomedullary boundary are specified in Table 1. Also, DVR hematocrit is taken to be 0.45 at the corticomedullary boundary. All other parameters are the same in both sexes, unless otherwise specified (see Refs. 8, 15, 21). Permeabilities of tubular and vascular walls to O2, NO, and are given in Table 2. NO and generation rates are given in Table 3. Both model kidneys are assumed to be in a moderately anti-diuretic state.
Table 1.
Boundary conditions for descending tubules and vessels at x = 0
| DVR |
||||
|---|---|---|---|---|
| SDL | LDL | Plasma | RBC | |
| FV male, nl/min | 10 (2) | 12 (11) | 6 (6) | 2 (6) |
| FV female, nl/min | 8 | 9.6 | 4.8 | 1.6 |
| CNa, mM | 160 (2, 23) | 160 (2, 23) | 163.7 (2, 23) | 163.7 (2, 23) |
| Po2, mmHg | 36 (27) | 36 (27) | 45 (51) | 45 (51) |
| CNO, mM | 0.1 × 10⁻³ (13) | 0.1 × 10⁻³ (13) | 0.5 × 10⁻⁴ (54) | 0.1 × 10⁻⁶ (13) |
| , mM | 0.2 × 10⁻⁷ (13) | 0.2 × 10⁻⁷ (13) | 0.1 × 10⁻⁶ (13) | 0.1 × 10⁻⁶ (13) |
Citation numbers shown in parentheses. SDL, short descending limb; LDL, long descending limb; RBC, red blood cell; FV, vessel flow; CNa, Na+ concentration; CNO, NO concentration; , concentration.
Table 2.
O2, NO, and permeabilities of tubular and vascular walls
| DVR |
AVR |
||||||
|---|---|---|---|---|---|---|---|
| DL | AL | CD | Plasma | RBC | Plasma | RBC | |
| , cm/s | 0.04 (8) | 0.04 (8) | 0.04 (8) | 0.04 (8) | 0.0133 (8, 51) | 0.04 (8) | 0.0133 (8, 51) |
| Perm,NO, cm/s | 0.1 (13, 19) | 0.0122 (13, 19) | 0.0122 (13, 19) | 0.496 (13, 19) | 0.05 (13, 19) | 0.0122 (13, 19) | 0.1 (13, 19) |
| , cm/s | 5 × 10⁻⁴ (13) | 5 × 10⁻⁴ (13) | 5 × 10⁻⁴ (13) | 5 × 10⁻⁴ (13) | 5 × 10⁻⁴ (13) | 5 × 10⁻⁴ (13) | 5 × 10⁻⁴ (13) |
Nos. in parentheses are reference nos. DL, descending limb; AL, ascending limb; CD, collecting duct, , O2 permeability; Perm,NO, NO permeability; , permeability.
Table 3.
NO and generation rates in tubules and vessels in male and female normotensive rats and SHR
| DVR |
AVR |
||||||
|---|---|---|---|---|---|---|---|
| DL | AL | CD | Plasma | RBC | Plasma | RBC | |
| Normal, GNO, mM/s | 6.16 × 10⁻³ (13, 49) | 4.92 × 10⁻⁴ (13, 49) | 2.08 × 10⁻⁴ (13, 49) | 38.24 × 10⁻³ (13, 49) | 0 | 36.50 × 10⁻³ (13, 49) | 0 |
| Normal, , mM/s | 15.2 × 10⁻⁵ (13, 26) | 3.2 × 10⁻⁵ (13, 26) | 1.8 × 10⁻⁵ (13, 26) | 21.0 × 10⁻⁵ (13, 26) | 0 | 19.8 × 10⁻⁵ (13, 26) | 0 |
| SHR, GNO, mM/s | 3.08 × 10⁻³ | 2.46 × 10⁻⁴ | 1.04 × 10⁻⁴ | 19.12 × 10⁻³ | 0 | 18.25 × 10⁻³ | 0 |
| SHR, , mM/s | 15.2 × 10⁻⁴ | 3.2 × 10⁻⁴ | 1.8 × 10⁻⁴ | 21.0 × 10⁻⁴ | 0 | 19.8 × 10⁻⁴ | 0 |
Nos. in parentheses are reference nos. DL, descending limb; AL, ascending limb; CD, collecting duct.
MODEL RESULTS
Experimental Results
To inform the computational model, experiments were performed to measure NOS1 and NOS3 total protein expression in isolated renal microvessels from male and female SHR. We found that both NOS1 and NOS3 are more highly expressed in the renal vasculature of females compared with males (see Fig. 2). This result is consistent with our laboratory’s previous reports (7, 42) indicating greater blood pressure sensitivity of female SHR to NOS inhibition and greater indexes of NO production in the renal cortex and inner medulla of female SHR compared with male SHR.
Fig. 2.

Left: NOS1 protein expression (~150 kDa) in whole homogenates of isolated renal microvessels from male and female SHR. This includes the entire vascular tree isolated from the kidney. There are two immunoreactive bands: the top band is NOS1α, and the lower is NOS1β. Right: NOS3 protein expression (~130 kDa) in whole homogenates of isolated renal microvessels from male and female SHR. This includes the entire vascular tree isolated from the kidney. RDU, relative densitometric units.
Base-Case Simulation Results
Model equations were solved to obtain steady-state solutions for the male and female parameter sets. Predicted urine Na+ excretions for male and female normotensive rats, and male and female SHR, are shown in Table 4 and Fig. 3. Urinary Na+ excretions in male and female SHR are lower than the corresponding normotensive rats, consistent with data in Refs. 1 and 43. Predicted urinary outputs are shown in Table 5. The male and female SHR produced urine with similar flow rate and composition (40). Based on the DVR boundary conditions and on Eq. 11, medullary oxygen supply was computed to be 0.85 and 0.69 μmol·min−1·kidney−1, for male and female, respectively. Medullary oxygen consumption was computed to be 0.69 and 0.59 μmol·min−1·kidney−1, respectively.
Table 4.
Predicted Na+ excretion in male and female rats
| Rat Type | Na+ Excretion, nmol·min−1·CD−1 |
|---|---|
| Male normotensive | 0.1780 |
| Male SHR | 0.1364 |
| Female normotensive | 0.1010 |
| Female SHR | 0.0771 |
| Female SHR, | 0.0943 |
| Female SHR, | 0.0936 |
| Female SHR, | 0.0763 |
| Female SHR, | 0.0786 |
| Female SHR, | 0.1098 |
| Female SHR, | 0.1078 |
| Female SHR, | 0.0760 |
| Female SHR, | 0.0809 |
CD, collecting duct; EB-AVR, extrabundle AVR.
Fig. 3.
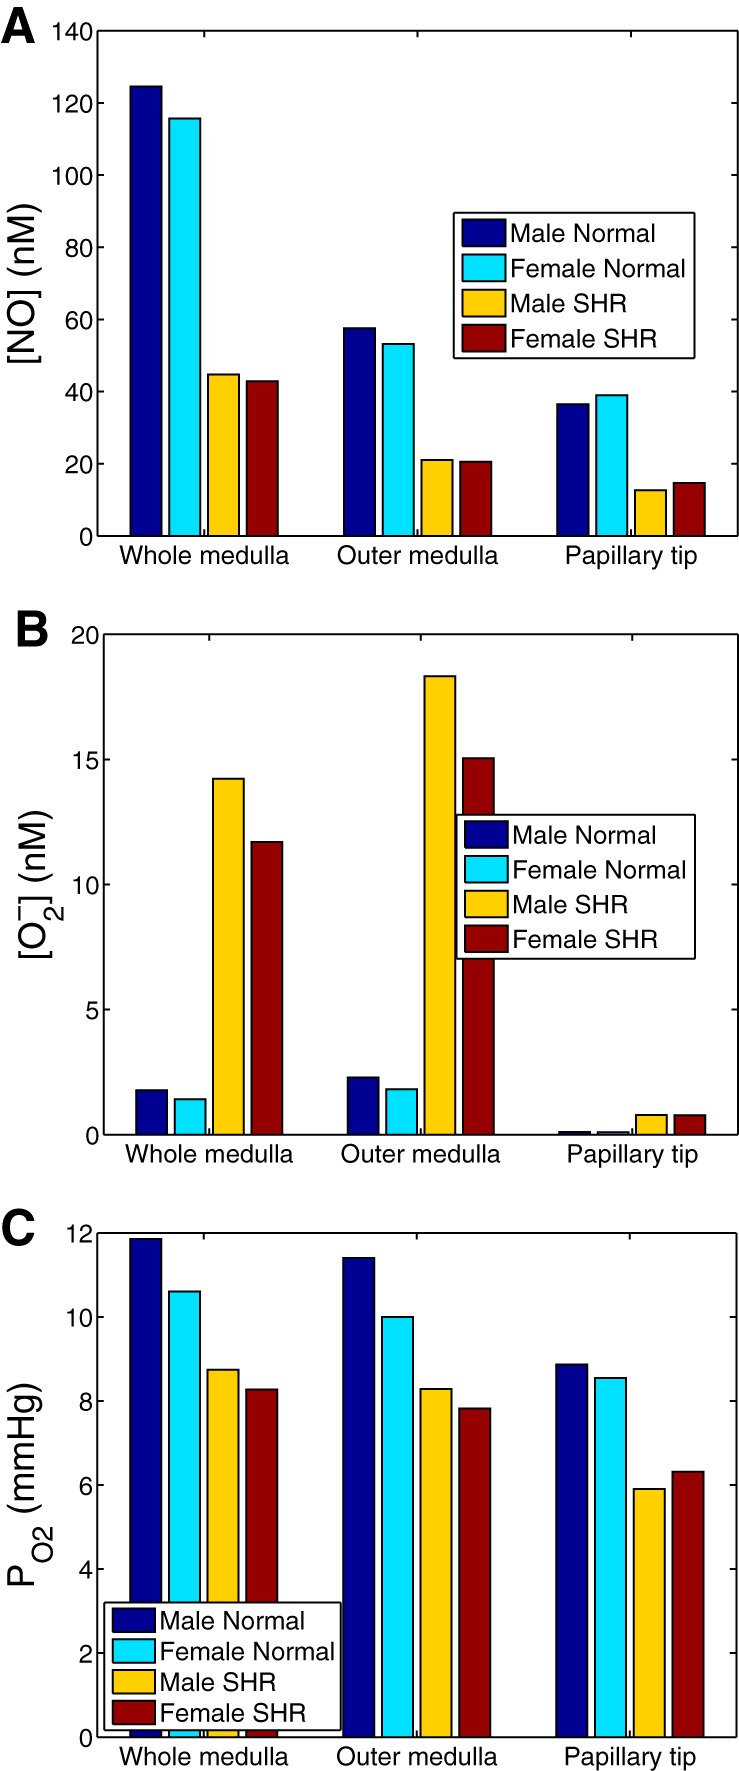
Four baseline cases: male and female normotensive rats, and male and female SHR. Interstitial [NO] (A), [] (B), and Po2 (C) are shown.
Table 5.
Predicted urine outputs in male and female SHR
| Male | Female | |
|---|---|---|
| Flow, μl/min | 23.8 | 15.9 |
| [NaCl], mM | 172.1 | 145.2 |
| [Urea], mM | 670.6 | 588.5 |
| Osmolality, mosmol/kgH2O | 1,084 | 950 |
Assuming that the NO generation rate is identical in male and female kidneys, both male and female SHR models predict similar medullary NO, Po2, and levels. Figure 4 shows medullary NO, Po2, and levels for all four cases: male and female normotensive rats, and male and female SHR.
Fig. 4.
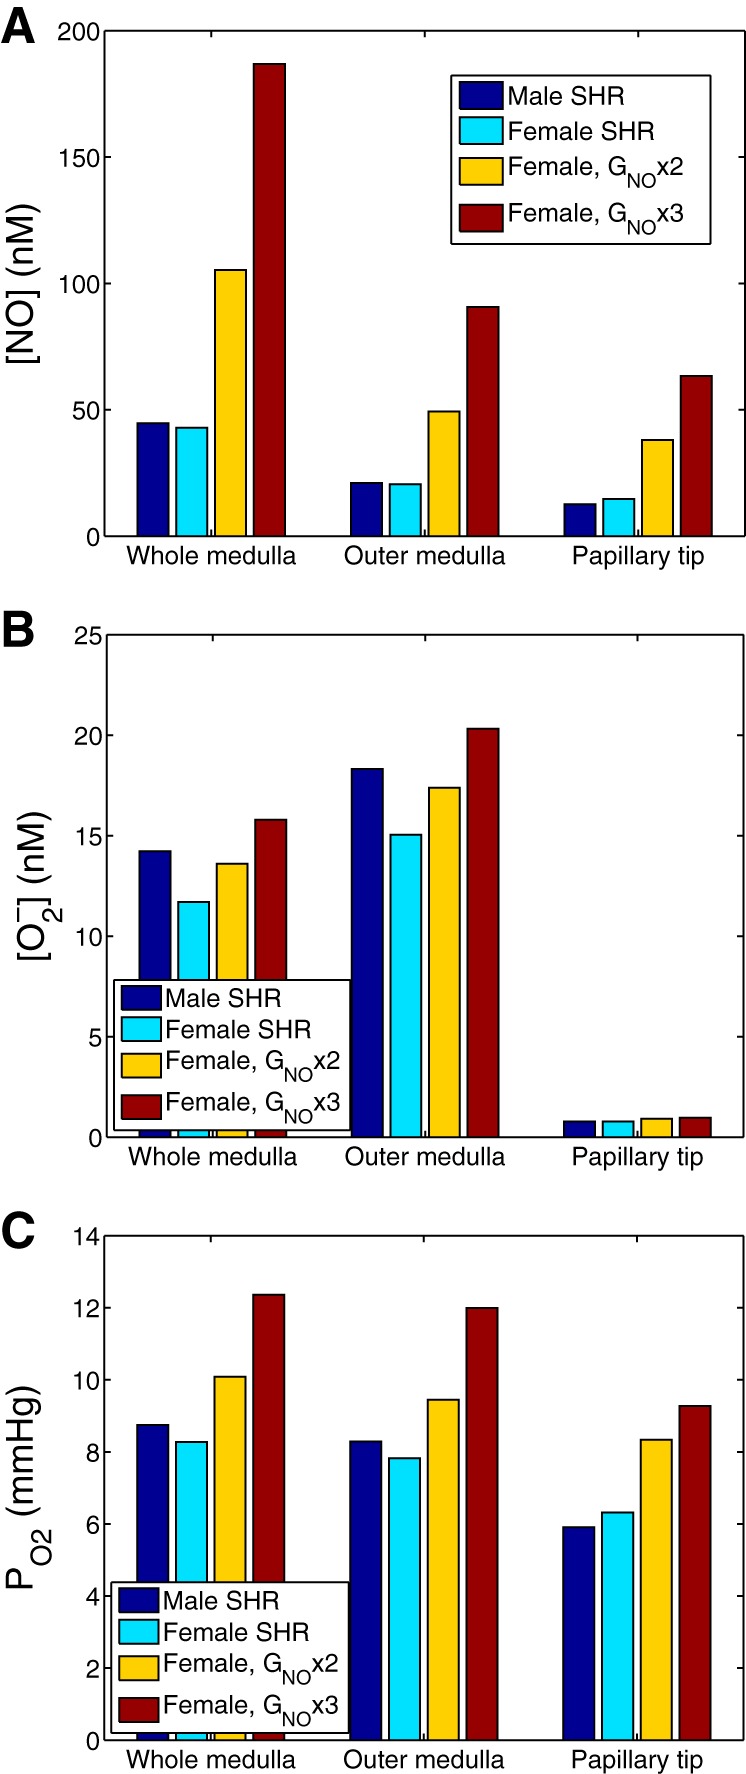
Effect of varying NO generation rate (denoted GNO) on interstitial [NO] (A), [] (B), and Po2 (C). Results were obtained for male SHR using baseline GNO, and for female SHR using GNO at baseline and at values two and three times that of baseline. The increased GNO was applied to all cells.
Predicted Effects of Increasing NO Generation Rate in Female SHR
Motivated by our finding that NOS1 and NOS3 expression is higher in the renal vasculature of female SHR compared with males, we conducted simulations to assess the effects of higher NO generation rate in females. Specifically, we increased NO generation rate, more specifically, the maximum NO generation rate ( in Eq. 8, which we denote simply by GNO below), in female SHR two- and threefold. That increase was applied to all cells. Predicted interstitial fluid [NO], [], and Po2, computed as averages for the whole medulla, outer medulla, and the papillary tip (taken to be the terminal 1.5 mm of the inner medulla), are shown in Fig. 4. Elevating the NO production rate by factors of 2 and 3 increases whole medulla [NO] by 146 and 336%, respectively, with similar proportional increases predicted in the outer medulla and the papilla (see Fig. 4A).
The higher interstitial fluid [NO] induces vasodilation. The predicted medullary blood flow and O2 supply increased 33 and 32%, and 45 and 44% when the GNO was increased two- and threefold, respectively. In turn, whole medulla interstitial Po2 increased by 22 and 49%, respectively.
NO and react to form ONOO−; thus higher NO levels, taken in isolation, would lower []. However, the higher Po2 that results from the high NO level increases production (see Eq. 9). These two competing factors together yielded small increases in interstitial fluid [] as GNO increased (see Fig. 4B).
The predicted impact of higher NO levels on water and Na+ excretion in female SHR is illustrated in Table 6. The GNO-induced increase in blood flow reduces the efficiency of the concentrating mechanism, resulting in a lower urine osmolality. Since NO acts to inhibit tubular Na+ reabsorption in the thick ascending limb, collecting duct, and proximal straight tubule (see Eq. 3), raising GNO enhances Na+ and water excretion (Table 4; Fig. 5). Somewhat paradoxically, this also results in higher medullary O2 consumption, and a greater O2 consumption-to-supply ratio (Table 6). The reason is that the higher the levels of NO, the higher Po2, and the larger the contribution of aerobic metabolism (see Eq. 7); in other words, the fraction of active Na+ transport that is sustained by O2 consumption (as opposed to anaerobic metabolism) increases with increasing GNO.
Table 6.
Impact of increasing GNO on medullary O2 supply and consumption and on urinary excretion in female SHR
|
GNO,all |
GNO,DVR |
GNO,EB-AVR |
|||||
|---|---|---|---|---|---|---|---|
| Basal GNO | × 2 | × 3 | × 2 | × 3 | × 2 | × 3 | |
| DVR inflow, μl·min−1·kidney−1 | 113.7 | 151.5 | 165.0 | 135.1 | 145.6 | 126.9 | 135.6 |
| O2 supply, μmol·min−1·kidney−1 | 0.69 | 0.90 | 0.99 | 0.81 | 0.87 | 0.77 | 0.82 |
| O2 consumption, μmol·min−1·kidney−1 | 0.59 | 0.79 | 0.83 | 0.71 | 0.77 | 0.66 | 0.69 |
| Urine osmolality, mosmol/kgH2O | 950 | 907 | 900 | 916 | 902 | 937 | 931 |
| Urine flow, μl·min−1·kidney−1 | 2.61 | 2.95 | 3.13 | 2.71 | 2.75 | 2.85 | 3.03 |
| Urine Na+ flow, μmol·min−1·kidney−1 | 0.38 | 0.46 | 0.54 | 0.38 | 0.37 | 0.46 | 0.53 |
GNO, maximal volumetric rate of NO consumption. In the cases examined here, it is multiplied by a factor of 2 or 3 either in all cells (GNO,all), in DVR only (GNO,DVR), or in extrabundle AVR only (GNO,EB-AVR).
Fig. 5.
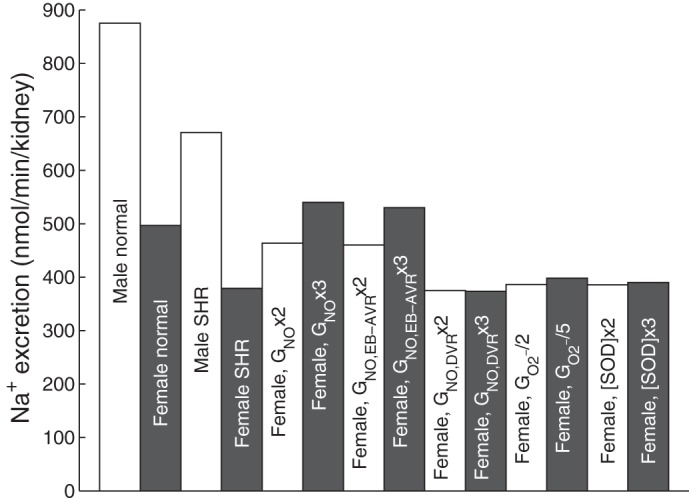
Na+ excretion in male and female normotensive and hypertensive rats.
Predicted Effects of Selective Increases in GNO
In the above simulations, GNO was increased uniformly in all cells. However, regional differences in NOS1 and NOS3 expression, and hence GNO, are likely. Thus, in the next few sets of simulations, we considered selective increases in GNO. Based on our findings that NOS1 and NOS3 expressions are higher in renal microvessels in female SHR compared with male (Fig. 2), we selectively increased GNO in vasa recta of female SHR.
First, we conducted simulations in which GNO was increased two- and threefold in the extrabundle ascending vasa recta (AVR) (their entire medullary length) of the female SHR kidney. GNO was kept at baseline values in other vessels, tubules, and interstitial cells. We chose the extrabundle AVR due to their proximity to the thick ascending limbs. Simulations predicted that selectively raising extrabundle AVR GNO elevated medullary [NO] and Po2 to levels comparable to raising GNO in all cells (compare Figs. 4 and 6, A1 and B1), even though extrabundle AVR account for ~30% of all vasa recta.
Fig. 6.

Effect of selective variations in NO generation rate on interstitial [NO] and Po2. Results were obtained for male SHR using baseline GNO, and for female SHR with baseline GNO and with GNO increased to two and three times above baseline in selected segments. A1 and B1: NO generation rate of extrabundle ascending vasa recta (AVR), denoted GNO,EB-AVR, was varied. A2 and B2: NO generation rate of descending vasa recta (DVR), denoted GNO,DVR, was varied.
Next, we simulated a two- and threefold increase in GNO in the DVR of the female SHR kidney. GNO was kept constant in other cells. Our results indicate that selectively raising DVR GNO raises medullary [NO] and Po2 to a smaller extent than raising extrabundle AVR GNO (see Fig. 6). Indeed, the scavenging of NO by hemoglobin is greater in DVR than in AVR, as fluid uptake significantly reduces hematocrit levels in AVR, compared with DVR.
The impact of vessel-selective changes in GNO on urinary excretion in female SHR is also shown in Table 6. The trends are similar to those described above, but the quantitative changes are smaller. A twofold increase in GNO raises medullary blood flow (and O2 supply) by 33, 19, or 12% (and by 32, 18, or 11%), respectively, if it occurs in all vessels, in DVR only, or in extrabundle AVR only. The corresponding decreases in urine osmolality are small: 4, 5, and 1%, respectively. Note that raising GNO only in DVR has a negligible impact on Na+ transport and Na+ excretion.
Predicted Effects of Decreasing Generation Rate in Female SHR
Thus far our predictions suggest that higher endothelial NO-producing capacity, even when restricted to specific vascular segments, can yield substantially higher medullary NO and Po2 levels. To further explore the effects of other physiological factors, we conducted additional simulations. NO bioavailability is determined by 1) the expression and activity of NOS, and 2) scavenging of NO by . We first sought to assess the effects of decreasing maximum generation rate (which we refer to as ) in female SHR two- and fivefold. Predicted interstitial fluid [NO], [], and Po2, computed for the whole medulla, outer medulla, and papillary tip, are shown in Fig. 7. Reducing production rate by factors of 2 and 5 markedly decreased whole medulla [] by 50 and 80%, respectively, with similar proportional decreases in the outer medulla and the papilla (see Fig. 7B). Interstitial [NO] increased as generation rate was progressively decreased, but that effect was relatively minor (Fig. 7A).
Fig. 7.
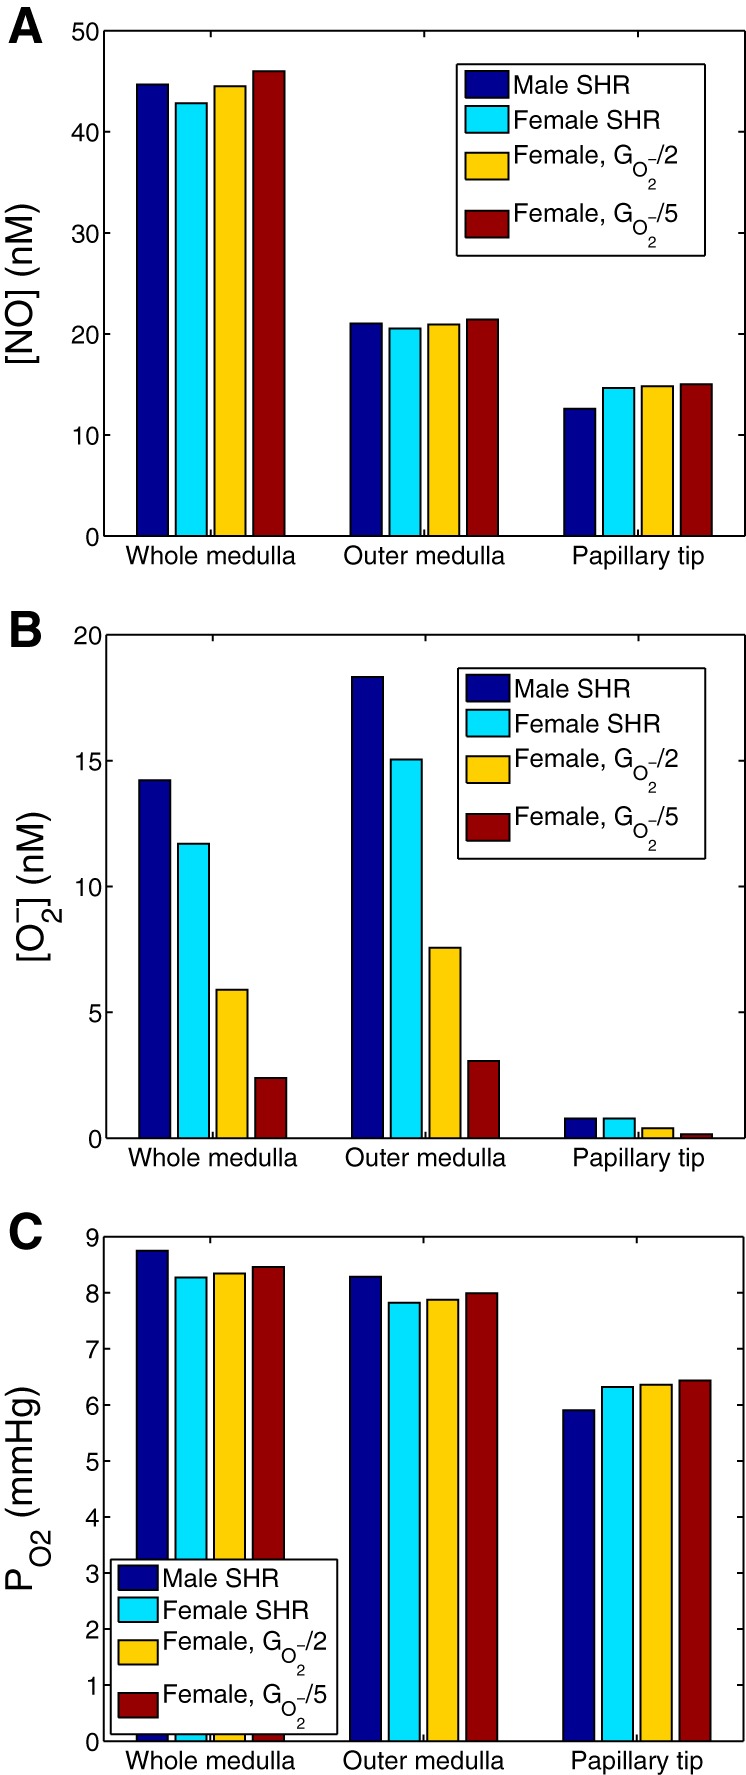
Effect of varying generation rate (denoted ) on interstitial [NO] (A), [] (B), and Po2 (C). Results were obtained for male SHR using baseline , and for female SHR using at baseline and at values 1/2 and 1/5 of baseline. The lowered was applied to all cells.
stimulates thick ascending limb active Na+ reabsorption (see Eq. 4), thereby elevating O2 consumption. Hence, when generation rate was reduced by factors of 2 and 5, whole medulla Po2 increased by 1 and 2%, respectively, with similar increases obtained in the outer medulla and papilla (see Fig. 7C).
Predicted Effects of Higher Antioxidant Capacity in Female SHR
SOD catalyzes the dismutation of into either O2 or H2O2. Plasma SOD activity has been reported to be higher in females compared with males (30). In another set of simulations, we investigated the effects of increasing [SOD] two- and threefold in female SHR. Increasing the abundance of SOD in female SHR has only minor impacts on whole medulla NO, , and Po2 levels (results not shown). The only notable effect was the ~20% reduction in [] near the papillary tip when [SOD] was increased.
DISCUSSION
A major contribution of this work is the development of a computational model of solute transport and oxygenation in the renal medulla of the kidney of a female SHR. To our knowledge, every published computational model of rat kidney functions is based on the male rat (e.g., Refs. 21, 22, 24, 25, 31, 46, 47). Even though not explicitly stated in the description of those models, the “sex” of the modeled kidney can be inferred from the physical dimensions and SNGFR. Male and female rat kidneys differ substantially in size, but also in many other aspects. Recent observations indicate that renal structure and function vary between the sexes under numerous physiological, pathological, and pharmacological conditions, as reviewed in Refs. 35, 37, 45. Importantly, males and females appear to have different degrees of blood pressure control (4, 5). Thus it is important to develop a computational model for the female rat kidney.
The present female SHR model is based on our laboratory’s published normotensive male rat models (15–17). First we adjusted model parameters to account for the differences in size and blood flow between the male and female rat kidneys. Tubular transport and metabolic parameters were left unchanged. Simulations using normotensive male and female rat kidney models produced urine with similar composition (results not shown), in accordance with experimental measurements (37). In the present study, we focused on SHR. We assumed higher and lower, respectively, and NO production rates in SHR kidneys, relative to their normotensive counterparts. Other pathophysiological differences, such as those in the neural and hormonal systems, were not considered. The male and female SHR models also generated urine with similar composition, albeit at a much higher flow rate in male SHR. We recognize that male and female rats, whether normotensive or hypertensive, differ in many other ways, but we opted here to examine the isolated impact of a few parameters only. The models could be expanded to account for other sex-specific variations. As such, the female kidney models (normotensive and hypertensive) provide a useful simulation tool for studying sex differences in kidney function, in both health and disease.
Nitric Oxide
Our baseline simulations indicate that, given the same transport and metabolic parameters, male and female rats have similar medullary O2 and NO bioavailability. This result suggests that sex differences in kidney size and blood flow alone cannot account for the greater NO levels observed in female SHR compared with males (42). Thus we investigated other factors that may explain sex-based differences in NO bioavailability.
It has been suggested that the greater NO bioavailability in female SHR may be the result of greater NO production and lower levels of NO scavenging by (10, 53). To consider the effects of higher NO-generating capacity in females, we first measured and compared total protein expressions of NOS1 and NOS3 in isolated microvessels from male and female SHR kidneys. We found that both NOS1 and NOS3 are significantly more abundant in females compared with males. This finding is consistent with previous results that indicate higher whole body production of NO in women compared with men (14, 38, 52).
A question that naturally follows is: to what extent does higher NO-generating capacity in female SHR kidneys explain their higher NO bioavailability? To answer that question, we conducted simulations using the male and female SHR computational models. Model simulation results suggest that medullary NO and Po2 levels are highly sensitive to endothelial NO generate rates (see Fig. 4). Noticeably higher NO and Po2 levels can be obtained even when the higher GNO are limited to specific vascular segments (see Fig. 6).
Oxidative Stress
Oxidative stress exacerbates blood pressure elevation and related organ injuries by contributing to inflammation, hypertrophy, and apoptosis. Hypertensive males have been reported to have greater levels of oxidative stress compared with females (28). Model simulations indicate that sex differences in oxidative stress, as reflected by differences in medullary [], could, to a large extent, stem from greater production in male SHR (Fig. 7).
We also studied the effects of the potentially lower production in females. While the model predicted lower medullary levels and thus lower levels of NO scavenging by , medullary NO levels and Po2 were not significantly increased (see Fig. 7). The relatively minor impact on NO levels may be explained, in part, by the several orders of magnitude difference in medullary [NO] (~100 nM) and [] (~0.1 nM), which renders NO scavenging by negligible. A caveat is that the model does not consider the specific cellular localization of NO and -producing enzymes. Indeed, the extent to which NO scavenging by may impact NO bioavailability may be highly dependent on the cellular localization of the ROS-producing enzymes. The potential proximity of those enzymes, which is not represented in the model, may well amplify the effect of NO scavenging by .
In summary, we have developed the first computational model of solute transport and oxygenation of the female rat kidney. Model simulations were conducted to reveal the potential roles of various physiological factors in explaining the sex differences in oxidative stress levels and NO bioavailability observed in SHR. These sex-specific models can be used as an essential component of models of integrated renal hemodynamic and transport, especially in studies of hypertension.
GRANTS
This research was supported by the National Institute of Diabetes and Digestive and Kidney Diseases Grant R01-DK-106102 to A. T. Layton, and by American Heart Association Grant 14GRNT20480199 to J. C. Sullivan.
DISCLOSURES
No conflicts of interest, financial or otherwise, are declared by the author(s).
AUTHOR CONTRIBUTIONS
Y.C., J.C.S., A.E., and A.T.L. conceived and designed research; Y.C. and J.C.S. performed experiments; Y.C., J.C.S., A.E., and A.T.L. analyzed data; Y.C., J.C.S., A.E., and A.T.L. interpreted results of experiments; Y.C., J.C.S., and A.T.L. prepared figures; Y.C. and A.T.L. drafted manuscript; Y.C., J.C.S., A.E., and A.T.L. edited and revised manuscript; Y.C., J.C.S., A.E., and A.T.L. approved final version of manuscript.
REFERENCES
- 1.Afzal S, Sattar MA, Johns EJ, Abdulla MH, Akhtar S, Hashmi F, Abdullah NA. Interaction between irbesartan, peroxisome proliferator-activated receptor (PPAR-γ), and adiponectin in the regulation of blood pressure and renal function in spontaneously hypertensive rats. J Physiol Biochem 72: 593–604, 2016. doi: 10.1007/s13105-016-0497-1. [DOI] [PubMed] [Google Scholar]
- 2.Armsen T, Reinhardt HW. Transtubular movement of urea at different degrees of water diuresis. Pflugers Arch 326: 270–280, 1971. doi: 10.1007/BF00592507. [DOI] [PubMed] [Google Scholar]
- 3.Bagnasco S, Good D, Balaban R, Burg M. Lactate production in isolated segments of the rat nephron. Am J Physiol Renal Physiol 248: F522–F526, 1985. [DOI] [PubMed] [Google Scholar]
- 4.Baylis C. Changes in renal hemodynamics and structure in the aging kidney; sexual dimorphism and the nitric oxide system. Exp Gerontol 40: 271–278, 2005. doi: 10.1016/j.exger.2005.01.008. [DOI] [PMC free article] [PubMed] [Google Scholar]
- 5.Baylis C. Sexual dimorphism in the aging kidney: differences in the nitric oxide system. Nat Rev Nephrol 5: 384–396, 2009. doi: 10.1038/nrneph.2009.90. [DOI] [PubMed] [Google Scholar]
- 6.Bottcher W, Steinhausen M. Microcirculaton of the renal papilla of rats under control conditions and after temporary ischemia. Kidney Int Suppl 10: S74–S80, 1976. [PubMed] [Google Scholar]
- 7.Brinson KN, Elmarakby AA, Tipton AJ, Crislip GR, Yamamoto T, Baban B, Sullivan JC. Female SHR have greater blood pressure sensitivity and renal T cell infiltration following chronic NOS inhibition than males. Am J Physiol Regul Integr Comp Physiol 305: R701–R710, 2013. doi: 10.1152/ajpregu.00226.2013. [DOI] [PMC free article] [PubMed] [Google Scholar]
- 8.Chen J, Layton AT, Edwards A. A mathematical model of O2 transport in the rat outer medulla. I. Model formulation and baseline results. Am J Physiol Renal Physiol 297: F517–F536, 2009. doi: 10.1152/ajprenal.90496.2008. [DOI] [PMC free article] [PubMed] [Google Scholar]
- 9.Chen Y, Gill PS, Welch WJ. Oxygen availability limits renal NADPH-dependent superoxide production. Am J Physiol Renal Physiol 289: F749–F753, 2005. doi: 10.1152/ajprenal.00115.2005. [DOI] [PubMed] [Google Scholar]
- 10.Dantas APV, Franco MC, Silva-Antonialli MM, Tostes RCA, Fortes ZB, Nigro D, Carvalho MHC. Gender differences in superoxide generation in microvessels of hypertensive rats: role of NAD(P)H-oxidase. Cardiovasc Res 61: 22–29, 2004. doi: 10.1016/j.cardiores.2003.10.010. [DOI] [PubMed] [Google Scholar]
- 11.de Rouffignac C, Bonvalet JP, Deiss S [Study of variations in the glomerular filtration rate of single superficial and deep nephrons as a function of sodium intake in the rat]. Pflugers Arch 317: 141–156, 1970. doi: 10.1007/BF00592498. [DOI] [PubMed] [Google Scholar]
- 12.Dickman KG, Mandel LJ. Differential effects of respiratory inhibitors on glycolysis in proximal tubules. Am J Physiol Renal Physiol 258: F1608–F1615, 1990. [DOI] [PubMed] [Google Scholar]
- 13.Edwards A, Layton AT. Modulation of outer medullary NaCl transport and oxygenation by nitric oxide and superoxide. Am J Physiol Renal Physiol 301: F979–F996, 2011. doi: 10.1152/ajprenal.00096.2011. [DOI] [PMC free article] [PubMed] [Google Scholar]
- 14.Forte P, Kneale BJ, Milne E, Chowienczyk PJ, Johnston A, Benjamin N, Ritter JM. Evidence for a difference in nitric oxide biosynthesis between healthy women and men. Hypertension 32: 730–734, 1998. doi: 10.1161/01.HYP.32.4.730. [DOI] [PubMed] [Google Scholar]
- 15.Fry BC, Edwards A, Layton AT. Impacts of nitric oxide and superoxide on renal medullary oxygen transport and urine concentration. Am J Physiol Renal Physiol 308: F967–F980, 2015. doi: 10.1152/ajprenal.00600.2014. [DOI] [PMC free article] [PubMed] [Google Scholar]
- 16.Fry BC, Edwards A, Sgouralis I, Layton AT. Impact of renal medullary three-dimensional architecture on oxygen transport. Am J Physiol Renal Physiol 307: F263–F272, 2014. doi: 10.1152/ajprenal.00149.2014. [DOI] [PMC free article] [PubMed] [Google Scholar]
- 17.Fry BC, Edwards A, Layton AT. Impact of nitric-oxide-mediated vasodilation and oxidative stress on renal medullary oxygenation: a modeling study. Am J Physiol Renal Physiol 310: F237–F247, 2016. doi: 10.1152/ajprenal.00334.2015. [DOI] [PMC free article] [PubMed] [Google Scholar]
- 18.Gu Q, Burt VL, Paulose-Ram R, Dillon CF. Gender differences in hypertension treatment, drug utilization patterns, and blood pressure control among US adults with hypertension: data from the National Health and Nutrition Examination Survey 1999-2004. Am J Hypertens 21: 789–798, 2008. doi: 10.1038/ajh.2008.185. [DOI] [PubMed] [Google Scholar]
- 19.Herrera M, Hong NJ, Garvin JL. Aquaporin-1 transports NO across cell membranes. Hypertension 48: 157–164, 2006. doi: 10.1161/01.HYP.0000223652.29338.77. [DOI] [PubMed] [Google Scholar]
- 20.Jafar TH, Schmid CH, Stark PC, Toto R, Remuzzi G, Ruggenenti P, Marcantoni C, Becker G, Shahinfar S, De Jong PE, De Zeeuw D, Kamper AL, Strangaard S, Levey AS. The rate of progression of renal disease may not be slower in women compared with men: a patient-level meta-analysis. Nephrol Dial Transplant 18: 2047–2053, 2003. doi: 10.1093/ndt/gfg317. [DOI] [PubMed] [Google Scholar]
- 21.Layton AT. A mathematical model of the urine concentrating mechanism in the rat renal medulla. I. Formulation and base-case results. Am J Physiol Renal Physiol 300: F356–F371, 2011. doi: 10.1152/ajprenal.00203.2010. [DOI] [PMC free article] [PubMed] [Google Scholar]
- 22.Layton AT, Dantzler WH, Pannabecker TL. Urine concentrating mechanism: impact of vascular and tubular architecture and a proposed descending limb urea-Na+ cotransporter. Am J Physiol Renal Physiol 302: F591–F605, 2012. doi: 10.1152/ajprenal.00263.2011. [DOI] [PMC free article] [PubMed] [Google Scholar]
- 23.Layton AT, Layton HE. A region-based mathematical model of the urine concentrating mechanism in the rat outer medulla. I. Formulation and base-case results. Am J Physiol Renal Physiol 289: F1346–F1366, 2005. doi: 10.1152/ajprenal.00346.2003. [DOI] [PubMed] [Google Scholar]
- 24.Layton AT, Vallon V, Edwards A. Modeling oxygen consumption in the proximal tubule: effects of NHE and SGLT2 inhibition. Am J Physiol Renal Physiol 308: F1343–F1357, 2015. doi: 10.1152/ajprenal.00007.2015. [DOI] [PMC free article] [PubMed] [Google Scholar]
- 25.Layton AT, Vallon V, Edwards A. Predicted consequences of diabetes and SGLT inhibition on transport and oxygen consumption along a rat nephron. Am J Physiol Renal Physiol 310: F1269–F1283, 2016. doi: 10.1152/ajprenal.00543.2015. [DOI] [PMC free article] [PubMed] [Google Scholar]
- 26.Li N, Yi FX, Spurrier JL, Bobrowitz CA, Zou AP. Production of superoxide through NADH oxidase in thick ascending limb of Henle’s loop in rat kidney. Am J Physiol Renal Physiol 282: F1111–F1119, 2002. doi: 10.1152/ajprenal.00218.2001. [DOI] [PubMed] [Google Scholar]
- 27.Liss P, Nygren A, Erikson U, Ulfendahl HR. Injection of low and iso-osmolar contrast medium decreases oxygen tension in the renal medulla. Kidney Int 53: 698–702, 1998. doi: 10.1046/j.1523-1755.1998.00811.x. [DOI] [PubMed] [Google Scholar]
- 28.Lopez-Ruiz A, Sartori-Valinotti J, Yanes LL, Iliescu R, Reckelhoff JF. Sex differences in control of blood pressure: role of oxidative stress in hypertension in females. Am J Physiol Heart Circ Physiol 295: H466–H474, 2008. doi: 10.1152/ajpheart.01232.2007. [DOI] [PMC free article] [PubMed] [Google Scholar]
- 29.MacKay LL, MacKay EM. Factors which determine renal weight. III. Sex. Am J Physiol 83: 196–201, 1927. [Google Scholar]
- 30.Morales RC, Bahnson ES, Havelka GE, Cantu-Medellin N, Kelley EE, Kibbe MR. Sex-based differential regulation of oxidative stress in the vasculature by nitric oxide. Redox Biol 4: 226–233, 2015. doi: 10.1016/j.redox.2015.01.007. [DOI] [PMC free article] [PubMed] [Google Scholar]
- 31.Moss R, Layton AT. Dominant factors that govern pressure natriuresis in diuresis and antidiuresis: a mathematical model. Am J Physiol Renal Physiol 306: F952–F969, 2014. doi: 10.1152/ajprenal.00500.2013. [DOI] [PMC free article] [PubMed] [Google Scholar]
- 32.Munger K, Baylis C. Sex differences in renal hemodynamics in rats. Am J Physiol Renal Physiol 254: F223–F231, 1988. [DOI] [PubMed] [Google Scholar]
- 33.Neugarten J, Acharya A, Silbiger SR. Effect of gender on the progression of nondiabetic renal disease: a meta-analysis. J Am Soc Nephrol 11: 319–329, 2000. [DOI] [PubMed] [Google Scholar]
- 34.Okada K, Yanai M, Takeuchi K, Matsuyama K, Nitta K, Hayashi K, Takahashi S. Sex differences in the prevalence, progression, and improvement of chronic kidney disease. Kidney Blood Press Res 39: 279–288, 2014. doi: 10.1159/000355805. [DOI] [PubMed] [Google Scholar]
- 35.Pechere-Bertschi A, Burnier M. Gonadal steroids, salt-sensitivity and renal function. Curr Opin Nephrol Hypertens 16: 16–21, 2007. doi: 10.1097/MNH.0b013e328011d7f6. [DOI] [PubMed] [Google Scholar]
- 36.Remuzzi A, Puntorieri S, Mazzoleni A, Remuzzi G. Sex related differences in glomerular ultrafiltration and proteinuria in Munich-Wistar rats. Kidney Int 34: 481–486, 1988. doi: 10.1038/ki.1988.206. [DOI] [PubMed] [Google Scholar]
- 37.Sabolić I, Asif AR, Budach WE, Wanke C, Bahn A, Burckhardt G. Gender differences in kidney function. Pflugers Arch 455: 397–429, 2007. doi: 10.1007/s00424-007-0308-1. [DOI] [PubMed] [Google Scholar]
- 38.Sader MA, Celermajer DS. Endothelial function, vascular reactivity and gender differences in the cardiovascular system. Cardiovasc Res 53: 597–604, 2002. doi: 10.1016/S0008-6363(01)00473-4. [DOI] [PubMed] [Google Scholar]
- 39.Silbiger SR, Neugarten J. The impact of gender on the progression of chronic renal disease. Am J Kidney Dis 25: 515–533, 1995. doi: 10.1016/0272-6386(95)90119-1. [DOI] [PubMed] [Google Scholar]
- 40.Skov K, Nyengaard JR, Korsgaard N, Mulvany MJ. Number and size of renal glomeruli in spontaneously hypertensive rats. J Hypertens 12: 1373–1376, 1994. doi: 10.1097/00004872-199412000-00009. [DOI] [PubMed] [Google Scholar]
- 41.Stokes JB, Grupp C, Kinne RKH. Purification of rat papillary collecting duct cells: functional and metabolic assessment. Am J Physiol 253: F251–F262, 1987. [DOI] [PubMed] [Google Scholar]
- 42.Sullivan JC, Pardieck JL, Hyndman KA, Pollock JS. Renal NOS activity, expression, and localization in male and female spontaneously hypertensive rats. Am J Physiol Regul Integr Comp Physiol 298: R61–R69, 2010. doi: 10.1152/ajpregu.00526.2009. [DOI] [PMC free article] [PubMed] [Google Scholar]
- 43.Toot J, Jenkins C, Dunphy G, Boehme S, Hart M, Milsted A, Turner M, Ely D. Testosterone influences renal electrolyte excretion in SHR/y and WKY males. BMC Physiol 8: 5, 2008. doi: 10.1186/1472-6793-8-5. [DOI] [PMC free article] [PubMed] [Google Scholar]
- 44.Uchida S, Endou H. Substrate specificity to maintain cellular ATP along the mouse nephron. Am J Physiol Renal Physiol 255: F977–F983, 1988. [DOI] [PubMed] [Google Scholar]
- 45.Ueno K, Sato H. Sex-related differences in pharmacokinetics and pharmacodynamics of anti-hypertensive drugs. Hypertens Res 35: 245–250, 2012. doi: 10.1038/hr.2011.189. [DOI] [PubMed] [Google Scholar]
- 46.Weinstein AM. A mathematical model of distal nephron acidification: diuretic effects. Am J Physiol Renal Physiol 295: F1353–F1364, 2008. doi: 10.1152/ajprenal.90356.2008. [DOI] [PMC free article] [PubMed] [Google Scholar]
- 47.Weinstein AM. A mathematical model of rat proximal tubule and loop of Henle. Am J Physiol Renal Physiol 308: F1076–F1097, 2015. doi: 10.1152/ajprenal.00504.2014. [DOI] [PMC free article] [PubMed] [Google Scholar]
- 48.Whorton AR, Simonds DB, Piantadosi CA. Regulation of nitric oxide synthesis by oxygen in vascular endothelial cells. Am J Physiol Lung Cell Mol Physiol 272: L1161–L1166, 1997. [DOI] [PubMed] [Google Scholar]
- 49.Wu F, Park F, Cowley AW Jr, Mattson DL. Quantification of nitric oxide synthase activity in microdissected segments of the rat kidney. Am J Physiol Renal Physiol 276: F874–F881, 1999. [DOI] [PubMed] [Google Scholar]
- 50.Zeidel ML, Silva P, Seifter JL. Intracellular pH regulation and proton transport by rabbit renal medullary collecting duct cells. Role of plasma membrane proton adenosine triphosphatase. J Clin Invest 77: 113–120, 1986. doi: 10.1172/JCI112264. [DOI] [PMC free article] [PubMed] [Google Scholar]
- 51.Zhang W, Edwards A. Oxygen transport across vasa recta in the renal medulla. Am J Physiol Heart Circ Physiol 283: H1042–H1055, 2002. doi: 10.1152/ajpheart.00074.2002. [DOI] [PubMed] [Google Scholar]
- 52.Zhen Y, Xiao S, Ren Z, Shen HW, Su H, Tang YB, Zeng H. Increased endothelial progenitor cells and nitric oxide in young prehypertensive women. J Clin Hypertens (Greenwich) 17: 298–305, 2015. doi: 10.1111/jch.12493. [DOI] [PMC free article] [PubMed] [Google Scholar]
- 53.Zimmerman MA, Sullivan JC. Hypertension: what’s sex got to do with it? Physiology (Bethesda) 28: 234–244, 2013. doi: 10.1152/physiol.00013.2013. [DOI] [PMC free article] [PubMed] [Google Scholar]
- 54.Zou AP, Wu F, Cowley AW Jr. Protective effect of angiotensin II-induced increase in nitric oxide in the renal medullary circulation. Hypertension 31: 271–276, 1998. doi: 10.1161/01.HYP.31.1.271. [DOI] [PubMed] [Google Scholar]