

Abstract
Translation is one of the fundamental processes of life. It comprises the assembly of polypeptides whose amino acid sequence corresponds to the codon sequence of an mRNA’s ORF. Translation is performed by the ribosome; therefore, in order to understand translation and its regulation we must be able to determine the numbers and locations of ribosomes on mRNAs in vivo. Furthermore, we must be able to examine their redistribution in different physiological contexts and in response to experimental manipulations. The ribosome profiling method provides us with an opportunity to learn these locations, by sequencing a cDNA library derived from the short fragments of mRNA covered by the ribosome. Since its original description, the ribosome profiling method has undergone continuing development; in this article we describe the method’s current state. Important improvements include: the incorporation of sample barcodes to enable library multiplexing, the incorporation of unique molecular identifiers to enable to removal of duplicated sequences, and the replacement of a gel-purification step with the enzymatic degradation of unligated linker.
Keywords: RNA, Translation, Ribosome, Ribosome profiling, High-throughput sequencing, RNA-sequencing
3 Introduction
Translation is one of the fundamental processes of life – it describes the process by which the genetic information within the nucleotide sequence of an mRNA is converted into physical agency in the form of a protein. Indeed, in the yeast Saccharomyces cerevisiae, protein comprises approximately half the dry weight of a cell [1,2], indicating that translation is a major biosynthetic activity, consuming approximately half the energy expended during rapid growth. Translation is performed by a mega-dalton ribonucleoprotein complex called the ribosome. The ribosome first identifies the region within an mRNA that encodes a protein (the Open Reading Frame, ORF), and then reads that ORF three nucleotides (one codon) at a time, assembling a polypeptide whose amino acid sequence corresponds to the codon sequence of the ORF. While we have an understanding of the general mechanism of translation, much remains to be determined. Furthermore, we have comparatively little understanding of the regulation of translation in difference physiological contexts, and how its dysfunction leads to disease.
Ribosome profiling is a method that leverages high-throughput sequencing and bioinformatics to determine the transcriptome-wide locations of ribosomes in a cell lysate. The basis of ribosome profiling is that, at a given moment, each ribosome covers a short fragment (~28 nt) of the mRNA that it is translating. In a cell lysate, this results in that short fragment of mRNA being protected from digestion with exogenous RNases (see Wolin & Walter [3], and references therein). Thus, for an organism for which we know the sequence of the transcriptome, we can determine the location of ribosomes by first generating these fragments (termed “ribosome footprints”, or simply “footprints”), and then isolating them and determining their sequence [3–5]. Knowing the transcriptome-wide locations of ribosomes allows the determination of which mRNAs, and which regions of a given mRNA, are engaged with a ribosome, and therefore likely to be undergoing translation. Examining the frequency distribution of ribosome footprints along a given mRNA(s) we can learn about the nature of ribosomal movement and how it might be influenced by mRNA sequence. Furthermore, by counting the number of ribosomes engaged with a given mRNA, we can obtain an estimate of the degree to which the mRNA is translated. After proper consideration of confounding factors (for example, more abundant mRNAs will tend to produce more footprints), these measurements can be compared between different mRNAs, and for a given mRNA across different physiological conditions. When further combined with genetic and chemical manipulation, ribosome profiling gives us unprecedented ability to examine the process of translation and its regulation in vivo. Ribosome profiling was initially developed using yeast [4], but has since been applied to cells, tissues, and embryos from diverse metazoans. For recent perspectives on ribosome profiling and its applications, readers are referred to several excellent reviews: Jackson & Standart [6], Ingolia [7], Brar & Weissman [8], and Andreev et al. [9].
This article describes the current state of the ribosome profiling protocol as routinely performed in our laboratory. It has been the basis of ribosome profiling experiments from recent studies associated with our laboratory, including but not limited to: Iwasaki et al. [10], Werner et al. [11], and Ishikawa et al. [12]. In essence, the procedure is similar to that described in Ingolia et al. (2012) [13]: cells are rapidly harvested and lysed under conditions that are expected to preserve in vivo ribosome positioning. This cell lysate is then subjected to nuclease footprinting with RNase I. Ribosomes are pelleted from the digested lysate by ultracentrifugation through a sucrose cushion, and then RNA is extracted from the pellet. To isolate ribosome footprints, the RNA from the ribosomal pellet is resolved by electrophoresis through a denaturing gel, and then fragments of the expected size range extracted from the gel. The 3′ ends of these RNA fragments are treated with T4 PNK to allow ligation of a pre-adenylated DNA linker with T4 Rnl2(tr) K227Q. This RNA-DNA hybrid molecule is used as a template for reverse transcription, and following gel-based purification of full-length products the resulting single-stranded cDNA is then circularized using a CircLigase. A double-stranded DNA library of suitable structure and concentration for Illumina sequencing is then constructed from the single-stranded cDNA circles by means of a PCR reaction.
As the result of our continuing development and optimization, the protocol described in this article has a number of innovations with respect to out previously published protocol (see Figure 1):
We have designed a number of oligonucleotide synthetic controls to guide the remaining gel extraction steps, judge the efficacy of the circularization reaction, and to aid in the planning and execution of the final library construction PCR. These are outlined in Section 4.3.
A number of the enzymes employed in the footprinting and library construction have changed: we now obtain RNase I from Epicentre; use Protoscript II for the reverse transcription, and CircLigase II for cDNA circularization.
We have found that a shorter, faster ultracentrifugation step is equally effective in pelleting the ribosome. For such a long, linear protocol time savings are a significant advantage. We now recommend centrifugation at 100 krpm for 1 hour at 4°C in a TLA100.3 or TLA110 rotor (see Section 5.2).
For a number of steps in the protocol, we now employ specific kits. For the purification of RNA from the ribosome pellet we use the Direct-zol kit from Zymo Research (see Table 1). Additionally, for a number of buffer exchanges we now utilize the (Oligo) Clean & Concentrator kit, also from Zymo Research (see Table 1). The use of these kits has improved the reproducibility and convenience of the corresponding steps in the protocol.
We have implemented a series of custom DNA linkers with sequences that allow for the identification of individual samples (sample barcodes) and individual ligation events (unique molecular identifiers, UMIs). This strategy provides a number of advantages: first, sample barcodes enable sample multiplexing before sequencing. This allows more samples to be sequenced for the same cost. Furthermore, it can be used to avoid the variance that is associated with sequencing different samples on different lanes of a sequencer [14]. Secondly, the UMIs are likely to ameliorate the effect of sequence biases in ligation and circularization during library construction [15,16]. Thirdly, the UMIs will also allow for the computational removal of sequences likely to derive from selective amplification during the library construction PCR [15,16].
Ingolia et al. (2012) [13] includes a gel extraction to separate ligated RNA fragments from unligated DNA linker. We have replaced this step with an enzymatic depletion of unligated linker. Yeast 5′-deadenylase is used to deadenylate the pre-adenylated linker, rendering it the only molecular species in the ligation vulnerable to degradation by the 5′-3′ ssDNA exonuclease RecJ. As gel extractions typically result in a loss of material, we expect this replacement will make the protocol more efficient.
We now perform rRNA reduction on linker-ligated RNA fragments prior to reverse transcription using the Ribo-Zero Gold rRNA removal kits from Illumina (see Table 1).
In contrast to the library construction PCR optimization performed in Ingolia et al. (2012) [13], we have implemented a qPCR assay to assess the concentration of the single-stranded cDNA circles produced by the circularization reaction. This is used to determine the optimal conditions (amount of circularized template and number of cycles) for a single library construction PCR.
Figure 1. A schematic of the ribosome profiling protocol.
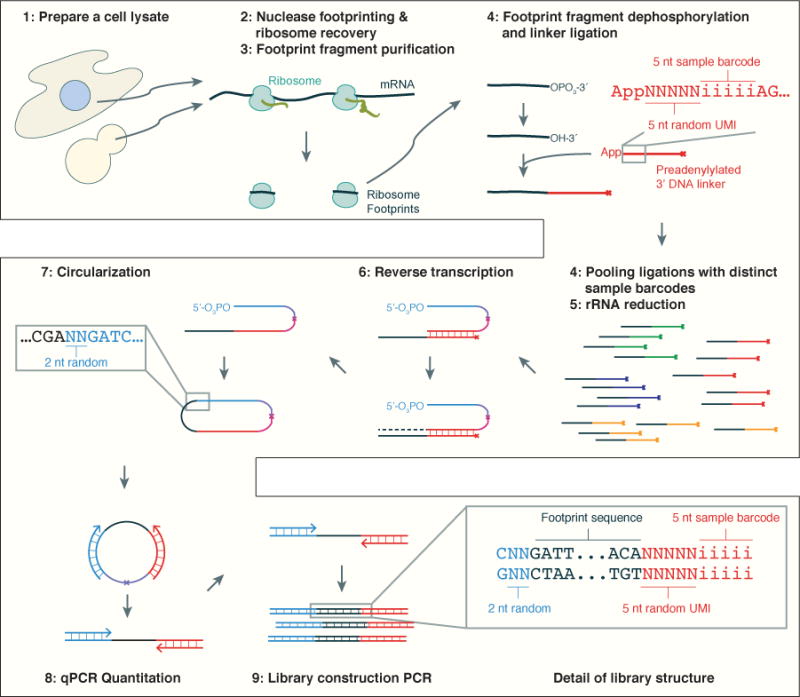
The major steps of the updated ribosome profiling protocol, highlighting several of the most important developments. Each step has the same name and number as the corresponding part of this protocol. UMI – Unique Molecular Index.
Table 1.
Equipment and reagents used in ribosome profiling
| Material | Manufacturer | Catalog.No. | Note |
|---|---|---|---|
| 100 mg/ml Cycloheximide | Sigma-Aldrich | C4859-1ML | 1 |
| Harringtonine | LKT Laboratories | H0169 | 2 |
| DMSO cell culture grade | Sigma-Aldrich | D2650 | – |
| Liquid nitrogen | PRAXAIR | UN1977 | 3 |
| PBS pH 7.2 | Invitrogen | 20012-027 | – |
| RNase-free water | Invitrogen | AM9930 | – |
| Quant-iT RiboGreen RNA assay kit | Life Technologies | R11490 | – |
| 1 M Tris*Cl pH 8 RNase-free | Invitrogen | AM9855G | – |
| 1 M Tris*Cl pH 7 RNase-free | Invitrogen | AM9850G | – |
| 5 M NaCl RNase-free | Invitrogen | AM9760G | – |
| 1 M MgCl2 RNase-free | Invitrogen | AM9530G | – |
| Turbo DNase 2 U/µl | Invitrogen | AM2238 | – |
| Triton X-100 molecular biology grade | Calbiochem | 648466 | – |
| SUPERase*In 20 U/µl | Invitrogen | AM2694 | – |
| Sucrose molecular biology grade | VWR | IB37160 | – |
| 3 M NaOAc pH 5.5 RNase-free | Invitrogen | AM9740 | – |
| RNase I 10 U/µl | Epicentre | N6901K | 4 |
| 13 × 51 mm polycarbonate ultracentrifuge tube | Beckman | 349622 | – |
| Direct-zol RNA MiniPrep | Zymo | R2050 | – |
| TRIzol | Life Technologies | 15596018 | 5 |
| Ethanol molecular biology grade | Sigma-Aldrich | E7023-500ML | 6 |
| Isopropanol molecular biology grade | VWR | 87000-048 | 6 & 7 |
| GlycoBlue 15 mg/ml | Invitrogen | AM9515 | – |
| 0.5 M EDTA RNase-free | Invitrogen | AM9260G | – |
| Bromophenol blue | Bio-Rad | 161-0404 | – |
| Formamide molecular biology grade | Promega | H5051 | 8 |
| Denaturing 15% polyacrylamide | Invitrogen | EC68852BOX | 9 |
| TBE-urea gel 12 wells 10 bp ladder 1 µg/µl | Invitrogen | 10821015 | – |
| miRNA marker | New England Biolabs | N2102S | – |
| 10× TBE RNase-free | Promega | V4251 | – |
| 10000× SYBR Gold | Invitrogen | S11494 | 10 |
| 10% SDS molecular biology grade | Promega | V6551 | 7 |
| 5′ Adenylation Kit | New England Biolabs | E2610S | 11 |
| T4 polynucleotide kinase | New England Biolabs | M0201S | 12 |
| T4 RNA Ligase 2 truncated K227Q | New England Biolabs | M0351S | 13 |
| Yeast 5p-deadenylase | Epicentre | DA11101K | – |
| RecJ exonuclease | Epicentre | RJ411250 | 14 |
| Oligo Clean & Concentrator kit | Zymo Research | D4060 | – |
| Ribo-Zero Gold rRNA Removal Kit (Yeast) | Illumina | MRZY1306 | – |
| Ribo-Zero Gold rRNA Removal Kit (Human/Mouse/Rat) | Illumina | MRZG126 | – |
| 10 mM dNTP mix | Invitrogen | 18427-013 | – |
| ProtoScript II | New England Biolabs | M0368L | 15 |
| Sodium hydroxide | EMD Chemicals | SX0590-1 | 16 |
| CircLigase II | Epicentre | CL9021K | 17 |
| DyNAmo HS SYBR Green qPCR Kit | Thermo scientific | F410L | – |
| Phusion polymerase | New England Biolabs | M0530S | 18 |
| Ficoll 400 BioXtra for molecular biology | Sigma-Aldrich | F2637 | – |
| Non-denaturing 8% polyacrylamide TBE gel 12 wells | Invitrogen | EC62162BOX | 9 |
| DNA Clean & Concentrator-5 | Zymo Research | D4003 | – |
| 15 ml & 50 ml Conical Sterile Polypropylene Centrifuge Tubes | VWR | 339650 & 339653 | – |
| ULTRA-WARE Microfiltration Assembly with Fritted Glass Support (47 mm) | Kimble | 953755-0000 | – |
| ULTRA-WARE Microfiltration Assembly with Fritted Glass Support (90 mm) | Kimble | 953755-0090 | – |
| 0.45 µM Whatman cellulose nitrate membrance filters | GE Life Sciences | 7184-004 | – |
| Metal spatulas, straight-edge and rounded | Various | – | – |
| MM400 Mixer mill | Retsch | 20.745.0001 | – |
| Grinding jars MM 400, screw top design, 10 ml | Retsch | 01.462.0236 | – |
| Grinding balls, Stainless steel, 10 mm | Retsch | 05.368.0063 | – |
| Cell lifter | VWR | 29442-200 | – |
| Non-stick RNase-free microfuge tubes | Invitrogen | AM12450 | – |
| 26-gauge needle | VWR | BD305111 | – |
| 1 ml syringe | VWR | BD309659 | – |
| Filter pipette tips Pre-sterilized RNase-free | Rainin | RT-[10|20|200|1000]F | – |
| Gel loading pipette tips pre-sterilized RNase-free | National Scientific | MN520R-LRS | – |
| Refrigerated microcentrifuge 5430R | VWR | 97027-866 | – |
| GloMax-Multi Jr Single Tube Multimode Reader | Promega | E6080 | – |
| Fluorescence Optical Kit BLUE | Promega | E6071 | – |
| Minicell borosilicate glass cuvettes | Promega | E6091 | – |
| Optima TLX Ultracentrifuge | Beckman | 361545 | – |
| TLA 100.3 rotor | Beckman | 349481 | – |
| Dry block heater | VWR | 12621-104 | – |
| Dry block for microfuge tubes | VWR | 13259-002 | – |
| Mini-Cell polyacrylamide gel box | Invitrogen | EI0001 | – |
| Electrophoresis power supply | VWR | 27370-265 | – |
| DarkReader | Clare Chemical Research | DR46B | 19 |
| Razors | VWR | 55411-050 | – |
| BD Clay Adams Nutator Mixer | VWR | 15172-203 | – |
| Thermal cycler | Bio-Rad | 170-9713 | – |
| DynaMag-2 separation rack | Invitrogen | 12321D | – |
| ThermoMixer | VWR | 21516-170 | – |
| Thermal cycler with real-time PCR detection | Bio-Rad | CFX96 | – |
| TempPlate No-Skirt 0.1 ml PCR plates, White | USA scientific | 1402-9590 | – |
| Microseal B Adhesive Sealer | Bio-Rad | MSB-1001 | – |
| Agilent 2200 TapeStation Nucleic Acid System | Agilent Technologies | G2965AA | – |
| High Sensitivity D1000 ScreenTape | Agilent Technologies | 5067-5584 | – |
| High Sensitivity D1000 Reagents | Agilent Technologies | 5067-5585 | – |
Cycloheximide is very toxic and harmful to the environment. Handle solutions containing cycloheximide with care, and decontaminate and dispose of waste in accordance with institutional regulations.
CAUTION – Harringtonine is very toxic. Handle solutions containing harringtonine with care, and decontaminate and dispose of waste in accordance with institutional regulations.
CAUTION – Liquid nitrogen is a refrigerated liquid. It may cause burns or injury, and may displace oxygen and thus cause rapid suffocation.
Epicentre and Life Technologies, (the two commercial suppliers of Escherichia coli RNase I) use different unit definitions for RNase I. Substantial changes in the RNase activity during nuclease footprinting could compromise the experiment.
Can be substituted with other Direct-zol compatible reagents. CAUTION—TRIzol and equivalent reagents are very toxic, corrosive, and volatile. Use proper protection when using TRIzol, perform work in a fume hood, and dispose all waste in accordance with institutional regulations.
CAUTION – Highly flammable and volatile.
CAUTION – Irritant.
CAUTION – Reproductive toxin.
CAUTION – Acrylamide is a neurotoxin. Use proper protection when handling polyacrylamide gels.
CAUTION – Nucleic acid stains are typically mutagenic. Use personal protection when handling gel staining solution and dispose of waste in accordance with regulations.
Contains Mth RNA Ligase, supplied with 1 mM ATP and 10X 5′ DNA adenylation reaction buffer.
Supplied with 10X T4 polynucleotide kinase buffer. CRITICAL – Avoid the 3′ phosphatase minus mutant, M0236S.
Supplied with PEG 8000 50% w/v and 10X T4 RNA ligase buffer.
CRITICAL — The New England Biolabs unit definition for RecJ is 1/20th the Epicentre unit definition. CRITICAL — Epicentre now recommends that RecJ is stored at −80°C to preserve the enzyme’s activity.
Supplied with 5X first-strand buffer and 0.1 M DTT. NOTE — Similar reverse transcriptases such as SuperScript II (Invitrogen) can be substituted directly; SuperScript III can be used with minor alterations in the reverse transcription protocol.
CAUTION – Highly corrosive.
Supplied with 10X CircLigase buffer, 5M Betaine, and 50 mM MnCl2.
Supplied with 5X HF buffer.
A standard UV transilluminator can be used instead.
This procedure has the added benefit of preserving more cDNA circles for future use. To illustrate these advances this article follows the production of a ribosome profiling library consisting of five distinct wild-type yeast samples. We also discuss data analysis, and use the constructed library to illustrate the characteristics we expect of ribosome footprints. We then conclude by discussing the variety of ribosome profiling protocols that exist, and the experimental choices they present.
4 Materials & methods
Similarly to other targeted high-throughput sequencing methods, ribosome profiling requires a large variety of equipment and reagents. In Table 1 we detail the equipment and reagents we routinely use to perform ribosome profiling. In Section 4.1 we describe the recipes of the buffers we employ. In Section 4.2 we detail the sequences of the oligonucleotides we use in preparation of the ribosome profiling sequencing library, and in Section 4.3 the synthetic controls we use to monitor our progress throughout the library preparation procedure.
4.1 Buffer recipes
Use sterile, RNase-free water, reagents, and techniques in all recipes and protocol steps.
4.1.1 Polysome buffer
Prepare immediately prior to use.
4.1.2 Lysis buffer
Lysis buffer comprises 1% v/v Triton X-100 and 25 U/ml Turbo DNase I in Polysome buffer. Prepare immediately prior to use and store on ice.
4.1.3 Sucrose cushion
The sucrose cushion comprises 1 M sucrose and 20 U/ml SUPERase*In in Polysome buffer. Prepare immediately prior to use and store on ice.
4.1.4 2X Denaturing sample loading buffer
Prepare in advance by dissolving 15 mg bromophenol blue in 1 ml 0.5 M EDTA and adding 200 µl of this to 9.8 ml formamide. Store indefinitely at −20°C. Other denaturing nucleic acid loading buffers can be substituted, but avoid the dye xylene cyanol, which interferes with visualizing the ligation product band.
4.1.5 RNA gel extraction buffer
Prepare in advance and store indefinitely at room temperature.
4.1.6 DNA gel extraction buffer
Prepare in advance and store indefinitely at room temperature.
4.1.7 6X Non-denaturing sample loading buffer
Prepare in advance and store at room temperature. Other standard DNA non-denaturing electrophoresis sample loading buffers can be substituted.
4.2 Oligonucleotides
Oligonucleotide sequences are described using the standard nomenclature, namely:
4.2.1 Size marker oligoribonucleotides
Note that all residues herein are ribonucleotides.
Upper size marker, NI-800:
5′-AUGUACACUAGGGAUAACAGGGUAAUCAACGCGA/3Phos/
Lower size marker, NI-801:
5′-AUGUUAGGGAUAACAGGGUAAUGCGA/3Phos/
4.2.2 Barcoded linker oligonucleotides
Our linker oligonucleotides are 5′ phosphorylated to enable enzymatic pre-adenylation by Mth RNA ligase (see Section 4.2.2.1), which is necessary for ligation to RNA fragments with T4 Rnl2(tr) K227Q.
The linkers are also 3′ blocked with the 3′ chain terminator dideoxycytidine in order to prevent linker concatamers forming during ligation.
The linker sequence begins with a five random nucleotides which form a UMI. This UMI serves two functions: 1. to ameliorate potential sequence biases in ligation, and 2. to aid (in concert with the two random nucleotides in the reverse transcription primer, NI-802, see Section 4.2.3) in the bioinformatic identification of sequences duplicated by the final library preparation PCR (see Sections 5.11). After the UMI, each linker contains a different five nucleotide sequence termed the sample barcode (see Table 8, column “Barcode”). The sample barcode allows samples ligated to different linkers to be identified computationally, enabling multiplexing of samples before the reverse transcription step (Section 5.6). Each sample barcode differs from each other sample barcode at three or more nucleotide positions. Moreover, the nucleotide composition of each sample barcode is roughly balanced and is interleaved with consideration of purines and pyrimidines, A/T versus G/C base pairs, and distinct excitation during Illumina sequencing (AC versus GT). The sequences of these linkers are enumerated in Table 8.
Table 8.
Linker oligonucleotide sequences
| Index | Primer | Barcode | Oligo sequence |
|---|---|---|---|
| 1 | NI-810 | ATCGT | 5′-/5Phos/NNNNNATCGTAGATCGGAAGAGCACACGTCTGAA/3ddC/ |
| 2 | NI-811 | AGCTA | 5′-/5Phos/NNNNNAGCTAAGATCGGAAGAGCACACGTCTGAA/3ddC/ |
| 3 | NI-812 | CGTAA | 5′-/5Phos/NNNNNCGTAAAGATCGGAAGAGCACACGTCTGAA/3ddC/ |
| 4 | NI-813 | CTAGA | 5′-/5Phos/NNNNNCTAGAAGATCGGAAGAGCACACGTCTGAA/3ddC/ |
| 5 | NI-814 | GATCA | 5′-/5Phos/NNNNNGATCAAGATCGGAAGAGCACACGTCTGAA/3ddC/ |
| 6 | NI-815 | GCATA | 5′-/5Phos/NNNNNGCATAAGATCGGAAGAGCACACGTCTGAA/3ddC/ |
| 7 | NI-816 | TAGAC | 5′-/5Phos/NNNNNTAGACAGATCGGAAGAGCACACGTCTGAA/3ddC/ |
| 8 | NI-817 | TCTAG | 5′-/5Phos/NNNNNTCTAGAGATCGGAAGAGCACACGTCTGAA/3ddC/ |
4.2.2.1 Enzymatic pre-adenylation of linker using Mth RNA ligase
Linker oligonucleotides require enzymatic pre-adenylation prior to ligation to RNA fragments with T4 Rnl2(tr) K227Q.
Combine 1.2 µl linker oligonucleotide at 100 µM, 2 µl 10X 5′ DNA adenylation reaction buffer, 2 µl 1 mM ATP, 13.8 µl water, and 2 µl Mth RNA Ligase.
Incubate for 1 hour at 65°C, then heat-inactivate the enzyme by incubation at 85°C for 5 minutes.
Add 30 µl water to the sample and then purify using the Oligo Clean & Concentrator according to the manufacturer’s instructions, except elute in 6 µl nuclease-free water.
Store at −20°C and avoid repeated freeze-thaw.
4.2.3 Reverse transcription primer, NI-802
The reverse transcription primer is 5′ phosphorylated to enable ligation by CircLigases during circularization. Thereafter the primer’s sequence begins with a two random nucleotides to ameliorate potential sequence biases in circularization. Using the sequence RN rather than NN may be advantageous (see Section 5.11). The primer also contains an 18-atom hexa-ethyleneglycol spacer that is thought to block elongation by DNA polymerases. The aim of including this moiety is to prevent rolling-circle amplification of cDNA circles during the library construction PCR.
5′-/5Phos/NNAGATCGGAAGAGCGTCGTGTAGGGAAAGAG/iSp18/GTGACTGGAGTTCAGACGTGTGCTC
4.2.4 qPCR quantitation primers
Forward qPCR primer NI-827:
5′-CTCTTTCCCTACACGACGCTC
Reverse qPCR primer NI-828:
5′-GTGACTGGAGTTCAGACGTGTG
4.2.5 Library construction PCR primers
Forward library PCR primer, NI-NI-798:
5′-AATGATACGGCGACCACCGAGATCTACACTCTTTCCCTACACGACGCTC
In addition to barcodes added during linker ligation, different pools can be barcoded at the PCR stage using indexed reverse library PCR primers – the same approach as the TruSeq low-throughput barcodes. In priciple, this would allow 96 separate samples to be included in a library – 12 pools barcoded by the indexed reverse library PCR primers (see Table 9, column “Index”), where each pool contains eight samples barcoded through the ligation of different linkers from Table 8. The indexed reverse library PCR primers take the form:
5′-CAAGCAGAAGACGGCATACGAGATJJJJJJGTGACTGGAGTTCAGACGTGTG
Table 9.
Indexed reverse library PCR primers
| Index | No. | Oligo id | Oligo sequence |
|---|---|---|---|
| ATCACG | 1 | NI-799 | 5′-CAAGCAGAAGACGGCATACGAGATCGTGATGTGACTGGAGTTCAGACGTGTG |
| CGATGT | 2 | NI-822 | 5′-CAAGCAGAAGACGGCATACGAGATACATCGGTGACTGGAGTTCAGACGTGTG |
| TTAGGC | 3 | NI-823 | 5′-CAAGCAGAAGACGGCATACGAGATGCCTAAGTGACTGGAGTTCAGACGTGTG |
| TGACCA | 4 | NI-824 | 5′-CAAGCAGAAGACGGCATACGAGATTGGTCAGTGACTGGAGTTCAGACGTGTG |
| ACAGTG | 5 | NI-825 | 5′-CAAGCAGAAGACGGCATACGAGATCACTGTGTGACTGGAGTTCAGACGTGTG |
| GCCAAT | 6 | NI-826 | 5′-CAAGCAGAAGACGGCATACGAGATATTGGCGTGACTGGAGTTCAGACGTGTG |
| CAGATC | 7 | NA | 5′-CAAGCAGAAGACGGCATACGAGATGATCTGGTGACTGGAGTTCAGACGTGTG |
| ACTTGA | 8 | NA | 5′-CAAGCAGAAGACGGCATACGAGATTCAAGTGTGACTGGAGTTCAGACGTGTG |
| GATCAG | 9 | NA | 5′-CAAGCAGAAGACGGCATACGAGATCTGATCGTGACTGGAGTTCAGACGTGTG |
| TAGCTT | 10 | NA | 5′-CAAGCAGAAGACGGCATACGAGATAAGCTAGTGACTGGAGTTCAGACGTGTG |
| GGCTAC | 11 | NA | 5′-CAAGCAGAAGACGGCATACGAGATGTAGCCGTGACTGGAGTTCAGACGTGTG |
| CTTGTA | 12 | NA | 5′-CAAGCAGAAGACGGCATACGAGATTACAAGGTGACTGGAGTTCAGACGTGTG |
Where JJJJJJ indicates the reverse complement of the index sequence discovered during Illumina sequencing. For Illumina Index #1, (sequence ATCACG), use NI-799. Oligos without an id have been designed but not utilized.
4.3 Synthetic controls
These oligonucleotides are used at various points in the protocol to assess either the size or the concentration of the library being prepared. All synthetic controls contain the 26 nt control oligo sequence from NI-801 (see Section 4.2.1). Furthermore, each control contains a sample barcode different to those used by the linker oligonucleotides (see Table 8), allowing them to be distinguished from genuine footprinting samples after sequencing.
4.3.1 Post-ligation, NI-805, Index: CGATC
5′-rArUrGrUrUrArGrGrGrArUrArArCrArGrGrGrUrArArUrGrCrGrANNNNNCGATCTGATCGGAAGAGCACACGTCTGAArC
4.3.2 RT Product, NI-804, Index: GACTG
5′-/5Phos/NNAGATCGGAAGAGCGTCGTGTAGGGAAAGAG/iSp18/GTGACTGGAGTTCAGACGTGTGCTCTTCCGATCACAGTCNNNNNTCGCATTACCCTGTTATCCCTAACAT
4.3.3 Circularization Product, NI-803, Index: CATGC
5′-GTGACTGGAGTTCAGACGTGTGCTCTTCCGATCAGCATGNNNNNTCGCATTACCCTGTTATCCCTAACATNNAGATCGGAAGAGCGTCGTGTAGGGAAAGAG
5 The ribosome profiling protocol
5.1 Preparation of a cell lysate
5.1.1 Liquid cultures of the budding yeast Saccharomyces cerevisiae
5.1.1.1 Yeast cell harvesting
For each culture to be harvested, prepare an open 50 ml conical tube full of liquid nitrogen in a rack held in a bath of liquid nitrogen. Punch several holes in the cap of the conical tube with a needle and set it aside.
To rapidly harvest, filter the yeast from the culture onto a 0.45 µM Whatman membrane using a vacuum filter apparatus. We use the Kimble Kontes ULTRA-WARE microfiltration assembly with fritted Glass Support (see Table 1).
Immediately scrape the yeast from the filter with a straight-edge metal spatula and plunge it into the conical tube of liquid nitrogen. Use a second chilled metal spatula to dislodge the yeast from the straight-edge spatula. For ribosome profiling we routinely use 150 ml cultures of haploid yeast at an OD600 of 0.6 – 0.7. This volume of culture produces an excess of cell lysate, but is used because smaller cultures form a very thin layer on the filter, which is difficult to scrape off effectively.
Drip 2 ml of lysis buffer (see Section 4.1.2) into the liquid nitrogen. Adding the lysis buffer drip-wise is necessary so that frozen droplets are small enough to fit inside the mixer mill’s grinding jars. The working volume for the 10 ml grinding jars that we typically use for yeast lysis is 2 – 4 ml, but the grinding jars are available in different volumes.
Cap the tube and place it upright in a −80°C freezer until the liquid nitrogen evaporates (typically 30 minutes to an hour). Frozen yeast can be indefinitely at −80° C. Be sure to always use a pierced cap to close liquid nitrogen filled tubes!
5.1.1.2 Yeast cell lysis
For each culture, open a mixer mill grinding jar and chill all its components, including the grinding ball, in liquid nitrogen.
Add frozen yeast to the grinding jar, insert the grinding ball, and seal it tightly. Chill the assembled chamber in liquid nitrogen.
Loosen the grinding jar about one quarter turn, place it in the mixer mill, and grind yeast for 3 minutes at 15 Hz. Tighten the grinding jar and return it to liquid nitrogen. Repeat the grinding for 5 more cycles of 3 minutes each.
Chill the grinding jar, along with two rounded metal spatulas, in liquid nitrogen.
Partly fill an open conical tube with liquid nitrogen and place it upright in the liquid nitrogen bath. Open the grinding chamber and recover the powder into the conical tube of liquid nitrogen using the chilled metal spatulas, re-chilling them as needed.
If you are using a given cup to grind more than one sample, be sure to wash the cup thoroughly between samples to avoid cross-contamination.
Cap the tube of yeast lysate in liquid nitrogen using a pierced cap and place it upright in a −80°C freezer until the liquid nitrogen evaporates. Frozen yeast lysate can be stored indefinitely at −80°C.
Thaw the yeast lysate gently and immediately centrifuge the tube at 3000 × g, 4°C for 5 minutes and recover the supernatant into one or more non-stick RNase-free microfuge tubes. Further clarify the supernatant by spinning at 20000 × g, 4°C for 10 minutes and recover the supernatant, typically ~1.5 ml.
Take 50 µl aliquots of this yeast lysate and flash freeze by immersion in liquid nitrogen. This lysate can be stored indefinitely at −80°C. Yeast lysate prepared in this fashion is typically much more concentrated than an equivalent lysate prepared from cultured mammalian cells. Lysate prepared from 50 – 100 ml of yeast liquid culture at an OD600 of 0.6 – 0.7 will have 5 to 10-fold higher RNA concentration than lysate prepared from adherent cultured mammalian cells according in Section 5.1.2.
5.1.2 Adherent cultured mammalian cells
This portion of the protocol was developed using HEK293 cells (ATCC, CRL-1573). Optionally, an experimenter may wish to treat cells with inhibitors of translation before harvesting. Several authors have observed that treatment of cells with chemicals that inhibit initiation (harringtonine & lactimidomycin) results in the accumulation of ribosome footprints around the start codon, enabling the genome-wide identification of translation start sites [5,13,17,18]. We have seen good results with a 2 minute treatment with 2 µg/ml harringtonine in DMSO at 37°C [5,13]. A different approach is been taken by Qian and colleagues: either a 30 minute treatment with 50 µM lactimidomycin in DMSO at 37°C (termed GTI-seq [18]); or cell lysis in the presence of 5 µM lactimidomycin, followed by a puromycin treatment to remove non-initiating ribosomes (termed QTI-seq [17]).
Routine pre-treatment of cells with the elongation inhibitor cycloheximide before harvest is now thought to excessively skew the natural distribution of elongating ribosomes (Weinberg et al. [19] provides a thorough discussion of this issue). However, inhibition of elongation prior to cells lysis may still be desirable for specific experiments. We have found that a 1 minute treatment with 100 µg/ml cycloheximide in DMSO at 37°C is effective.
Aspirate media from one 10 cm dish of adherent cells. Place the dish on ice, gently wash with 5 ml ice-cold PBS, and aspirate the PBS thoroughly.
Perform in-dish lysis: drip 400 µl ice-cold lysis buffer (see Section 4.1.2) onto the cells, taking care to cover the entire surface of the dish.
Tip the dish and scrape cells down the slope into the lysis buffer pooled in the lower corner. Pipette lysis buffer from this pool back towards the top of the dish and scrape again down the slope of the dish.
Pipette the cells in lysis buffer and withdraw the entire contents of the dish to a microfuge tube on ice. Pipette several times to disperse cell clumps and incubate for 10 minutes on ice.
Triturate cells ten times through a 26 gauge needle.
Clarify the lysate by centrifugation for 10 minutes at 20000 × g, 4°C and recover the supernatant. If you are not proceeding directly to nuclease footprinting, flash freeze the lysate by immersion in liquid nitrogen, and store indefinitely at −80° C.
5.2 Nuclease footprinting and ribosome recovery
Nuclease digestion conditions have a large impact on the success of a ribosome profiling experiment. Experimenters should proceed with caution: the two commercial suppliers of E. coli RNase I use different unit definitions to measure RNase I activity, and substantial changes in the RNase activity during nuclease footprinting could compromise the experiment. Moreover, unpublished reports have suggested that optimizing digestion conditions (particularly, decreasing the amount of RNase I) on a case-by-case basis can often be advantageous. Indeed, empirically we have found that matching the RNA-to-RNase ratio controls better for footprint size than matching RNase concentration alone.
Before proceeding with nuclease footprinting a portion of the undigested cell lysate is reserved for the preparation of an RNA-seq library. We typically use Illumina’s Tru-seq protocol according to the manufacturer’s instructions, and employ an rRNA depletion step. This RNA-seq library provides estimates of mRNA abundance that are used for the calculation of translational efficiency (see Section 5.11.1).
Determine the RNA concentration of the cell lysate. We typically use the Quant-iT RiboGreen assay according to the manufacturer’s instructions, measuring blue fluorescence with a GloMax-Multi Jr Single Tube Multimode Reader and accompanying Fluorescence Optical Kit—BLUE (see Table 1). Cell lysates typically need to be diluted 1:100 – 1:10000 in order to be quantified using RNA standards in the range of 1 ng/µl – 20 pg/µl.
Take lysate containing 30 µg total RNA as determined in step 5.2.1 and dilute to 200 µl with polysome buffer (see Table 2). Add 1.5 µl RNase I (10 U/µl by the Epicentre definition) and incubate for 45 minutes at room temperature with gentle agitation.
Add 10 µl SUPERase*In RNase inhibitor to stop nuclease digestion, transfer the digestion to ice. Our experience has indicated that if the digestion is promptly cooled and spun, SUPERase*In addition isn’t necessary to stop the digestion.
Transfer the digestion to a 13 mm × 51 mm polycarbonate ultracentrifuge tube and underlay 0.9 ml sucrose cushion by carefully positioning a pipette tip (or a cannula or similar tool) at the very bottom of the tube and slowly dispensing the sucrose solution. The lysate should float on top of the sucrose, leaving a visible interface between the layers.
Pellet ribosomes by centrifugation in a TLA100.3 rotor at 100000 rpm, 4°C for 1 hr or 70000 rpm for 2 hr. The TLA110 (8-tube) rotor can also be used. Previous versions of the protocol used longer centrifugation times, however the conditions presented here are more than sufficient to pellet 80S particles. In performing sedimentation time calculations, scale by 4.3X for 34% sucrose and further 1.5X for 4°C versus 20°C.
Mark the outside edge of the ultracentrifuge tube, where the ribosome pellet will be found, before removing the tube from the rotor. Gently pipette the supernatant out of the tube. The ribosomal pellet is glassy and translucent, and may not be visible until the supernatant is removed. Resuspend the ribosomal pellet in 300 µl TRIzol reagent or equivalent.
Purify RNA from the resuspended ribosomal pellet using the Direct-zol kit according to the manufacturer’s instructions for purifying total RNA including small RNAs. Collect the eluate in a non-stick RNase-free tube. Critically, from this point until the end of the reverse transcription reaction, proper techniques must be employed to avoid RNase contamination. This includes the rigorous use of gloves and RNase-free reagents and consumables.
Precipitate RNA from the elution by adding 38.5 µl water, 1.5 µl GlycoBlue, and 10 µl 3M NaOAc pH 5.5, followed by 150 µl isopropanol. Chill precipitation for 1 hour on ice. Precipitations may be left overnight at −20°C.
Pellet RNA by centrifugation for 30 minutes at 20000 × g, 4°C in a tabletop microfuge. Carefully pipette all liquid from the tube, place it in a sideways microfuge tube rack, and allow it to air-dry for 10 minutes. Resuspend the RNA in 5 µl 10 mM Tris pH 8. RNA may be stored overnight at −20°C or for months at −80°C.
Table 2.
Polysome buffer recipe
| Component | Final concentration |
|---|---|
| Tris, pH 7.4 | 20 mM |
| NaCl | 150 mM |
| MgCl2 | 5 mM |
| DTT | 1 mM |
| Cycloheximide | 100 µg/ml |
5.3 Footprint fragment purification
Critically, the electrophoresis apparatus used for this and subsequent preparative RNA gels must be maintained free of RNase contamination. Decontaminate the tank and electrodes if the equipment has been used for other purposes. Molecular biology grade water obtained directly from the purifier can be tested for nuclease contamination and used to prepare running buffer due to the large volume of nuclease-free water needed for this purpose.
While ribosome footprints were initially characterized to be ~28 nt fragments, and this remains the modal footprint size, a class of so-called “small footprints” of ~20 nt were discovered by Lareau et al. in 2014 [20]. The current protocol has been modified to capture both small and large footprints, hence the recommended size range of 17 – 34 nt for excision from the footprint fragment purification gel. If only large footprints are desired, oligos NI-800 & NI-801 should be used as a guide to excise the region from 26 – 34 nt from the gel
Pre-run a 15% polyacrylamide TBE-Urea gel for 15 minutes at 200 V in 1X TBE.
Add 5 µl 2X denaturing sample loading buffer (see Table 3) to each RNA sample. Prepare a control oligo sample for two lanes consisting of: 1 µl lower marker oligo NI-800 10 µM, 1 µl upper marker oligo 10 µM, 8 µl 10 mM Tris pH 8, and 1 µl 2X denaturing sample loading buffer. Prepare a ladder sample with 0.5 µl 10 bp ladder 1 µg/µl, 4.5 µl 10 mM Tris pH 8, and 5 µl 2X denaturing sample loading buffer.
Denature samples for 90 seconds at 80°C, then load them onto the polyacrylamide gel. Load the control oligo sample on either side of the RNA samples. Additionally, in order to facilitate the isolation of the small footprints described by Lareau et al. [20], load 12 µl of NEB miRNA marker in similar positions.
Separate by electrophoresis for 65 minutes at 200 V.
Stain the gel for 3 minutes with 1X SYBR Gold in 1X TBE running buffer on a gentle shaker.
Visualize the gel; for each footprinting sample, excise the 17 nt – 34 nt region demarcated by the lower band of the miRNA marker and the upper size marker oligo (see Figure 2). This will result in the isolation of both large and small footprints. Place each excised gel slice in a clean non-stick RNase-free microfuge tube.
Extract RNA from the polyacrylamide gel slices. Add 400 µl RNA gel extraction buffer (see Table 4) and freeze samples for 30 minutes on dry ice.
Leave samples to thaw overnight at room temperature with gentle mixing on a nutator.
Briefly centrifuge gel extractions to collect the liquid at the bottom of the tube. Transfer the 400 µl eluate into a clean non-stick RNase-free microfuge tube.
Precipitate the extracted RNA by adding 1.5 µl GlycoBlue, mixing, and then adding 500 µl isopropanol. Precipitations may be left at −20°C overnight. Recover RNA as described in step 5.2.9.
Resuspend the size-selected RNA in 4 µl 10 mM Tris pH 8 and transfer to a clean non-stick RNase-free microfuge tube. RNA may be stored overnight at −20°C or indefinitely at −80°C.
Table 3.
2X Denaturing sample loading buffer recipe
| Component | Final concentration |
|---|---|
| Formamide | 98% v/v |
| EDTA | 10 mM |
| Bromophenol blue | 300 µg/ml |
Figure 2. Footprint fragment size-selection gel.
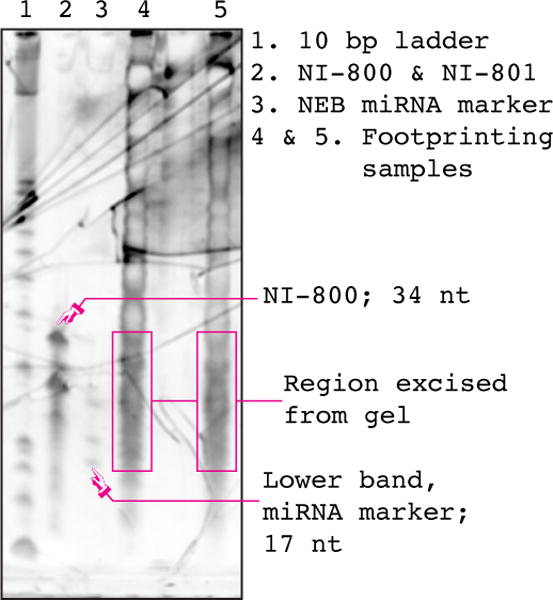
An image of a typical gel prepared according to Section 5.3. Footprinting samples were prepared from cultures of wild-type S. cerevisiae strain BY4742, as described in this protocol. NI-800 is used to determine the lower position on the gel to cut in order to isolate large (~28 nt) footprints. It is still routinely run, but has been made somewhat redundant by the discovery of small footprints and the use of the NEB miRNA marker.
Table 4.
RNA gel extraction buffer recipe
| Component | Final concentration |
|---|---|
| NaOAc pH 5.5 | 300 mM |
| EDTA | 1 mM |
| SDS | 0.25% v/v |
5.4 Footprint fragment dephosphorylation and linker ligation
Footprint RNA fragments are treated with T4 PNK in order to heal the 2′–3′ cyclic phosphate that results from RNase I cleavage, and thus prepare the fragments for ligation to a DNA linker with T4 Rnl2(tr) K227Q. It has recently come to our attention that a number of changes to the ligation reaction is likely increase the proportion of footprints that ligate to a linker. The careful optimization of small RNA ligation conditions described by Heyer et al. [21] indicates that the highest ligation efficiency might be achieved by increasing the concentration of PEG-800 to 25% w/v, increasing the reaction time to greater than 6 hours, and raising our reaction temperature to between 25°C – 30°C. However, these conditions await testing in the context of our protocol: while Heyer & Moore successfully apply their small RNA library preparation procedure to yeast ribosome profiling [22], the early stages of their protocol differs significantly from that described here, precluding easy comparison of the later steps involved in library preparation proper.
Prepare the dephosphorylation reaction as described in Table 10 and incubate for 1 hour at 37°C. It is important not to add ATP to the reaction, as T4 PNK stoichiometrically transfers 3′-phosphates to itself.
Prepare the linker ligation by adding the components described in Table 11 directly to the dephosphorylation reaction. Incubate the ligation reaction for 3 hours at 22°C. It is critical to use a pre-adenylated linker with a distinct sample barcode for each sample to be pooled. Based on our results using similar protocols, we estimate that >80% of RNA fragments become ligated to a linker.
To specifically deplete unligated linker from the ligation reaction before reverse transcription, add 0.5 µl Yeast 5′-deadenylase 10 U/µl and 0.5 µl RecJ exonuclease 10 U/µl (Epicentre definition) directly to the ligation reaction and incubate for 45 minutes at 30°C. The ligation products can also be isolated by PAGE, as described previously [13].
Table 10.
Composition of the T4 PNK end-healing reaction
| Component | Volume (µl) | Final |
|---|---|---|
| RNA sample | 3.5 | NA |
| T4 PNK Buffer (10X) | 0.5 | 1X |
| T4 PNK (10 U/µl) | 0.5 | 5 U |
| SUPERase*In | 0.5 | 10 U |
Table 11.
Composition of the linker ligation reaction
| Component | Volume (µl) | Final |
|---|---|---|
| 50% w/v PEG-8000 | 3.5 | 17.5% |
| 10X T4 RNA ligase buffer | 0.5 | 1X |
| Preadenylated linker (20 µM) | 0.5 | 1 µM |
| T4 Rnl2(tr) K227Q (200 U/µl) | 0.5 | 100 U |
Specific degradation of pre-adenylated linker is illustrated in Figure 3. Oligoribonucleotide size marker NI-801 (see Section 4.2.1) was ligated to a linker using T4 Rnl2 and then subjected to treatment with Yeast 5′ deadenylase and RecJ, or not. The results were resolved on a denaturing polyacylamide gel as described in Section 5.3. Figure 3 clearly shows that formation of a ligated product is dependent on T4 Rnl2, linker pre-adenylation and the presence of a 3′ hydroxide group on NI-801, as expected.
Figure 3. Specific degradation of pre-adenylated linker by combined treatment with Yeast 5′ deadenylase and RecJ.
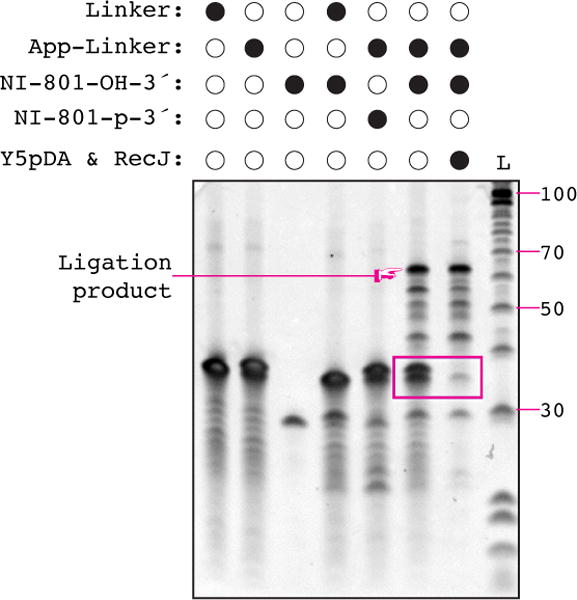
The presence of a reaction component is indicated by a filled circle, the absence of a component by a empty circle. Y5pDA – Yeast 5′ deadenylase. L – 10 bp ladder. The 100 nt band and selected other bands of the 10 bp ladder is indicated on the right-hand side of the gel. Ligated product is indicated. The effect of Yeast 5′ deadenylase and RecJ treatment on the pre-adenylated linker band is indicated by the box.
When ligated product is treated with Yeast 5′ deadenylase and RecJ there is a drastic reduction in the pre-adenylated linker band, but the intensity of the ligation product band is not affected.
5.4.1 Pooling and purification of ligations
Purify ligations on an Oligo Clean & Concentrator column, which is necessary to recover sequences of this length. Before purification, one may pool ligations with different sample barcodes in order to multiplex those samples for sequencing.
Each sample to be pooled will contribute 11 µl volume. Calculate the total volume of the pool as 11µl × the number of samples.
Take Oligo Binding Buffer equal to twice the total sample volume and add the samples to be pooled, along with any supplementary water, into the binding buffer. For example, with six samples (66 µl) use 132 µl Oligo Binding Buffer. Mixing samples in the denaturing oligo binding buffer likely guards against any cross-sample ligation by undigested linkers and residual ligase activity.
Add ethanol equal to 8 times the total sample volume. For example, with six samples (66 µl total sample volume) use 528 µl ethanol.
Load samples onto the Zymo Spin-Column nested in a collection tube. Load no more than 800 µl (corresponding to 8 samples) at once — repeat loading and spinning if the total volume exceeds 800 µl at this point.
Centrifuge the column for 30 seconds at 12000 × g and discard the flow-through.
Add 750 µl DNA Wash Buffer, centrifuge the column for 30 seconds at 12000 × g, and discard the flow-through.
Centrifuge again (with no wash) for 1 minute at maximum speed to remove any residual wash buffer.
Transfer the Zymo-Spin Column into a new microcentrifuge tube and add 26 µl RNase-free water. Centrifuge for 30 seconds at 12000 × g and recover RNA in the eluted liquid. N.B. If no rRNA depletion will be performed, elute directly in 10 µl RNase-free water and proceed to reverse transcription (Section 5.6). Otherwise, RNA may be stored overnight at −20°C, or indefinitely at −80°C.
5.5 Ribosomal RNA depletion
Perform Ribo-Zero Gold depletion on the purified linker-ligated footprint fragments from step 5.4.1.8 according to the manufacturer’s protocol, using the larger volume of rRNA Removal Solution (suitable for up to 5 µg of total RNA). Omit the 50°C incubation immediately prior to bead removal: advice from Illumina is that the rRNA fragments present after nuclease footprinting are quite short, and the 50°C incubation is too stringent for efficient depletion. Recover RNA using an Oligo Clean & Concentrator column according to the manufacturer’s instructions, eluting the purified RNA in 10 µl RNase-free water at the final step. The ligated footprint fragments are quite short and thus the depleted RNA must be recovered by an approach that captures small RNAs, such as the Oligo Clean & Concentrator column. RNA may be stored at −20°C overnight or indefinitely at −80°C.
We are aware that many authors find a significant proportion of their ribosome profiling library to consist of rRNA derived sequences, even when some form of rRNA reduction is employed. Anecdotally, we see greater persistence of rRNA sequences in situations where rRNA depletion reagents are older, where there is more starting material, and where RNase I digestion might have been more severe. This might suggest some combination of greater damage to the ribosome producing more smaller rRNA fragments that either overwhelm the rRNA depletion reagents, or escape them all together. This conjecture is consistent with the results of Gerashchenko & Gladyshev [23], but systematic studies of these parameters are lacking. We have heard discussion of authors planning hybrid approaches: first employing commercial rRNA depletion reagents, and then using subtractive hybridization to target particular problem fragments. Indeed, this could be achieved using the biotinylated rRNA depletion oligos described in Ingolia et al. (2012) [13]. An interesting alternative approach is suggested by Faridani et al., who employed a masking oligo to prevent linker ligation to the abundant 5.8S rRNA [24].
5.6 Reverse transcription
1. In order to assess the performance of your reverse transcription reaction, prepare three control samples: 1. a positive control containing 10 µl of ligation control oligo (NI-805) at 100 nM, diluted from a 1 µM stock in 10 mM Tris pH 8; 2. a no-insert control containing 10 µl of a linker at 100 nM; 3. a no-template control containing 10 µl 10 mM Tris pH 8.
2. Add 2 µl reverse transcription primer (NI-802) at 1.25 µM to all samples and controls. Denature for 5 minutes at 65°C in a thermal cycler and then place on ice. Cool the thermal cycler to 50°C.
3. Set up the reverse transcription reaction tabulated in Table 12 and incubate for 30 minutes at 50°C in the thermal cycler:
Table 12.
Composition of the reverse transcription reaction
| Component | Volume (µl) | Final |
|---|---|---|
| RNA sample & primer | 12 | NA |
| 5X Protoscript II buffer | 4 | 1X |
| dNTPs | 10 mM ea. | 1 |
| 0.1 M DTT | 1 | 5 mM |
| SUPERase*In (20 U/µl) | 1 | 20 U |
| Protoscript II (200 U/µl) | 1 | 20 U |
We have observed that the yield of full-length RT product appears constant between 47°C and 54°C in this reaction, but the activity of untemplated nucleotide addition disappears at 50°C (see Figure 4). However, when using SuperScript III, untemplated nucleotide addition persists through 52°C but is lost at 55° C; and reverse transcription yield did not decline at 57° C, the highest temperature tested. We recommend performing reverse transcription at 55°C when using SuperScript III.
Figure 4. Hotter reverse transcription reduces untemplated extension without reducing yield.
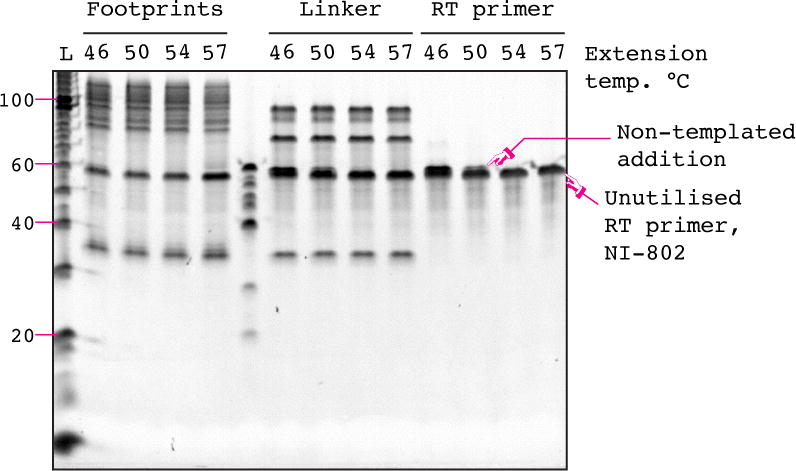
Reverse transcription of ligated footprints (left), linker only (middle), or RT primer alone (right) with Protoscript II at temperatures ranging from 46°C – 57°C. Reaction were resolved by polyacrylamide gel electrophoresis as described in Section 5.3. An example of non-templated addition to the reverse transcription (RT) primer is indicated. L – 10 bp ladder, the 100 nt band and selected other bands are indicated on the left-hand side of the gel.
3. Hydrolyze the RNA template by adding 2.2 µl 1 M NaOH to each reaction and incubating at 70°C for 20 minutes.
4. Add 28 µl water to the reverse transcription reaction, bringing the volume to 50 µl, and purify the sample using an Oligo Clean & Concentrator according to the manufacturer’s instructions, except performing the final elution in 6 µl nuclease-free water.
5. Separate the reverse transcription products from the unextended primer and no-insert background products by polyacrylamide gel electrophoresis as described in Section 5.3, using 6 µl 2X denaturing sample loading buffer with each 6 µl reverse transcription product. Omit the preparation of marker oligo samples and instead prepare one sample containing 2 µl reverse transcription primer at 1.25 µM, 3 µl 10 mM Tris pH 8, and 5 µl 2X denaturing sample loading buffer.
6. Excise the reverse transcription product bands from the gel and place each in a clean non-stick RNase-free microfuge tube. A typical gel is shown in Figure 5. The reverse transcription primer is 57 nt long (evident from the no-template control, or the reverse transcription primer only sample, see Figure 5, lanes 1 & 2), the no-insert reverse transcription product is 76 nt long (evident from the no-insert control comprising only the linker, see Figure 5, lane 3), and the full-length reverse transcription product is ~105 nt long (the centre of mass of the sample reverse transcription product should migrate at the same size at the ligation control, NI-805, compare Figure 5, lanes 5 & 6). The DNA linker is not hydrolyzed by NaOH treatment and most of it migrates as a free ~35 nt band (see Figure 5, lanes 4, 5 & 6). A small fraction remains hybridized to the RT product, leading to a faint super-shifted product band. Excise all cDNA migrating substantially above the major no-insert reverse transcription product. Skip excision of any products from the negative control reverse transcription samples (no-insert and no-template) and from the unreacted primer sample.
7. Extract the cDNA from the polyacrylamide gel according to the gel extraction protocol in Section 5.3. Note that it is no longer necessary to use RNase-free reagents, though non-stick tubes are still required. Furthermore, overnight extraction should be performed in the DNA gel extraction buffer (see Table 5) rather than the RNA gel extraction buffer.
8. Precipitate cDNA by adding 1.5 µl GlycoBlue, mixing, and then adding 500 µl isopropanol. Precipitations may be left at −20°C overnight. Recover DNA as described in step 5.2.9.
Figure 5. cDNA size-selection gel.
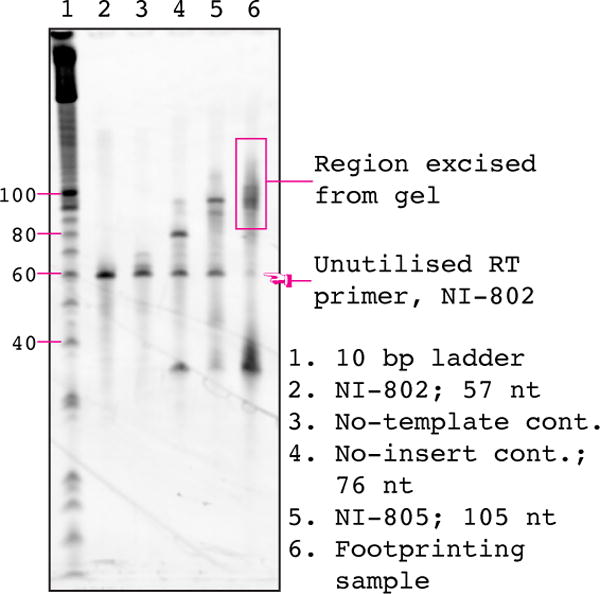
An image of a typical cDNA size-selection gel prepared according to Section 5.6. In order to capture the greatest diversity of sequences we routinely cut just above the no-insert control (lane 3) to somewhat above the positive control (NI-805, lane 5). The efficiency of the reverse transcription can be judged the amount of unutilized primer (NI-802) in the footprinting sample (lane 6). Selected bands from the 10 bp ladder are indicated on the left-hand side of the gel.
Table 5.
DNA gel extraction buffer recipe
| Component | Final concentration |
|---|---|
| NaCl | 300 mM |
| Tris pH 8 | 10 mM |
| EDTA | 1 mM |
5.7 Circularization of cDNA
While we routinely employ CircLigase II to circularize the single-stranded cDNA that results from reverse transcription, it has recently come to our attention that CircLigase I may be a better choice. Heyer et al. demonstrated that CircLigase I has a greater circularization efficiency on the reverse transcription product of a 24 nucleotide oligonucleotide of random sequence [21]. Moreover, Heyer et al.’s data suggest that circularization is more complete after a two hour incubation. These variables, however, await testing in the context of this protocol.
Resuspend cDNA in 12 µl 10 mM Tris pH 8 and transfer to a PCR tube. Optionally, set up an additional control reaction containing 1 µl RT product control oligo (NI-804) at 1 µM plus 11 µl 10 mM Tris, pH 8. At this point cDNA may be stored indefinitely at −20°C.
Prepare the circularization reaction outlined in Table 13 and incubate for 1 hr at 60°C in a thermal cycler; then heat-inactivate the enzyme with a 10 minute incubation at 80°C. At this point targeted depletion of rRNA derived cDNA can be performed as described in Ingolia et al. (2012) [13]. Circularized DNA may then be stored in the circularization reaction buffer indefinitely at −20°C.
Table 13.
Composition of the circularization reaction
| Component | Volume (µl) | Final |
|---|---|---|
| cDNA | 12 | NA |
| 10X CircLigase II buffer | 2 | 1X |
| 5 M Betaine | 4 | 1 M |
| 50 mM MnCl2 | 1 | 2.5 mM |
| CircLigase II (100 U/µl) | 1 | 100 U |
5.8 qPCR quantitation of circularized cDNA
qPCR quantitation of circularization reactions is used to determine the optimal conditions (amount of circularized template and number of cycles) for a single library construction PCR.
Prepare a dilution series of the NI-803 positive control. Prepare a 10 nM working solution by diluting 2 µl of a 1 µM stock solution in 198 µl 10 mM Tris, pH 8. Dilute 10.2 µl of the 10 nM working solution with 89.8 µl 10 mM Tris, pH 8 to construct a 1.02 nM stock solution. Serially dilute 2 µl of this stock into 6 µl of 10 mM Tris, pH 8 to prepare a 1:4 dilution (256 pM), a 1:16 dilution (64 pM), a 1:64 dilution (16 pM), and a 1:256 dilution (4 pM).
Determine the number of qPCR reactions. This should include one for each point on the standard curve, as well as two blanks (one using nuclease-free water and one using 10 mM Tris, pH 8), two NI-804 negative controls (with 1 nM template), and two replicates of each circularization reaction (diluted up to 10-fold for samples expected to be high-concentration). One can also include replicates of circularization reactions performed on NI-804, in order to assess the efficiency of circularization. Multiply the number of qPCR reactions by 20 µl, and then add an extra 10%. Prepare the common qPCR mixture according to the Table 14.
For each reaction, combine 19 µl of qPCR mix with 1 µl template.
Perform qPCR amplification using the following cycling conditions: 15 minutes at 95° C, followed by 40 cycles of 10 seconds at 94°C, 20 seconds at 54°C, 30 seconds at 72°C, and plate reading. Follow the PCR amplification with a melt curve analysis.
Fit a standard curve to the Cq values for the NI-803 dilution series. The 1.02 nM sample should have a Cq of roughly 8. Verify that the NI-804 negative control and the blank reactions have Cq values much higher than the standard curve or library circularization samples. The NI-804 negative control will likely show a Cq value corresponding to ~1 pM, with a broad melt curve.
Determine the template concentration in the circularization reactions using the standard curve from the NI-803 dilution series. Select the amount of template and the number of cycles for the library construction PCR. The template concentrations in Table 15 give the final concentration of circles in a 50 µl PCR. For example, if the input circles are present at 700 pM, then 2.3 µl circles in a 50 µl PCR will give 32 pM of template for a 12-cycle amplification. Ensure that the template comprises no more than 10% of the final PCR reaction, ideally no more than 5%. This strategy ensures that the primer concentration remains greater than 10 times the concentration of extended PCR product, and thus that in later cycles primer annealing and extension predominates over re-annealing of the two template strands. The cycle numbers given in Table 15 derive from empirical calibration of qPCR-quantified input template with the appearance of the unwanted, re-annealed duplexes in the final gel.
Table 14.
Composition of the qPCR reaction
| Component | Volume per 100 µl (µl) | Final (after template) |
|---|---|---|
| 2X qPCR Master Mix | 50.0 | 1X |
| 100 µM NI-827 | 0.5 | 500 nM |
| 100 µM NI-828 | 0.5 | 500 nM |
| Nuclease free water | 44.0 | NA |
Table 15.
PCR cycles required to amplify given concentrations of circular library cDNA
| Template concentration | Cycles |
|---|---|
| 800 pM | 7 |
| 400 pM | 8 |
| 200 pM | 9 |
| 100 pM | 10 |
| 50 pM | 11 |
| 25 pM | 12 |
| 12.5 pM | 13 |
| 6.3 pM | 14 |
| 3.1 pM | 15 |
| 1.6 pM | 16 |
5.9 Library construction PCR
For each sample pool, prepare a 50 µl PCR according to Table 16. Use a different reverse indexing primer for each sample pool that will be combined into a single sequencing lane. Prepare a positive control reaction using synthetic control oligo NI-803, diluted from the 10 nM stock to achieve the same template concentration as the actual circularization reactions. The forward primer is NI-798. Reverse primers are NI-799, 822–826 (see Section 4.2.5).
Perform PCR amplification with an initial denaturation for 30 seconds at 98°C followed by 7 – 16 cycles (see Section 5.8) of 10 seconds denaturation at 98°C, 10 seconds annealing at 65°C, and 5 seconds extension at 72°C. Finish with a 5 minute extension at 72°C.
Purify PCR products using a DNA clean & concentrator column according to the manufacturer’s instructions. Use a 5 : 1 ratio of DNA binding buffer to sample, that is, 250 µl of DNA binding buffer for a 50 µl PCR. Elute into 25 µl 10 mM Tris, pH 8.
Add 5 µl 6X non-denaturing sample loading buffer to each reaction (see Table 6). Prepare a ladder sample with 1 µl 10 bp ladder, 11.5 µl 10 mM Tris pH 8, and 2.5 µl 6X non-denaturing sample loading buffer.
Set up a pre-cast 8% polyacrylamide non-denaturing gel. Load two adjacent wells with 15 µl each of the purified PCR samples, as well as loading one well with 15 µl 10 bp ladder.
Separate PCR reactions by electrophoresis in 1X TBE running buffer for 40 minutes at 180 V. Stain the gel for 3 minutes in 1X SYBR Gold in 1X TBE gel running buffer.
Visualize the gel and excise the amplified PCR product; a typical gel is show in Figure 6. Full-length libraries are ~160 bp long, whereas no-insert products are 136 bp long and unextended RT primer products are 117 bp long. Avoid the lower part of the product band, which is derived from unextended reverse transcription primer. Place excised gel slices in clean, non-stick microfuge tubes.
Recover DNA from the gel slices as described in Section 5.3. It is particularly important that the gel extractions remain at 25°C or below to avoid the formation of re-annealed partial duplexes. Such duplexes will complicate the quantitation of the library. Precipitations may be stored indefinitely at −20°C.
Resuspend the library DNA in 15 µl 10 mM Tris pH 8. Double-stranded DNA may be stored indefinitely at 4°C or at −20°C.
Table 16.
Composition of the library construction PCR reaction
| Component | Amount per run (µl) | Final |
|---|---|---|
| 5X Phusion HF buffer | 10 | 1X |
| dNTPs 10 mM ea. | 1 | 0.2 mM ea. |
| 10 µM Forward Primer | 2.5 | 500 nM |
| 10 µM Reverse Primer | 2.5 | 500 nM |
| Circularized cDNA template | see above | 1 – 256 pM |
| Nuclease free water | q.s. to 49.5 µl | NA |
| Phusion polymerase (2 U/µl) | 0.5 | 1 U |
Table 6.
6X Non-denaturing sample loading buffer recipe
| Component | Final concentration |
|---|---|
| Tris pH 8 | 10 mM |
| EDTA | 1 mM |
| Ficoll 400 | 15% w/v |
| Bromophenol blue | 0.25% w/v |
Figure 6. Library construction PCR gel.
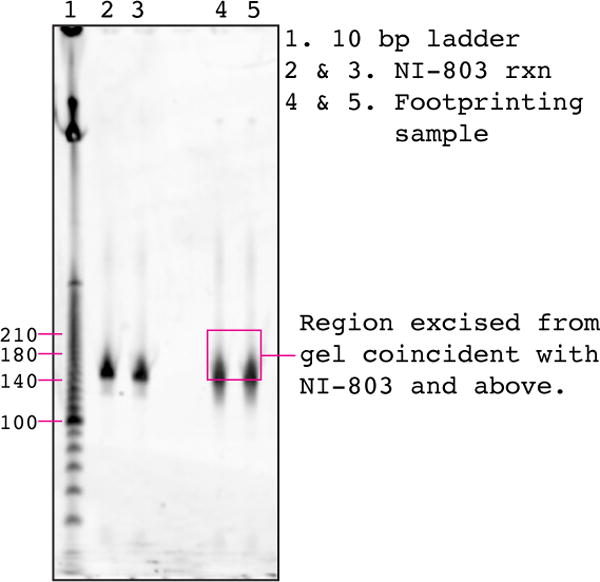
As outlined in Section 5.9, each sample is loaded across two lanes of the gel. Note the downwards smear in lanes 4 & 5 that is absent from lanes 2 & 3, below the pink box denoting the area of the gel that was excised for purification of the full-length library. This smear likely represents no-insert product and unelongated reverse transcription primer that has persisted through the cDNA size-selection gel. The size (nucleotides)of several bands from the 10 bp ladder are indicated on the left-hand side of the gel.
5.10 Library length distribution analysis using the Agilent 2200 TapeStation Nucleic Acid System
The final step before high-throughput sequencing is an analysis of the length distribution and concentration of the constructed library. For this purpose we routinely use a High Sensitivity D1000 ScreenTape run on the Agilent 2200 TapeStation (see Table 1.). A typical electropherogram for a ribosome profiling library is illustrated in Figure 7. As described in Section 5.9, based on a large footprint size of ~28 nt we expect the modal length of a ribosome profiling library to be ~160 bp, and no-insert products to be ~136 bp long. Note that the specified sizing resolution of the TapeStation is 10%. In experiments where we have isolated both large and small footprints, we have not seen libraries with bimodal size distributions. Presumably, this is due to the number of non-footprint sequences in the libraries.
Figure 7. Library length distribution analysis using the Agilent 2200 TapeStation.
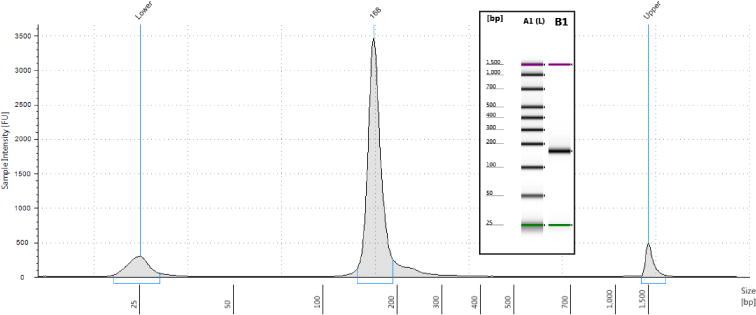
An electropherogram image of the length distribution of the ribosome profiling library generated by the TapeStation analysis software. Note the single major peak at 168 bp, within the range of what we typically expect for a ribosome profiling library. The small proportion of larger sequences, and the absence of a discernable no-insert product peak are also fairly typical. Insert: The false gel image generated from the same sample.
With the length distribution and concentration confirmed, ribosome profiling libraries can be submitted for sequencing at one’s preferred provider of Illumina platform high-throughput sequencing. We routinely sequence ribosome profiling libraries with a single-end 50 bp sequencing run; we have found that for a small-to-moderate number of multiplexed yeast samples (2 – 5), a MiSeq run can often provide sufficient coverage to appreciate the most salient differences between samples. However, greater sequencing depth is always advantageous, and can often be necessary to unambiguously assess all the subtleties of ribosome distribution.
5.11 Bioinformatic analysis of ribosome profiling libraries
Analysis of the resulting sequence data is the most open-ended portion of the ribosome profiling protocol, no least because it can depend heavily on the aims of the experiment one is undertaking. There are a large number of programs, and indeed programming languages, available for the handling of high-throughput short-read sequencing data. In subsequent paragraphs we describe in general terms our typical approach to data analysis, but we can imagine a variety of different approaches that would yield equivalent results.
The starting point is a FASTQ file containing the sequence data from one ribosome profiling library comprising a pool of samples barcoded by the use of linkers with distinct sample barcodes (see Section 4.2.2 and Fig. 1). We begin by removing the constant sequence of our linker: AGATCGGAAGAGCAC. Simultaneously, we remove sequences of low quality; sequences that less than six nucleotides in length; or that comprise only the constant linker sequence. Typical numbers of such reads for a MiSeq sequenced library can be seen in Table 17. An extended UMI is then constructed from the two random nucleotides introduced by circularization from the reverse transcription primer NI-802, and the five random nucleotides contained within the variable portion of our linker (see Section 4.2 and Fig. 1). In analysing the composition of the UMI, we have found that there is often a preference for A & G in the 5′ N of NI-802, the nucleotide that becomes ligated to the 3′ end of the cDNA footprint during circularization. The absence of a discernable correlation between the identity of this nucleotide and that of the footprint nucleotide it becomes ligated to suggests that changing the NN at the 5′ end of NI-802 to RN may make circularization more efficient. Lastly, sequences are assigned to new FASTQ files based on the sample barcode in their linker, and discarded if this barcode is unspecified, or cannot be determined. Typical results of such splitting for a library comprising five samples is illustrated in Table 18.
Table 17.
Initial read processing fates for a MiSeq sequenced ribosome profiling library
| Fate | No. reads |
|---|---|
| Input | 13036528 |
| Too short | 3951 |
| Linker only | 5604 |
| Low quality | 331731 |
| N only | 0 |
| Output | 12695242 |
Table 18.
Read fates after splitting on sample barcode
| Barcode | No. reads | % total |
|---|---|---|
| Unknown | 532995 | 4.20 |
| ATCGT | 3192779 | 25.15 |
| AGCTA | 2218803 | 17.48 |
| CGTAA | 1961705 | 15.45 |
| CTAGA | 2863123 | 22.55 |
| GATCA | 1844210 | 14.53 |
| short | 81627 | 0.64 |
Each sample specific FASTQ file is then aligned against a variety of ncRNA sequences (e.g. rRNAs, snoRNAs, snRNAs etc.) using Bowtie2 [25]; sequences that align are removed. The majority of these ncRNA-aligning sequences align to rRNAs. Indeed, in the absence of rRNA depletion, most of the sequences in the library will align to rRNA. When rRNA depletion is effective, we have found that the proportion of sequences that align to rRNA depends on the biological source the cell lysate used for footprinting. In our hands, libraries constructed from cultured mammalian cells typically contain ~30% rRNA-aligning sequences after effective rRNA reduction, while libraries constructed from cultures of S. cerevisiae typically contain as much as ~70% rRNA-aligning sequences. However, these proportions can vary widely (see Section 5.5).
The remaining sequences, that do not align to ncRNAs, are then aligned against the transcriptome of interest using Tophat2 [26]. From these alignments, those that are of the desired quality are extracted for further analysis. At this point we utilize the extended UMI to remove sequences that are likely to represent duplicates generated by the library construction PCR – when multiple sequences with the same alignment share the same extended UMI, one sequence is selected arbitrarily, and the others discarded. The number of fragments with each of these alignment fates is outlined in Table 19. A number of important points are evident: first that rRNA reduction worked poorly in this particular experiment, but enough useful alignments remain to draw useful conclusions about the library. Secondly, that the rate of sequence duplication by the library construction PCR is low. After this filtering the sequence alignments for useful fragments are stored in indexed, sorted BAM files, which can be browsed manually by the Integrative Genomics Viewer (IGV, [27,28]), if desired.
Table 19.
Footprint fragment count by alignment fate
| Barcode | ncRNA | Unmapped | Aligning appropriately | PCR duplicates | Useful fragments |
|---|---|---|---|---|---|
| ATCGT | 2969692 | 27314 | 52220 | 114 | 142330 |
| AGCTA | 2070897 | 14391 | 34557 | 80 | 98340 |
| CGTAA | 1868613 | 11075 | 21435 | 52 | 60213 |
| CTAGA | 2739521 | 19530 | 27942 | 52 | 75753 |
| GATCA | 1670136 | 14727 | 44719 | 122 | 113650 |
Our procedure now becomes increasingly specific to ribosome profiling. A desired length interval (typically 16 – 36 bp for libraries that include small footprints) of the filtered alignments are intersected with BED file based annotation for protein-coding transcripts from the organism of interest. We can then examine the frequency distribution of alignment lengths, and meta-gene profiles of the areas around start and stop codons. Such analyses determine whether the aligned fragments meet our expectations for ribosome footprints. An example of such an analysis for the sample barcoded ATCGT is shown in Figure 8. This sample was prepared from wild-type S. cerevisiae BY4742 grown to OD600 0.6 in YEPD. Despite the relatively low number of fragments considered, the frequency distribution of fragment lengths shows the expected major peak at ~28 nt, representing large footprints, and a smaller peak at ~20 nt, representing small footprints (Figure 8A). Examining the distribution of fragment 5′ ends around start codons (Figure 8B), one can appreciate the enrichment of fragments at the start codon by the large peak ~12 nt upstream. We can also observe the expected enrichment of fragments within the ORF compared to the 5′ UTR, and the three nucleotide periodicity in frame preference. The heatmap in Figure 8C breaks down the picture from Figure 8B by fragment length, illustrating the clear dependence of periodicity on fragment length. The same picture for the region around the stop codon is shown in figure 8D. Both Figures 8C & D illustrate interesting enrichments in certain fragment lengths over start and stop codons.
Figure 8. Characteristics of ribosome footprints.
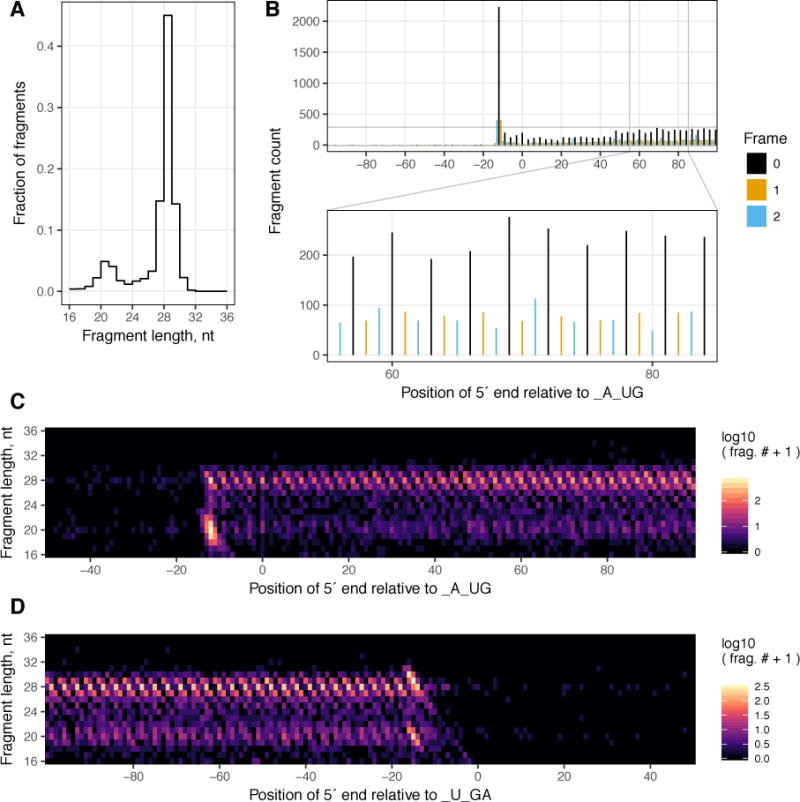
All panels are based on the analysis of a single sample from the described library (barcode ATCGT), prepared from wild-type S. cerevisiae BY4742 grown to OD600 0.6 in YEPD. A The frequency distribution of fragment lengths between 16 – 36 nucleotides (nt). B A meta-gene plot of fragments of all lengths whose 5′ end aligns within 100 nt of the start codon. The height of each bar represents the number of fragment 5′ ends aligning to a given nucleotide position. The color of the bar represents the frame of that nucleotide relative to the A in the AUG start codon. The lower panel illustrates the portion 55 – 85 nt after the start codon with greater resolution. C & D are heatmaps illustrating the log10 of the number of fragment 5′ ends (after the addition of a pseudo count of 1) of each fragment length at each nucleotide around the start codon (C) and stop codon (D).
To measure the degree to which a transcript is translated we count the number of footprints aligning to the central portion of the ORF, by convention 15 codons from the start codon until 5 codons before the stop codon. We focus on this area of the ORF because the ribosomes there are the most likely to be undergoing elongation, and therefore their frequency should reflect the translational capacity of the transcript rather than the kinetics of initiation and termination. In addition, we impose two further conditions to increase the likelihood we are counting genuine footprints: first, we only count fragments of lengths that represent > 5% of total fragments. Secondly, in order to determine whether fragments spanning the boundary between the central ORF and the areas around the start & stop codons should be counted, we determine for each fragment the likely location of the ribosomal A-site – the site of aminoacyl-tRNA decoding. If the fragment’s inferred A-site is within the central portion of the ORF, the fragment is judged to be the footprint of a ribosome undergoing elongation, and thus counted. The offset between the 5′ end of the fragment and the ribosomal A-site is inferred for each fragment length representing > 5% of total fragments by examining the frame bias of fragments of that length at the start codon. Presuming variance in the digestion pattern of the 3′ end of the footprint is rare [20], the location of the A-site of a fragment over the start codon can be known with great confidence, as many lines of evidence indicate that initiating ribosomes contain the AUG start codon within their P-site.
5.11.1 Ribosome profiling specific software
Besides the constant development of new software for the handling and quantification of short-read sequencing data, a number of ribosome profiling specific software tools have emerged. Many researchers are interested in being able to determine which transcripts are differentially translated between two or more conditions. This requires that we also take into account any changes in the mRNA level (typically measured by RNA-seq from the same sample), which will also effect the number of ribosome footprints obtained from a transcript. While we routinely utilise the R library DESeq2 [29] for this task, three groups have developed specific statistical models to call differential translation taking into account data from both ribosome profiling and RNA-seq measurements: anota [30], RiboDiff [31] & Xtail [32].
In attempting to determine which transcripts are being differentially translated between two or more conditions, ribosome profiling suffers from the same analytical problems that afflict all genome-wide measurements. Of particular note are the assumptions that underlie between-sample normalization of sequencing depth: that the per-cell amount of material isolated from each sample is approximately the same, that the majority of genes do not change in expression, and that the proportion of genes that are up-regulated and the proportion that are down-regulated are approximately equal [33–35]. In situations where we observe global unidirectional changes in expression, such as treatments that cause a global decrease in translation, these assumptions lead to inaccurate quantification [33–35]. This problem can be remedied by the use of a spike-in control, a strategy that has received considerable attention in the development of RNA-seq [36]. A known amount of a synthetic RNA is included early in library preparation; the signal from this synthetic RNA is then used to normalize the signal between samples. To date, this approach is evident in only a limited number of ribosome profiling studies, each of which use a different spike-in control: Han et al. (2012) used a single synthetic 28 nt RNA sequence [37], while Popa et al. fragmented a longer synthetic RNA to an average length of 30 nt [38]. An alternative approach was taken by Iwasaki et al. (2016), who normalized expression using the sum of the fragments aligning to mitochondrial transcripts. Mitochondrial transcripts are translated by a distinct mitoribosome, which is also captured by the ribosome profiling protocol [39]. Translation by the mitoribosome is not effected by the translation inhibitor rocaglamide A, which enabled Iwaskaki et al. to employ this normalization strategy to examine the determinants of the global decrease in translation caused by rocaglamide A [10]. In contrast to RNA-seq, we are not aware of any systematic examination of the relative merits of different spike-in controls for ribosome profiling.
Besides those aimed at differential expression analyses, a diverse set of other software tools exist for ribosome profiling. They each provide a different series of methods for dealing with ribosome profiling data more generally – including tasks such as the alignment & counting footprints, and the derivation of summary statistics such as the frequency distribution of footprint lengths and genome-wide codon occupancy. Spread across computing platforms, they include two R packages (riboSeqR [40] & RiboProfiling [41]), a Galaxy based webserver (RiboGalaxy [42]), a Python library (Plastid [43]), and stand-alone software (Ribomap [44]). Lastly, two software tools seek rigorous methods to identify translated RNA sequences using ribosome profiling data: RiboTaper employs a spectral analysis of ribosome profiling data to provide identification of translated ORFs based on the three-nucleotide periodicity observed in ribosome footprints [45,46], whereas Rfoot rather does the opposite: using the absence of three-nucleotide periodicity to identify footprints generated from the protection afforded by non-ribosomal RNPs to ncRNAs (sequences which are typically discarded in the analysis of ribosome profiling libraries), and mRNA 3′ UTRs [47].
6 Conclusions
In conclusion, ribosome profiling gives us unprecedented power to explore not only the mechanisms of translation, but also its regulation in vivo. As one might expect from something of such interest and complexity, the ribosome profiling protocol is under constant development, both in our laboratory and others. Here we have outlined the current state of our ribosome profiling protocol, noting improvements we have made since the publication of Ingolia et al. (2012) [13], and illustrating its ability to produce a library that shows all the characteristics of ribosome footprints.
Ribosome profiling is not without its limitations. Perhaps its most fundamental of which is that the snap-shot of transcriptome-wide ribosome location it provides is by definition static. As a result we cannot differentiate a translating ribosome from a static ribosome in a single sample. To some extent, this limitation can be circumvented by multi-sample experiments: for example, the progressive depletion of footprints from ORFs, and their concurrent accumulation around start codons, observed during a timecourse of harringtonine treatment in mammalian cells [5,48].
As we have alluded to, many other authors have adopted the ribosome profiling procedure and developed it for their own purposes. These developments range broadly from changes necessary to apply the method to other organisms, to the enzymology of library preparation, to fundamental changes in the method of ribosome isolation. In subsequent paragraphs, we aim to summarize these innovations, presenting the choices and challenges they offer to a newcomer to the procedure.
Depending on the experiment in question, choice of nuclease may be a pertinent issue. The protocol outlined in this article focuses on the digestion of lysates made from S. cerevisiae cultures and adherent mammalian cell-lines with RNase I. RNase I was initially chosen because of its robust activity in S. cerevisiae cell lysates, and its lack of a discernible nucleotide preference for digestion, but other nucleases can also be used. In particular, due to the inactivity of RNase I in E. coli lysates, micrococcal nuclease is commonly used in E. coli ribosome profiling experiments [49–51]. Micrococcal nuclease has also be utilized in the ribosome profiling of Drosophila melanogaster derived samples. While Drosophila profiling libraries have been made using RNase I [52], Drosophila ribosomes are highly sensitive to damage by RNase I, and micrococcal nuclease has worked better for some authors [53]. Of particular interest in this regard is a recent study by Gerashchenko & Gladyshev [23], who examine the use of several different nucleases to produce ribosome profiling libraries from several different species. Gerashchenko & Gladyshev observe that while the number of footprints aligning to a given gene is correlates well between libraries constructed using different nucleases, the footprint distributions along a given mRNA are quite different. They suggest that both the identity and amount of nuclease should be optimized based on the species under examination. However, some of the nucleases they examine have pronounced sequence specificities for cleavage (e.g RNase A & RNase T1), which could make framing information more difficult to deduce from such libraries.
There are now four methods by which digested monosomes are isolated: first, ultracentrifugation through a sucrose cushion as described in Section 5.2; secondly, ultracentrifugation through a sucrose gradient followed by the specific isolation of monosomes using a gradient station; thirdly, through size-exclusion chromatography (SEC) spin columns; and fourthly, by pull-down of a molecular handle associated with the ribosome. Methods that employ pull-down can be set apart from the others – they have typically been designed to isolate and profile ribosomes from specific cell-types [54,55], and specific locations within the cell [56,57]. While they are the basis of the TruSeq Ribo Profile kit from Illumina, we are aware of only a limited number of studies that have employed SEC spins columns to isolate digested monosomes [39,58–61]. The majority of ribosome profiling studies employ one of the two ultracentrifugation based methods. In comparing the two methods, ultracentrifugation through a sucrose gradient followed by the specific isolation of monosomes using a gradient station is the only way to ensure that nuclease digestion results in complete conversion of polysomes to undamaged monosomes. Moreover, this procedure is also likely to result a more stringent purification of monosomes away from the diverse set of mRNPs which likely pellets with monosomes upon ultracentrifugation through a sucrose cushion. This being said, the sucrose cushion procedure was developed to overcome specific issues with the sucrose gradient procedure, mainly that it is slow and technically challenging. This makes it more difficult to scale, and increases the likelihood that the distribution of ribosomes will change from that present at the moment the sample was harvested. We are also aware of at least one study that has dispensed with ribosome isolation altogether, extracting RNA from digested lysate and proceeding directly to an RNA fragment size-selection gel [62].
Compounding the variation introduced by the issues already discussed, much of the difference between different ribosome profiling experiments resides in parameters that are often not examined systematically, such as cell lysis conditions, buffer recipes, and the enzymology of library preparation (reviewed in [63]). The extent to which these variables can skew our understanding of the sequence determinants of ribosome footprint distribution across mRNAs was uncovered by O’Connor et al. [64], in their effort to develop a statistical model to learn the relationships between sequence local to the ribosome and footprint density.
Concerning library preparation more generally, three main strategies exist: cDNA circularization based strategies similar to that outlined in this article, based on our original description of the method [13]; dual-ligation strategies that employ sequentially ligation of 3′ & 5′ adapters to the footprint (exemplified by Weinberg et al. [19] and Wang et al. [60]); and a new approach based on the template switching ability of certain reverse transcriptases [65]. While this “ligation free” method is shown to have lower input requirements, it is yet to find wide application in ribosome profiling studies. Furthermore, in comparing circularization-based and dual-ligation libraries, there is evidence that dual-ligation libraries show can more variable coverage [15]. However, more than one dual-ligation strategy exists (e.g. compare Guo et al. [66] with Weinberg et al. [19]), so it is possible that this finding only applies to some versions of this procedure.
Though it would be very desirable, we are pessimistic on the prospects for ribosome profiling protocol standardization in the near future. Rather our hope lies in the systematic examination of the influence of pertinent experimental parameters exemplified by Heyer et al. [21], and the power of approaches such as that developed by O’Connor et al. [64] to infer the sequence biases of different protocols. Also, a diversity of protocols can yield exciting results, such as the combination of fixation and serial sucrose gradient ultracentrifugation that was recently used to sequence the footprints of scanning initiation complexes [67].
Table 7.
Nucleotide nomenclature definitions
| Code | Meaning |
|---|---|
| [ACGT] | Nucleotides |
| N | A random nucleotide |
| r[ACGUN] | Ribonucleotides |
| /5Phos/ | 5′ phosphorylation |
| /3Phos/ | 3′ phosphorylation |
| /iSp18/ | An 18-atom hexa-ethyleneglycol spacer |
| /3ddC/ | Dideoxycytidine |
The latest version of the ribosome profiling protocol is presented.
Custom linkers contain sample barcodes and unique molecular identifiers.
Enzymatic depletion of unligated linker replaces a gel extraction.
Acknowledgments
We would like to thank all the members of the Ingolia and Lareau labs for providing a constructive and exciting environment within which to study ribosome profiling.
Formatting of funding sources
Funding: This work was supported by the National Institutes of Health [grant numbers R21 ES022575, P50 GM102706, and DP2 CA195768] and the Glenn Foundation for Medical Research. This work used the Vincent J. Coates Genomics Sequencing Laboratory at UC Berkeley, supported by NIH S10 OD018174 Instrumentation Grant.
Footnotes
Publisher's Disclaimer: This is a PDF file of an unedited manuscript that has been accepted for publication. As a service to our customers we are providing this early version of the manuscript. The manuscript will undergo copyediting, typesetting, and review of the resulting proof before it is published in its final citable form. Please note that during the production process errors may be discovered which could affect the content, and all legal disclaimers that apply to the journal pertain.
References
- 1.Yamada EA, Sgarbieri VC. Yeast (Saccharomyces cerevisiae) Protein Concentrate: Preparation, Chemical Composition, and Nutritional and Functional Properties. Journal of Agricultural and Food Chemistry. 2005;53:3931–3936. doi: 10.1021/jf0400821. [DOI] [PubMed] [Google Scholar]
- 2.Sherman F. Getting started with yeast. Methods in Enzymology. 2002;350:3–41. doi: 10.1016/s0076-6879(02)50954-x. [DOI] [PubMed] [Google Scholar]
- 3.Wolin SL, Walter P. Ribosome pausing and stacking during translation of a eukaryotic mRNA. The EMBO Journal. 1988;7:3559–3569. doi: 10.1002/j.1460-2075.1988.tb03233.x. [DOI] [PMC free article] [PubMed] [Google Scholar]
- 4.Ingolia NT, Ghaemmaghami S, Newman JRS, Weissman JS. Genome-wide analysis in vivo of translation with nucleotide resolution using ribosome profiling. Science (New York, NY) 2009;324:218–223. doi: 10.1126/science.1168978. [DOI] [PMC free article] [PubMed] [Google Scholar]
- 5.Ingolia NT, Lareau LF, Weissman JS. Ribosome Profiling of Mouse Embryonic Stem Cells Reveals the Complexity and Dynamics of Mammalian Proteomes. Cell. 2011;147:789–802. doi: 10.1016/j.cell.2011.10.002. [DOI] [PMC free article] [PubMed] [Google Scholar]
- 6.Jackson R, Standart N. The awesome power of ribosome profiling. RNA. 2015;21:652–654. doi: 10.1261/rna.049908.115. [DOI] [PMC free article] [PubMed] [Google Scholar]
- 7.Ingolia NT. Ribosome Footprint Profiling of Translation throughout the Genome. Cell. 2016;165:22–33. doi: 10.1016/j.cell.2016.02.066. [DOI] [PMC free article] [PubMed] [Google Scholar]
- 8.Brar GA, Weissman JS. Ribosome profiling reveals the what, when, where and how of protein synthesis. Nature Reviews Molecular Cell Biology. 2015;16:651–664. doi: 10.1038/nrm4069. [DOI] [PMC free article] [PubMed] [Google Scholar]
- 9.Andreev DE, O’Connor PBF, Loughran G, Dmitriev SE, Baranov PV, Shatsky IN. Insights into the mechanisms of eukaryotic translation gained with ribosome profiling. Nucleic Acids Research. 2017;45:513–526. doi: 10.1093/nar/gkw1190. [DOI] [PMC free article] [PubMed] [Google Scholar]
- 10.Iwasaki S, Floor SN, Ingolia NT. Rocaglates convert DEAD-box protein eIF4A into a sequence-selective translational repressor. Nature. 2016;534:558–561. doi: 10.1038/nature17978. [DOI] [PMC free article] [PubMed] [Google Scholar]
- 11.Werner A, Iwasaki S, McGourty CA, Medina-Ruiz S, Teerikorpi N, Fedrigo I, Ingolia NT, Rape M. Cell-fate determination by ubiquitin-dependent regulation of translation. Nature. 2015;525:523–527. doi: 10.1038/nature14978. [DOI] [PMC free article] [PubMed] [Google Scholar]
- 12.Ishikawa K, Makanae K, Iwasaki S, Ingolia NT, Moriya H. Post-Translational Dosage Compensation Buffers Genetic Perturbations to Stoichiometry of Protein Complexes. PLoS Genetics. 2017;13:e1006554–22. doi: 10.1371/journal.pgen.1006554. [DOI] [PMC free article] [PubMed] [Google Scholar]
- 13.Ingolia NT, Brar GA, Rouskin S, McGeachy AM, Weissman JS. The ribosome profiling strategy for monitoring translation in vivo by deep sequencing of ribosome-protected mRNA fragments. Nature Protocols. 2012;7:1534–1550. doi: 10.1038/nprot.2012.086. [DOI] [PMC free article] [PubMed] [Google Scholar]
- 14.Auer PL, Doerge RW. Statistical design and analysis of RNA sequencing data. Genetics. 2010;185:405–416. doi: 10.1534/genetics.110.114983. [DOI] [PMC free article] [PubMed] [Google Scholar]
- 15.Lecanda A, Nilges BS, Sharma P, Nedialkova DD, Schwarz J, Vaquerizas JM, Leidel SA. Dual randomization of oligonucleotides to reduce the bias in ribosome-profiling libraries. Methods. 2016;107:89–97. doi: 10.1016/j.ymeth.2016.07.011. [DOI] [PMC free article] [PubMed] [Google Scholar]
- 16.Huppertz I, Attig J, D’Ambrogio A, Easton LE, Sibley CR, Sugimoto Y, Tajnik M, König J, Ule J. iCLIP: Protein-RNA interactions at nucleotide resolution. Methods. 2014;65:274–287. doi: 10.1016/j.ymeth.2013.10.011. [DOI] [PMC free article] [PubMed] [Google Scholar]
- 17.Gao X, Wan J, Liu B, Ma M, Shen B, Qian SB. Quantitative profiling of initiating ribosomes in vivo. Nature Methods. 2014;12:147–153. doi: 10.1038/nmeth.3208. [DOI] [PMC free article] [PubMed] [Google Scholar]
- 18.Lee S, Liu B, Lee S, Lee S, Huang SX, Shen B, Qian SB. Global mapping of translation initiation sites in mammalian cells at single-nucleotide resolution. Proceedings of the National Academy of Sciences. 2012;109:E2424–32. doi: 10.1073/pnas.1207846109. [DOI] [PMC free article] [PubMed] [Google Scholar]
- 19.Weinberg DE, Shah P, Eichhorn SW, Hussmann JA, Plotkin JB, Bartel DP. Improved Ribosome-Footprint and mRNA Measurements Provide Insights into Dynamics and Regulation of Yeast Translation. Cell Reports. 2016;14:1787–1799. doi: 10.1016/j.celrep.2016.01.043. [DOI] [PMC free article] [PubMed] [Google Scholar]
- 20.Lareau LF, Hite DH, Hogan GJ, Brown PO. Distinct stages of the translation elongation cycle revealed by sequencing ribosome-protected mRNA fragments. ELife. 2014;3:190–16. doi: 10.7554/eLife.01257. [DOI] [PMC free article] [PubMed] [Google Scholar]
- 21.Heyer EE, Ozadam H, Ricci EP, Cenik C, Moore MJ. An optimized kit-free method for making strand-specific deep sequencing libraries from RNA fragments. Nucleic Acids Research. 2015;43:e2–e2. doi: 10.1093/nar/gku1235. [DOI] [PMC free article] [PubMed] [Google Scholar]
- 22.Heyer EE, Moore MJ. Redefining the Translational Status of 80S Monosomes. Cell. 2016;164:757–769. doi: 10.1016/j.cell.2016.01.003. [DOI] [PubMed] [Google Scholar]
- 23.Gerashchenko MV, Gladyshev VN. Ribonuclease selection for ribosome profiling. Nucleic Acids Research. 2017;45:e6–e6. doi: 10.1093/nar/gkw822. [DOI] [PMC free article] [PubMed] [Google Scholar]
- 24.Faridani OR, Abdullayev I, Hagemann-Jensen M, Schell JP, Lanner F, Sandberg R. Single-cell sequencing of the small-RNA transcriptome. Nature Biotechnology. 2016:1–31. doi: 10.1038/nbt.3701. [DOI] [PubMed] [Google Scholar]
- 25.Langmead B, Salzberg SL. Fast gapped-read alignment with Bowtie 2. Nature Methods. 2012;9:357–359. doi: 10.1038/nmeth.1923. [DOI] [PMC free article] [PubMed] [Google Scholar]
- 26.Kim D, Pertea G, Trapnell C, Pimentel H, Kelley R, Salzberg SL. TopHat2: accurate alignment of transcriptomes in the presence of insertions, deletions and gene fusions. Genome Biology. 2013;14:R36. doi: 10.1186/gb-2013-14-4-r36. [DOI] [PMC free article] [PubMed] [Google Scholar]
- 27.Thorvaldsdottir H, Robinson JT, Mesirov JP. Integrative Genomics Viewer (IGV): high-performance genomics data visualization and exploration. Briefings in Bioinformatics. 2013;14:178–192. doi: 10.1093/bib/bbs017. [DOI] [PMC free article] [PubMed] [Google Scholar]
- 28.Robinson JT, Thorvaldsdóttir H, Winckler W, Guttman M, Lander ES, Getz G, Mesirov JP. Integrative genomics viewer. Vol. 29. Nature Publishing Group; 2011. pp. 24–26. [DOI] [PMC free article] [PubMed] [Google Scholar]
- 29.Love MI, Huber W, Anders S. Moderated estimation of fold change and dispersion for RNA-seq data with DESeq2. Genome Biology. 2014;15:550. doi: 10.1186/s13059-014-0550-8. [DOI] [PMC free article] [PubMed] [Google Scholar]
- 30.Larsson O, Sonenberg N, Nadon R. anota: analysis of differential translation in genome-wide studies. Bioinformatics (Oxford, England) 2011;27:1440–1441. doi: 10.1093/bioinformatics/btr146. [DOI] [PubMed] [Google Scholar]
- 31.Zhong Y, Karaletsos T, Drewe P, Sreedharan VT, Kuo D, Singh K, Wendel H-G, Rätsch G. RiboDiff: detecting changes of mRNA translation efficiency from ribosome footprints. Bioinformatics (Oxford, England) 2017;33:139–141. doi: 10.1093/bioinformatics/btw585. [DOI] [PMC free article] [PubMed] [Google Scholar]
- 32.Xiao Z, Zou Q, Liu Y, Yang X. Genome-wide assessment of differential translations with ribosome profiling data. Nature Communications. 2016;7:1–11. doi: 10.1038/ncomms11194. [DOI] [PMC free article] [PubMed] [Google Scholar]
- 33.Jiang L, Schlesinger F, Davis CA, Zhang Y, Li R, Salit M, Gingeras TR, Oliver B. Synthetic spike-in standards for RNA-seq experiments. Genome Research. 2011;21:1543–1551. doi: 10.1101/gr.121095.111. [DOI] [PMC free article] [PubMed] [Google Scholar]
- 34.Chen K, Hu Z, Xia Z, Zhao D, Li W, Tyler JK. The Overlooked Fact: Fundamental Need for Spike-In Control for Virtually All Genome-Wide Analyses. Molecular and Cellular Biology. 2016;36:662–667. doi: 10.1128/MCB.00970-14. [DOI] [PMC free article] [PubMed] [Google Scholar]
- 35.Lovén J, Orlando DA, Sigova AA, Lin CY, Rahl PB, Burge CB, Levens DL, Lee TI, Young RA. Revisiting Global Gene Expression Analysis. Cell. 2012;151:476–482. doi: 10.1016/j.cell.2012.10.012. [DOI] [PMC free article] [PubMed] [Google Scholar]
- 36.Risso D, Ngai J, Speed TP, Dudoit S. The role of spike-in standards in the normalization of RNA-seq. Statistical Analysis of Next …. 2014 [Google Scholar]
- 37.Han Y, David A, Liu B, Magadán JG, Bennink JR, Yewdell JW, Qian S-B. Monitoring cotranslational protein folding in mammalian cells at codon resolution. Proceedings of the National Academy of Sciences. 2012;109:12467–12472. doi: 10.1073/pnas.1208138109. [DOI] [PMC free article] [PubMed] [Google Scholar]
- 38.Popa A, Lebrigand K, Barbry P, Waldmann R. Pateamine A-sensitive ribosome profiling reveals the scope of translation in mouse embryonic stem cells. BMC Genomics. 2016:1–18. doi: 10.1186/s12864-016-2384-0. [DOI] [PMC free article] [PubMed] [Google Scholar]
- 39.Ingolia NT, Brar GA, Stern-Ginossar N, Harris MS, Talhouarne GJS, Jackson SE, Wills MR, Weissman JS. Ribosome Profiling Reveals Pervasive Translation Outside of Annotated Protein-Coding Genes. Cell Reports. 2014;8:1365–1379. doi: 10.1016/j.celrep.2014.07.045. [DOI] [PMC free article] [PubMed] [Google Scholar]
- 40.Chung BY, Hardcastle TJ, Jones JD, Irigoyen N, Firth AE, Baulcombe DC, Brierley I. The use of duplex-specific nuclease in ribosome profiling and a user-friendly software package for Ribo-seq data analysis. RNA. 2015;21:1731–1745. doi: 10.1261/rna.052548.115. [DOI] [PMC free article] [PubMed] [Google Scholar]
- 41.Popa A, Lebrigand K, Paquet A, Nottet N, Robbe-Sermesant K, Waldmann R, Barbry P. RiboProfiling: a Bioconductor package for standard Ribo-seq pipeline processing. F1000Research. 2016;5:1309–12. doi: 10.12688/f1000research.8964.1. [DOI] [PMC free article] [PubMed] [Google Scholar]
- 42.Michel AM, Mullan JPA, Velayudhan V, O’Connor PBF, Donohue CA, Baranov PV. RiboGalaxy: A browser based platform for the alignment, analysis and visualization of ribosome profiling data. RNA Biology. 2016;13:316–319. doi: 10.1080/15476286.2016.1141862. [DOI] [PMC free article] [PubMed] [Google Scholar]
- 43.Dunn JG, Weissman JS. Plastid: nucleotide-resolution analysis of next-generation sequencing and genomics data. BMC Genomics. 2016:1–12. doi: 10.1186/s12864-016-3278-x. [DOI] [PMC free article] [PubMed] [Google Scholar]
- 44.Wang H, McManus J, Kingsford C. Isoform-level ribosome occupancy estimation guided by transcript abundance with Ribomap. Bioinformatics (Oxford, England) 2016;32:1880–1882. doi: 10.1093/bioinformatics/btw085. [DOI] [PMC free article] [PubMed] [Google Scholar]
- 45.Baranov PV, Michel AM. Illuminating translation with ribosome profiling spectra. Nature Methods. 2016;13:123–124. doi: 10.1038/nmeth.3738. [DOI] [PubMed] [Google Scholar]
- 46.Calviello L, Mukherjee N, Wyler E, Zauber H, Hirsekorn A, Selbach M, Landthaler M, Obermayer B, Ohler U. Detecting actively translated open reading frames in ribosome profiling data. Nature Methods. 2015;13:165–170. doi: 10.1038/nmeth.3688. [DOI] [PubMed] [Google Scholar]
- 47.Ji Z, Song R, Huang H, Regev A, Struhl K. Transcriptome-scale RNase-footprinting of RNA-protein complexes. Nature Biotechnology. 2016:1–11. doi: 10.1038/nbt.3441. [DOI] [PMC free article] [PubMed] [Google Scholar]
- 48.Barry KC, Ingolia NT, Vance RE. Global analysis of gene expression reveals mRNA superinduction is required for the inducible immune response to a bacterial pathogen. ELife. 2017;6:e1004229. doi: 10.7554/eLife.22707. [DOI] [PMC free article] [PubMed] [Google Scholar]
- 49.Woolstenhulme CJ, Guydosh NR, Green R, Buskirk AR. High-Precision Analysis of Translational Pausing by Ribosome Profiling in Bacteria Lacking EFP. Cell Reports. 2015;11:13–21. doi: 10.1016/j.celrep.2015.03.014. [DOI] [PMC free article] [PubMed] [Google Scholar]
- 50.Li GW, Oh E, Weissman JS. The anti-Shine-Dalgarno sequence drives translational pausing and codon choice in bacteria. Nature. 2012;484:538–541. doi: 10.1038/nature10965. [DOI] [PMC free article] [PubMed] [Google Scholar]
- 51.Oh E, Becker AH, Sandikci A, Huber D, Chaba R, Gloge F, Nichols RJ, Typas A, Gross CA, Kramer G, Weissman JS, Bukau B. Selective Ribosome Profiling Reveals the Cotranslational Chaperone Action of Trigger Factor In Vivo. Cell. 2011;147:1295–1308. doi: 10.1016/j.cell.2011.10.044. [DOI] [PMC free article] [PubMed] [Google Scholar]
- 52.Kronja I, Yuan B, Eichhorn SW, Dzeyk K, Krijgsveld J, Bartel DP, Orr-Weaver TL. Widespread Changes in the Posttranscriptional Landscape at the Drosophila Oocyte-to-Embryo Transition. Cell Reports. 2014;7:1495–1508. doi: 10.1016/j.celrep.2014.05.002. [DOI] [PMC free article] [PubMed] [Google Scholar]
- 53.Dunn JG, Foo CK, Belletier NG, Gavis ER, Weissman JS. Ribosome profiling reveals pervasive and regulated stop codon readthrough in Drosophila melanogaster. ELife. 2013;2:e01179–32. doi: 10.7554/eLife.01179. [DOI] [PMC free article] [PubMed] [Google Scholar]
- 54.Heiman M, Schaefer A, Gong S, Peterson JD, Day M, Ramsey KE, Suárez-Fariñas M, Schwarz C, Stephan DA, Surmeier DJ, Greengard P, Heintz N. A Translational Profiling Approach for the Molecular Characterization of CNS Cell Types. Cell. 2008;135:738–748. doi: 10.1016/j.cell.2008.10.028. [DOI] [PMC free article] [PubMed] [Google Scholar]
- 55.Sanz E, Yang L, Su T, Morris DR, McKnight GS, Amieux PS. Cell-type-specific isolation of ribosome-associated mRNA from complex tissues. Proceedings of the National Academy of Sciences. 2009;106:13939–13944. doi: 10.1073/pnas.0907143106. [DOI] [PMC free article] [PubMed] [Google Scholar]
- 56.Jan CH, Williams CC, Weissman JS. Principles of ER cotranslational translocation revealed by proximity-specific ribosome profiling. Science (New York, NY) 2014;346:1257521. doi: 10.1126/science.1257521. [DOI] [PMC free article] [PubMed] [Google Scholar]
- 57.Williams CC, Jan CH, Weissman JS. Targeting and plasticity of mitochondrial proteins revealed by proximity-specific ribosome profiling. Science (New York, NY) 2014;346:748–751. doi: 10.1126/science.1257522. [DOI] [PMC free article] [PubMed] [Google Scholar]
- 58.Bazzini AA, Lee MT, Giraldez AJ. Ribosome Profiling Shows That miR-430 Reduces Translation Before Causing mRNA Decay in Zebrafish. Science (New York, NY) 2012;336:233–237. doi: 10.1126/science.1215704. [DOI] [PMC free article] [PubMed] [Google Scholar]
- 59.Bazzini AA, Johnstone TG, Christiano R, Mackowiak SD, Obermayer B, Fleming ES, Vejnar CE, Lee MT, Rajewsky N, Walther TC, Giraldez AJ. Identification of small ORFs in vertebrates using ribosome footprinting and evolutionary conservation. The EMBO Journal. 2014;33:981–993. doi: 10.1002/embj.201488411. [DOI] [PMC free article] [PubMed] [Google Scholar]
- 60.Wang X, Zhao BS, Roundtree IA, Lu Z, Han D, Ma H, Weng X, Chen K, Shi H, He C. N6-methyladenosine Modulates Messenger RNA Translation Efficiency. Cell. 2015;161:1388–1399. doi: 10.1016/j.cell.2015.05.014. [DOI] [PMC free article] [PubMed] [Google Scholar]
- 61.Hsu PY, Calviello L, Wu HYL, Li FW, Rothfels CJ, Ohler U, Benfey PN. Super-resolution ribosome profiling reveals unannotated translation events in Arabidopsis. Proceedings of the National Academy of Sciences of the United States of America. 2016;113:E7126–E7135. doi: 10.1073/pnas.1614788113. [DOI] [PMC free article] [PubMed] [Google Scholar]
- 62.Reid DW, Shenolikar S, Nicchitta CV. Simple and inexpensive ribosome profiling analysis of mRNA translation. Methods. 2015;91:1–6. doi: 10.1016/j.ymeth.2015.07.003. [DOI] [PMC free article] [PubMed] [Google Scholar]
- 63.Bartholomäus A, Del Campo C, Ignatova Z. Mapping the non-standardized biases of ribosome profiling. Biological Chemistry. 2015;397:1–13. doi: 10.1515/hsz-2015-0197. [DOI] [PubMed] [Google Scholar]
- 64.rsquo Connor PBFO, Andreev DE, Baranov PV. Comparative survey of the relative impact of mRNA features on local ribosome profiling read density. Nature Communications. 2016;7:1–12. doi: 10.1038/ncomms12915. [DOI] [PMC free article] [PubMed] [Google Scholar]
- 65.Hornstein N, Torres D, Das Sharma S, Tang G, Canoll P, Sims PA. Ligation-free ribosome profiling of cell type-specific translation in the brain. Genome Biology. 2016:1–20. doi: 10.1186/s13059-016-1005-1. [DOI] [PMC free article] [PubMed] [Google Scholar]
- 66.Guo H, Ingolia NT, Weissman JS, Bartel DP. Mammalian microRNAs predominantly act to decrease target mRNA levels. Nature. 2010;466:835–840. doi: 10.1038/nature09267. [DOI] [PMC free article] [PubMed] [Google Scholar]
- 67.Archer SK, Shirokikh NE, Beilharz TH, Preiss T. Dynamics of ribosome scanning and recycling revealed by translation complex profiling. Nature. 2016:1–17. doi: 10.1038/nature18647. [DOI] [PubMed] [Google Scholar]