

Abstract
Emergence of resistance to drugs used to treat the Indian Kala-azar patients makes control strategy shattered. In this bleak situation, Miltefosine (MIL) was introduced to treat mainly antimonial unresponsive cases. Within years, resistance to MIL has been reported. While checking the MIL sensitivity of the recent KA clinical isolates (n = 26), we came across one isolate which showed four times more EC50 for MIL than that of MIL-Sensitive (MIL-S) isolates and considered as putative MIL-Resistant (MIL-R). The expressions of LdMT and LdRos3 genes of this isolate were found down regulated. Th1/Th2 cytokines, ROS and NO, FACS dot plots and mitochondrial trans membrane potential measurement were performed. In vivo hamster model with this MIL-R isolate showed much lesser reduction in liver weight (17.5%) compared to average reduction in liver weight (40.2%) of the animals infected with MIL-S isolates. The splenic and hepatic stamps smears of MIL-R infected hamsters revealed the retention of parasite load of about 51.45%. The splenocytes of these animals failed to proliferate anti leishmanial T-cells and lack of cell mediated immunity hampered recovery. Thus, these phenotypic expressions of experimental model may be considered similar to that of the MIL unresponsive patients. This is first such kind of report.
Introduction
The disease, Visceral Leishmaniasis (VL) or Kala-azar (KA) is endemic in the Indian subcontinent and broadening its base on the Gangetic plains of Bangladesh, India and Nepal. KA is the most fetal disease if left untreated1–5. Occurrence of immune suppression in the host (eg, human immunodeficiency virus [HIV] co infection) and emergence of resistance to first line antimonial drugs6, 7 are two serious health problems associated with the disease. Earlier reports suggested that resistance of Leishmania parasites to antimonials is related to Sodium Stibo Gluconate (SSG) treatment failure in the Indian state, Bihar8, 9. Second line treatment with Amphotericin B (AmB) was highly efficacious10 but unresponsiveness towards AmB have started been reported11. Other substitute drugs such as Pentamidine, Paromomycin remain largely inadequate due to high cost, high toxicity or side effects2, 12. The existing oral drug Miltefosine (MIL) (hexadecylphosphocholine), a lysophospholipid analog, was mainly developed as an anticancer drug but it is effective in vitro against a variety of species of Leishmania 13, 14 and other protozoan parasites including Trypanosoma cruzi, T.brucei 15, Entamoeba histolytica 16 and Acanthamoeba sp 17. MIL, had been approved in India, in 2002, for the treatment of Indian VL patients18, including cases unresponsive to antimonial and has achieved more than 97% cure rate19. Within few years, unresponsiveness to MIL in VL patients20, 21 and failure of MIL in the treatment of KA in Nepal have been reported22. The above observations revealed the crude reality that any drug, how efficacious it may be, after some years of its use, resistance would appear. Thus, the parasite resistance to the commonly used drugs must be monitored carefully to combat this deadly disease. For this, each and every field isolate of the patients should be characterized extensively and it is not done in many places including India.
For MIL transport in Leishmania parasites, a two-subunit amino phospholipid translocase, Leishmania donovani miltefosine transporter (LdMT) and its specific beta subunit LdRos3, internalizes the drug23. Phospholipid vesicles (liposomes) employed as carrier systems for MIL, reduces its toxic side effects23 and there have connection between the expression levels of both proteins and the parasite sensitivity towards the drug24, 25.
Understanding the mechanism of resistance, factors related to it and control strategy to develop thereafter against the resistant parasites, it is prerequisite to study MIL-R isolates in vitro and/or in vivo. In recent report, two Leishmania isolates were identified as MIL-Resistant (MIL-R) by the in vitro and genome study and these isolates were collected from confirmed Indian KA patients26. Few years back, researchers in the field generated a MIL-R Leishmania parasite by step-wise increment of drug pressure in vitro and reported that in case of MIL-Sensitive (MIL- S) Leishmania parasite, the effect of MIL was mediated through Apoptosis- like death but not in MIL-R Leishmania parasite27. Till date, there is no report of animal models for in vivo characterization of the MIL-R isolates. The phenotypic expression observed in the animal model may be similar to that of the unresponsive MIL patients and would be instrumental in developing the control strategy.
In the present study, we have characterized all the clinical isolates of Indian KA at species level because of the fact that though Leishmania donovani historically known as the causative agent for Indian KA or VL3, 4, other species (L. tropica) is found to be associated with the disease5, 28. Thus, before going for any typological work with any clinical isolate, it became mandate to ascertain its identification at species level with the help of species specific markers [e.g., rRNA gene-internal transcribed spacers (ITS), heat shock protein of 70 kDa (hsp70), Major surface protease msp (gp63) gene and genes encoding cysteine proteinase B etc]29–32. As a part of our epidemiological search for Indian KA, we rigorously characterized all the recently collected clinical isolates through Randomly amplified polymorphic DNA (RAPD) analysis and performed Restriction Fragment Length Polymorphism (RFLP) analysis with the help of several species specific markers (ITS1 and hsp70) to ascertain their species identity4, 5. All the isolates used here (n = 26) were collected from confirmed Indian KA and typed as Leishmania donovani 4, 5. Then we have checked the drug sensitivity of all isolates (n = 26) for MIL and found one as putative MIL-R field isolate of KA (L. donovani) with four times more EC50 for MIL than that of MIL-Sensitive (MIL-S) isolates. We have opted for in vivo evaluation of this field isolate (study code T9) in hamster model. Infection with this MIL-R isolate in hamsters showed 17.5% reduction in liver weight compared to average reduction in liver weight by 40.2% of the animals infected with MIL-S isolates. MIL-R infected animals revealed the retention of parasite load in spleen and liver by about 51.45% respectively. The splenocytes of these animals failed to proliferate anti leishmanial T-cells and this T-cell anergy hampered recovery mimicking the scenario with MIL unresponsive patients. Thus, we are reporting for the first time, the phenotypic expressions of confirmed MIL-R L.donovani isolate in hamster model.
Results
Identification of the clinical isolates at species level by Restriction Fragment Length Polymorphism (RFLP) method
The Internal Transcribed Spacer 1 (ITS1) RFLP33 and the Heat Shock Protein 70 (hsp70) RFLP32 are well-known molecular markers for the characterization of Leishmania parasites at species level. The ITS1 region and hsp70 region of all the samples were amplified separately and subjected to ITS1 RFLP and hsp70 RFLP analysis individually. Species-specific RFLP patterns were obtained for L.donovani WHO strain (DD8) and L. tropica WHO strain (K27) respectively. A portion of the isolates of the present study, had been characterized earlier by RAPD (n = 9)4 and RFLP (n = 25)5, 34 methods. We noticed that the additional clinical isolate (n = 1) of the present study have shown similar ITS1 RFLP (Supplementary Fig. S1) and hsp70 RFLP profile (Supplementary Fig. S2) as that of L. donovani standard strain DD8. Thus, the clinical isolates along with the putative MIL-R (study code T9) included in the present study were identified as L. donovani.
In vitro MIL susceptibility assay
MIL susceptibility was determined at intracellular amastigote stage for the field isolates of KA. In the present study, we have used RAW 264.7 cells as host cell and percentage of infected MØs ranged from 80 to 89 and the number of amastigotes/100 MØs ranged from 90 to 98. When the intracellular amastigotes of the KA isolates were subjected to test the susceptibility towards MIL, the EC50 values ranged from 1.74 ± 0.10 to 5.35 ± 0.83 μM with a mean EC50 of 3.32 ± 0.07 μM for MIL-sensitive (MIL-S) isolates while only one field isolate, T9 showed EC50 of 13.47 ± 0.87 μM (Table 1) which was approximately 4 times more EC50 value compared to the mean EC50 value of the MIL-S isolates. On the other hand, the AG83 (MHOM/IN/1983/AG83) isolate was used as a reference strain as it has been thoroughly worked out by workers as sensitive towards both of the drugs: MIL35 and Sodium Stibo Gluconate (SSG)36. Our single MIL-resistant (MIL-R) isolate from the field, showed approximately 3 times higher EC50 value compared to the EC50 value of the L. donovani MIL-S isolate (AG83).
Table 1.
Susceptibility of intracellular amastigotes of Leishmania isolates to Miltefosine (MIL), represented by EC50 values.
| Serial No. | Isolates | MIL EC50 ± SD (µM) |
|---|---|---|
| 1 | AG83 | 4.39 ± 0.43 |
| 2 | T2 | 4.69 ± 0.28 |
| 3 | T3 | 2.39 ± 0.025 |
| 4 | T4 | 3.73 ± 1.34 |
| 5 | T7 | 2.47 ± 0.13 |
| 6 | M1 | 3.88 ± 0.33 |
| 7 | PG2 | 3.99 ± 0.59 |
| 8 | PG3 | 2.28 ± 0.11 |
| 9 | PG4 | 3.78 ± 0.47 |
| 10 | RAJ-04 | 2.44 ± 0.58 |
| 11 | RAJ-05 | 2.70 ± 0.58 |
| 12 | RAJ-07 | 3.09 ± 0.27 |
| 13 | P1 | 4.24 ± 0.15 |
| 14 | BI | 3.91 ± 0.89 |
| 15 | BHU581 | 2.14 ± 0.33 |
| 16 | BHU569 | 2.09 ± 0.48 |
| 17 | BHU568 | 2.08 ± 0.41 |
| 18 | BHU572 | 1.89 ± 0.26 |
| 19 | BHU573 | 3.19 ± 0.48 |
| 20 | BHU574 | 1.74 ± 0.10 |
| 21 | BHU575 | 2.75 ± 0.41 |
| 22 | BHU592 | 2.80 ± 0.24 |
| 23 | BHU860 | 4.66 ± 0.82 |
| 24 | BHU965 | 5.35 ± 0.83 |
| 25 | T8 | 4.29 ± 0.59 |
| 26 | P2 | 3.66 ± 0.47 |
| 27 | T9 | 13.47 ± 0.87 |
Serial number in bold and regular denoted unresponsive (MIL-R) and sensitive (MIL-S) to MIL, respectively. All the isolates were MIL-S except serial no. 27, denoting MIL-R isolate (T9). Results were given as mean ± SD.
This observation corroborated the previous report of two MIL-R isolates26, where the researchers suggested that the IC50 value of MIL-R field isolates approximately 2 times more higher than the IC50 value of the L. donovani MIL-S standard strain (DD8)26 although it is also reported that, the in vitro activity regarding the effectiveness of any anti-leishmanial drugs against Leishmanial parasites may be dependent on the host cell37. Our putative MIL-R isolate (T9) is SSG-Sensitive (SSG-S) with EC50 value 4.69 ± 0.30 μg/ml and the result was also expressed in terms of Activity Index (AI) using AG83 as reference isolate of KA. Isolates with an AI ≥ 3.0 are considered as SSG-Resistant (SSG-R) and an AI < 3 are considered as SSG-Sensitive (SSG-S)34, 38. The AI of the MIL-R isolate is 2.51. Therefore it was identified as SSG-S.
Expression of cytokines level
In case of MØs infected with MIL-S clinical isolates (Fig. 1a panels AG83, T8), the expression level of IL-10 were gradually decreased with increasing concentrations of MIL. On the other hand, there was no significant decrease in the expression level of IL-10 release from MØs infected with putative MIL-R isolate (T9) and then treated with MIL (Fig. 1a).
Figure 1.

Analysis of cytokines level releases from macrophages (MØs) infected with the clinical isolates (AG83, T8, T9) following different concentrations of MIL treatment. The culture supernatants were harvested to determine (a) IL-10, (b) IL-12 and (c) TNF-α content by ELISA. Data represent mean ± SD of three independent experiments. *P < 0.05,**P < 0.001, ***P < 0.0001(Student’s t-test), representing significant differences between clinical isolate infected macrophages and MIL treated infected macrophages in (a) IL-10, (b) IL-12 and (c) TNF-α cytokine production respectively. NS: Non significance.
On the other hand, the expression levels of IL-12 (Fig. 1b panels AG83, T8) and TNF-α (Fig. 1c panels AG83, T8) releases from MØs infected with MIL-S KA isolates following drug treatment (MIL), were gradually increased with increasing concentrations of MIL. On contrary, there is no significant change in the expression levels of IL-12 (Fig. 1b, panel T9) and TNF-α (Fig. 1c, panel T9) releases from MØs infected with putative MIL-R isolate and then treated with MIL with respect of its infected control group.
Measurement of nitric oxide (NO) and reactive oxygen species (ROS)
The in vitro MIL sensitivity assay and cytokines data showed the response patterns of the studied clinical isolates towards MIL. We carried out experiments to understand the status of NO and ROS in infected and drug treated macrophages because they are the essential leishmanicidal molecules as stated earlier39.
In case of MIL-S clinical isolates (AG83 & T8) infected MØs, the generation levels of NO (Fig. 2a panels AG83, T8) and ROS (Fig. 2b panels AG83, T8) were gradually enhanced with increasing concentrations of MIL. There was no significant increase in the NO (Fig. 2a, panel T9) and ROS (Fig. 2b, panel T9) releases from MØs infected with putative MIL-R isolate (T9) and treated with MIL with respect to infected control group.
Figure 2.

Generation of Nitrite production and ROS in the studied isolates (AG83, T8, T9) infected and MIL treated macrophages. Culture supernatant was used to evaluate (a) NO generation by Griess method and (b) ROS generation was measured by H2DCFDA probe. Data represents mean ± SD of three independent experiments; *P < 0.05,**P < 0.001, ***P < 0.0001(Student’s t-test), representing significant differences between studied isolate infected macrophages and MIL-treated infected macrophages in (a) NO and (b) ROS production respectively. NS: Non significance.
Detection of the mitochondrial trans membrane potential (ΔΨm) and viable Leishmania isolates following MIL treatment
JC-1 was used as a probe for the measurement of ΔΨm by flow cytometry. We observed that the MIL-S clinical isolates (AG83, T8) showed sensitivity to MIL as evident from the noteworthy decrease in ΔΨm after 72 h of MIL treatment (Fig. 3a,b panels AG83, T8). When the putative MIL-R isolate (T9) was exposed to similar MIL treatment, the red/green fluorescence ratio was not decreased significantly due to the less sensitivity towards MIL (Fig. 3a,b panel T9).
Figure 3.

Assessment of mitochondrial transmembrane potential in different clinical isolates (AG83, T8, T9) and viable Leishmania isolates following MIL treatment. (a) Mitochondrial membrane potential (ΔΨm) in studied isolates following MIL treatment were measured using 5,5,6,6-Tetrachloro-1,1,3,3-tetraethylbenzimidazole carbocyanide iodide (JC-1) probe and (b) the bar graph showing the ratio of fluorescence (590 nm/530 nm) measured by fluorescence activated cell sorting analysis. (c) Annexin V fluorescein isothiocyanate (FITC)- Propidium Iodide(PI) Assay in the studied isolates following MIL treatment were performed to assess viable Leishmania isolates and the lower left quadrant of each dot plot represents viable isolates. (d) The bar graph showing the viable cells as determined by fluorescence activated cell sorting analysis. Data are expressed as the mean ± SD of three independent experiments and levels of significance are indicated by P values.
The flow cytometric analysis with FITC Annexin V/PI double staining result revealed that when MIL-S clinical isolates were exposed to MIL, around 7% viable population of cells were observed (Fig. 3c,d panels AG83, T8). On contrary, after MIL exposure to T9 (putative MIL-R) about 67% viable population of cells were observed (Fig. 3c,d panel T9).
LdMT and LdRos3 expressions in different field isolates
The expression level of the MIL transporter LdMT and its beta subunit LdRos3 were determined using semi quantitative Reverse Transcription (RT)-PCR analysis (Supplementary Fig. S3). LdMT expression was approximately 3.22 times higher in MIL-S isolates (r = −0.64) and the LdRos3 has also shown approximately 3.11 fold higher expression in MIL-S isolates (r = −0.53). The levels of expression of LdMT and LdRos3 were correlated (Fig. 4).
Figure 4.

Graphical representation of the densitometric data. Expression level of LdMT was expressed as a ratio of LdMT mRNA level to GAPDH mRNA level and the expression level of LdRos3 was expressed as a ratio of LdRos3 mRNA level to GAPDH mRNA level. The levels of expression of LdMT and LdRos3 were correlated and LdRos3 expression was higher than LdMT expression. Data were expressed as the mean ± SD of three independent experiments. Each scatter plot in the inset represents the correlation between the EC50 of the isolates against MIL and the respective gene expression.
Measurement of Multidrug resistant protein A (MRPA) expression level
The expression level of MRPA was determined by semi quantitative Reverse Transcription (RT)-PCR analysis (Supplementary Fig. S4). It has been revealed that the single MIL-R field isolate (T9) showed approximately 3.4 times higher level MRPA expression than that of the MIL-S L. donovani isolate (AG83) (Supplementary Fig. S4).
Organomegally study in hamster model
Liver weight of the treated groups of hamsters (AG83-TRE, T8-TRE and T9-TRE) showed reduction in weight by 35.99%, 44.38% and 17.48% respectively in comparison to that of the infected groups (AG83-INF, T8-INF and T9-INF) (Fig. 5a panels AG83, T8, T9). The spleen weights of the treated groups were decreased by 63.2%, 72.3% and 27.75% respectively with respect to that of the infected groups of hamsters (Fig. 5b panels AG83, T8, T9).
Figure 5.

Study of Organomegaly and Estimation of parasite burden in the spleen and liver of the experimental groups of animals. Hamsters were infected with studied parasites and infection was allowed to establish for next 8 weeks. 8 weeks infected hamsters received MIL doses. After 45 days post treatment hamsters were sacrificed and (a) Liver weight and (b) Spleen weight of the hamsters of different experimental groups (AG83-INF, AG83-TRE; T8-INF, T8-TRE; T9-INF, T9-TRE) were determined. Data represents mean ± SD of 5 animals per group; unpaired two-tailed Student’s t-test was performed and levels of significance are indicated by P values. On the other hand, after 45 days post treatment hamsters were sacrificed and the (c) hepatic as well as the (d) splenic parasite load was determined by stamps-smear method. Total parasite load in each organ is expressed in LDU unit. 1 LDU = amastigote per nucleated cell x organ weight in milligram. Data represents mean ± SD of 5animals per group; unpaired two-tailed Student’s t-test was performed and levels of significance are indicated by P values.
Parasite load of liver and spleen were expressed as Leishman-Donovan Unit (LDU)
In liver, the parasite load after MIL treatment in experimental animal groups (AG83-TRE & T8-TRE) showed about 3–7% retention compared to that of the infected groups (Fig. 5c, panels AG83, T8) while group T9-TRE animals (infected with putative MIL-R isolate and then treated with MIL) showed retention of 32–62% (average 51.54%) parasites in the liver (Fig. 5c, panel T9). The retention of parasite load after MIL treatment in experimental animal groups (AG83-TRE & T8-TRE) of animals was about 3–8% in spleen compared to that of the infected groups (Fig. 5d panels AG83, T8). T9-TRE animals (infected with putative MIL-R isolate and then treated with MIL) showed retention of 36–69% (average 51.35%) parasites in spleen (Fig. 5d, panel T9).
T-cell proliferation assay
The splenocytes of treated MIL-S groups (AG83-TRE & T8-TRE) stimulated with SLA showed a significantly higher level of T-cell proliferation than that of the infected groups and the splenocytes of T9-TRE group animals failed to proliferate anti leishmanial T-cell against leishmanial antigen at significantly higher level than T9-INF group (Supplementary Fig. S5).
Measurement of antileishmanial antibody responses
To understand the disease dynamics, anti leishmanial antibodies were measured using the sera from all the groups of animals. The presence of anti leishmanial IgG2 antibodies in the sera of these animals were detected together with IgG1 (Fig. 6a–c). Following MIL treatment, in respect to the infected groups of hamsters (AG83-INF and T8-INF groups), the level of IgG1 isotype of treated groups [AG83-TRE (P = 0.001 at 10−1dilution), T8-TRE (P = 0.0039 at 10−1dilution)] were decreased significantly (Fig. 6a,b) except for T9-TRE group (hamsters infected with putative MIL-R isolate T9 and then treated with MIL) (Fig. 6c). On the other hand, MIL treated hamsters groups: AG83-TRE (P < 0.0001 at 10−3dilution) and T8-TRE (P < 0.0001 at 10−3 dilution) showed significantly increased level of IgG2 in respect of AG83-INF and T8-INF groups (Fig. 6a,b). In contrast, there was no significant change in the level of IgG2 between T9-TRE and T9-INF group (Fig. 6c).
Figure 6.

Measurement of antileishmanial IgG1 and IgG2 antibody titers in different groups of hamsters. (a–c) The dilutions of sera are 10−1, 10−2, 10−3 fold were used to analyze IgG1 of infected and MIL treated groups of hamster. (a–c) The dilutions of sera are 10−3, 10−4, 10−5 fold were used to analyze IgG2 of infected and MIL treated groups of hamster. Unpaired two-tailed Student’s t-test was performed and levels of significance are indicated by P values; ns. Non significant.
Analysis of Th1/Th2 mRNA cytokines levels by Real-time PCR
Real-time PCR data revealed that there was noteworthy increased expression levels in the mRNA transcripts of IFN-γ (Fig. 7a, panel AG83), iNOS (Fig. 7b, panel AG83) and significant decreased expression levels in the mRNA transcripts of TGF-β (Fig. 7c, panel AG83) in the MIL treated MIL-S group of animals (AG83-TRE). T9-TRE group of animals showed no significant change in the expression levels of mRNA transcripts of Th1, Th2 cytokines and iNOS with respect to T9-INF group (Fig. 7a–c, panel T9).
Figure 7.
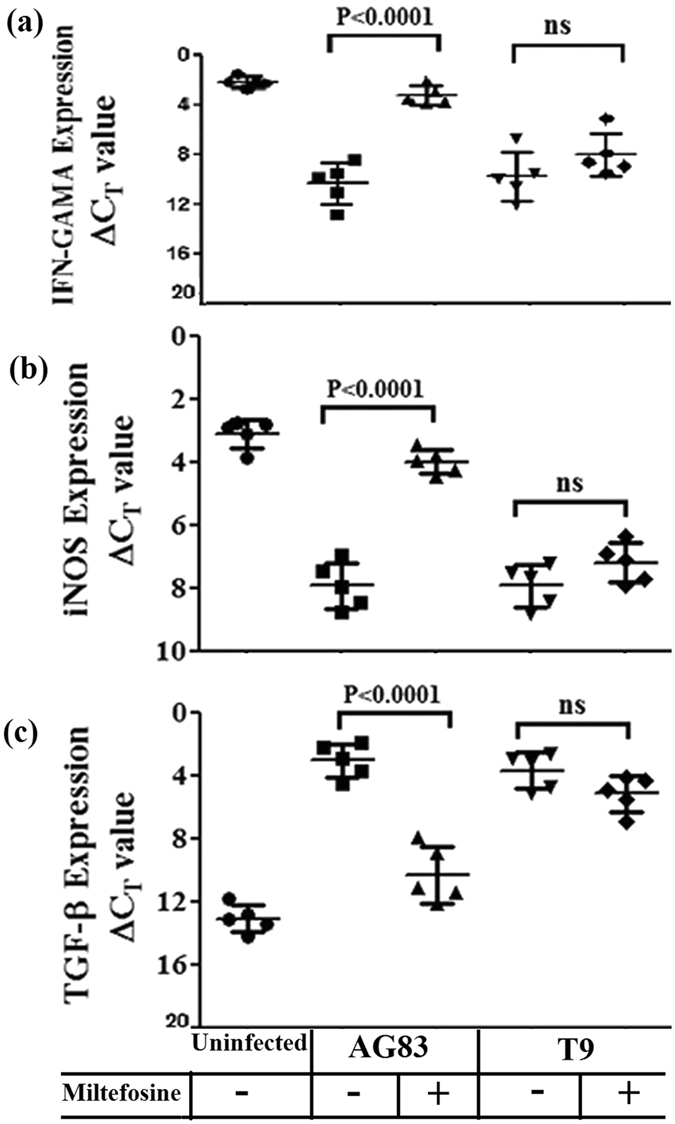
Real-time PCR analysis of mRNAs of Th1 and Th2 cytokines. (a) IFN-γ (b) iNOS (c) TGF-β transcripts were analyzed from uninfected, infected and MIL treated groups of hamsters. Data represents mean ± SD of 5animals per group; unpaired two-tailed Student’s t-test was performed and levels of significance are indicated by P values; ns. Non significant.
Discussion
The common pentavalent antimonials like sodium stibo gluconate (SSG) used for the treatment of VL, necessitate prolonged course of treatment and is losing its efficacy due to increasing parasite resistance. This has emerged as a major difficulty in the treatment and control of VL9. The progression of SSG resistance in the endemic region specially in Bihar, directed that resistance could also come out to the other established anti leishmanial drugs and this may be due to poverty, illiteracy, poor health and HIV/VL-coinfection6, 40, 41.
Miltefosine had been approved in India in 2002 for the treatment of Indian VL patients18, especially cases unresponsive to antimonials and within few years, unresponsiveness to MIL in VL patients20, 21 and failure of MIL in the treatment of KA in Nepal have been reported22. Recently, two MIL-R L. donovani isolates collected from confirmed VL patients of India, were identified by in vitro and genome studies26. Studies related to patients unresponsive towards MIL, laboratory confirmed MIL-R L. donovani and experimentally induced MIL-R L. donovani have been executed previously to demonstrate the role of probable factors in the treatment failure and mechanism of resistance towards the drug MIL22, 27. Function of fatty acid and steroid metabolism in addition to the expression levels of two MIL transporter proteins, LdMT and its specific beta subunit LdRos324, 25 seem responsible for the resistance. It was further suggested that LdMT gene mutation could be employed as a molecular marker for MIL-R L. donovani isolates26.
Earlier studies confirmed that the biochemical actions for SSG uptake are catalyzed either by thiol metabolising genes or antimony transporter genes and several types of ATP Binding Cassette (ABC) transporters are related to multi-drug resistance (MDR)36. We have noticed the increment of 3.4 times of MRPA gene in the putative MIL-R corroborating the observations that in in vitro conditions, the MDR-related proteins [Multidrug Resistant Protein A (MRPA) or P-glycoprotein (PGPA)] have been amplified in different Leishmania spp. in response to different drugs42. The parasites are not able to metabolize MIL itself and can extrude via either exocytosis or probably by ABC transporter protein, such as P-glycoprotein (mdr1)43. These studies considerably increased our knowledge about Miltefosine resistance in clinical isolates of KA. Further studies need to be performed in the natural populations of L. donovani to examine the epidemiology of resistance in order to diminish the harshness of KA. In order to divulge the mechanism of resistance, establishment of in vivo animal model is essential. The phenotypic expression in experimental infection model may be extrapolated to that of the KA patients unresponsive to Miltefosine.
By testing the MIL susceptibility of all the clinical isolates of KA and PKDL in vitro amastigote-macrophage model, we identified one putative MIL resistant (MIL-R) field isolate (study code T9), which is typified as L. donovani by ITS1 RFLP and hsp70 RFLP methods. This finding was supported through the measurement of Th1, Th2 cytokines and level of ROS and NO release from MIL induced macrophages infected with this isolate and then treated with the drug. The measurement of ΔΨm and FITC-conjugated Annexin-V and PI double staining results further corroborated our claim. Experimental MIL-resistant L. donovani isolates showed down regulated expression of LdMT and LdRos3 transporters25. Our study with single field isolate, resistant to MIL also showed the down regulation in the expression of these transporters. The MIL-R fields isolate also showed approximately 3.4 times higher MRPA expression level than MIL-S isolate (Supplementary Fig. S4).
In our attempts to develop the animal model for MIL-R isolate in Golden hamster (Mesocricetus auratus), we carried out our in vivo study with three clinical isolates: AG83 (MIL-S & SSG-S); T8 (MIL-S & SSG-R) and T9 (MIL-R & SSG-S). Hamster is a superior model for VL and expands a progressive, fatal disease which is very closely related to the human symptoms of the disease44, 45. The splenic and hepatic stamps smears revealed the retention of parasite load after MIL treatment in the AG83-TRE and T8-TRE groups of animals of about 3–8%. On contrary, animals infected with MIL-R isolate and then treated with the drug showed retention of 36–69% (average 51.35%) parasites in spleen and 32–62% (average 51.54%) parasites in the liver.
Cell mediated immunity impaired in Leishmania infection is characterized by marked T-cell anergy specific for Leishmanial antigen46. After checking the effects of MIL on treated animals, we became interested to see whether the T-cell anergy occurred during progressive infection, could be reversed by the treatment of MIL. The splenocytes of T9-TRE group of animals failed to proliferate anti leishmanial T-cell in response to leishmanial antigen.
Active VL is also associated with the production of an altered level of antibody44. Significant increase in IgG2 levels in cured animals is surrogate marker of enhanced cell mediated immunity45. Our study revealed that MIL treated hamsters groups: AG83-TRE and T8-TRE showed significantly increased level of IgG2, indirectly indicating development of an effective Th1 type immune response44, 47. In contrast, there was no enhancement of cell mediated immunity in the treated MIL-R infected (T9-TRE) group. This observation further supported through the measurement of mRNA transcripts of Th1 and Th2 cytokines.
Our observations strongly suggested that out of three groups of experimental animals, AG83-TRE and T8-TRE groups of animal were almost cured with MIL treatment but T9-TRE group of animals did not realize recovery establishing the animal model for MIL-R faithfully.
The whole genome analysis of this clinical isolate is in progress.
Methods
Ethics Statements
Bone marrow aspirates were collected from KA patients and approved by the Ethical Committee of the Calcutta National Medical College, Kolkata. The written consent was obtained from legal guardian of the patient (as it was the case of a minor). In the present study, all methods were carried out in accordance with the relevant guidelines.
Clinical isolate from KA Patient and Reference strains
Information concerning the patients’ detail (n = 26) were reported in our previous studies4, 5, 34, 36, 48 and rest (n = 1) was mentioned in supplementary Table SI. L. donovani isolate, AG83 (MHOM/IN/83/AG83) was used as MIL and SSG sensitive standard35, 36. Presence of amastigotes in the bone marrow of the patients were established by Giemsa staining as well as transforming them into promastigote forms in culture medium M199 supplemented with 10% Fetal Bovine Serum (FBS).
Characterization of the isolates by PCR-RFLP method
Genomic DNA was prepared from samples and then categorized them by ITS1-RFLP and hsp70-RFLP methods by using 5UHaeIII (Bioenzyme, USA) enzyme5, 32, 34, 49.
Cell line used for in vitro study
Murine Macrophage (MØ) like tumor cell, RAW 264.7 was maintained in complete RPMI 1640 medium with 10% FBS at 37 °C with 5% CO2 in a humidified atmosphere.
In vitro drug sensitivity assay and determination of EC50 value
Drug sensitivity of intracellular amastigotes was evaluated as stated earlier50. RAW 264.7 cells (MØs) infected with Leishmania isolates were treated either with various concentrations of MIL [0.1 μM, 0.3 μM, 1 μM, 3 μM, 10 μM and 30 μM] or SSG [0.01 μg/mL (0.013 μM), 0.1 μg/mL (0.134 μM), 1 μg/mL (1.34 μM), 10 μg/mL (13.41 μM), 100 μg/mL (134.1 μM)]34 and untreated MØs received only medium. At the endpoints, experimental cover slips were washed and stained with 10% Giemsa (Sigma) and examined under microscope. One hundred MØs per cover slip were scored and no. of intracellular parasites was determined. The values of half maximal effective concentration (EC50) for each of the isolates were anticipated against the both of drugs using GraphPad Prism Software (San Diego, California, USA).
Assay of cytokines
Drug treatments were given to the MØs infected with putative MIL-R isolate T9 along with MIL-S isolates T8 (KA isolate which is SSG-R)34 and AG83 at different concentrations of MIL [0.3 μM, 3 μM & 30 μM]. Then supernatants were collected to measure Th1 (IL-12 and TNF-α) and Th2 (IL-10) cytokines using ELISA kit (BD Biosciences, CA, USA) according to the manufacturer’s protocol.
Quantification of nitric oxide (NO)
NO production was evaluated by the Griess Reagent as described previously39.
Measurement of reactive oxygen species (ROS)
Reactive Oxygen Species (ROS) measured by the cell permeable, nonpolar, H2O2 sensitive probe 2′,7′- Dichlorofluorescein Diacetate (H2DCFDA) as previously described39.
Measurement of mitochondrial trans membrane potential
Transmembrane potential (ΔΨm) was evaluated using JC-1, a lipophilic cationic dye39. Untreated and MIL treated (treated with MIL at a concentration of 40 μM for 72 hrs) Leishmania promastigotes were incubated with JC-1 for 25 min in dark and then washed. Cell pellets were resuspended in PBS and subjected to Flow Cytometry analysis in a BDFACSAria II cell sorter using an excitation wavelength of 488 nm and emissions at 530 nm for green and 590 nm for red fluorescence after appropriate fluorescence compensation and analyzed by FACSDIVA software (BD Biosciences, San Jose, CA, USA).
Annexin V fluorescein isothiocyanate (FITC)- Propidium Iodide (PI) Assay
Double staining for FITC Annexin V-PI was performed as demonstrated earlier39. Briefly, untreated, MIL-treated (72 hrs treatment) promastigotes were washed with PBS. The pellets were resuspended in 1X binding buffer at a concentration of 1 × 10⁶/ml followed by incubation with 5 μl of FITC Annexin V and 1 µg/ml PI for 25 min in dark. Then 400 μl of 1X binding buffer was added and samples were analyzed by Flow Cytometry within 1 hr.
RNA isolation and semi quantitative RT-PCR analysis of the genes responsible for MIL transport
RNA was isolated from samples by disrupting in Trizol solution51 and newly prepared cDNA were then amplified by taking 0.5 μl of cDNA with1 μl 10 mM dNTP, 1.5 μl 50 mM MgCl2, 0.5 μl Taq polymerase as well as gene specific primers (Supplementary Table S2). Amplification reactions were performed with cycling conditions for genes of interest were 5 min at 95 °C, followed by 30 cycles of denaturation at 95 °C for 30 s, annealing at (55°–60 °C) for 30 s and extension at 72 °C for 30 s. PCR-amplified respective gene products were checked by Agarose gel electrophoresis. For Densitometry analyses, the ImageJ software (National Institute of Health) was used and the same band area in Agarose gel was used to find out band intensity and normalized for GAPDH.
Statistical analyses for the in vitro study
Results of all in vitro studies are expressed as mean ± SD. Student’s t test for significance was carried out using GraphPad prism software and P value of <0.05 was considered to be significant. Correlation between the EC50 and other parameters were determined by Spearman rank correlation coefficient and expressed as r36.
Animals for in vivo study
Golden hamsters (Mesocricetus auratus) reared in Institute facilities, were used for the present study with prior approval of the Animal Ethics Committee of the Indian Institute of Chemical Biology, Kolkata, India. All animal experiments were carried out according to the National Regulatory Guidelines issued by Committee for the Purpose of Control and Supervision of Experiments on Animals (CPCSEA), Ministry of Environment and Forest, Govt. of India.
Leishmania isolates used for in vivo study
For the present study, we have taken putative MIL-R (T9) along with T8 and AG83. The isolates were used for comparative analysis.
Selection of MIL doses for in vivo experiments
Hamsters were challenged with freshly transformed Leishmania T9, T8 and AG83 parasites (107parasites/animal) via intra cardiac route52. After 8 weeks of infection, infected animals were treated with MIL at dose of 40 mg/kg (body weight) for 10 consecutive days and were sacrificed on days 45 post treatment44. Hamsters have been grouped in the following ways: Normal: 5 healthy control without challenge infection and treatment with MIL; Infected: each 10 animals were infected with T9, T8 and AG83 respectively and would be represented as T9-INF, T8-INF and AG83-INF respectively; Treated: among 10 infected animals of each group, 5 were treated with MIL. These groups henceforth would be written as T9 -TRE, T8-TRE and AG83-TRE respectively.
Collection of blood and preparation of serum
Blood was collected from hamsters as illustrated earlier39 and kept overnight at 4 °C. Then serum was prepared from collected blood sample.
Determination of Organomegaly and Parasite Burden in spleen and liver
Weight and parasitic burden of spleen and liver from experimental groups of animals were assessed after sacrifice. Splenic and hepatic parasite burden of hamsters of different groups were determined by microscopic evaluation of Giemsa stained tissue imprints method39. Total parasite load in each organ is expressed in LDU unit (Leishman-Donovan Unit). 1 LDU = amastigote per nucleated cell x organ weight in milligram.
Preparation of soluble Leishmanial antigen (SLA)
Leishmanial lysates from washed promastigotes (109/ml) were prepared by several cycles (minimum six) of freezing (−70 °C) and thawing (37 °C) followed by five minutes of incubation on ice53.
T-cell proliferation assay
Splenocytes from studied groups of hamsters were prepared after Ficoll density gradient centrifugation and dissolved in complete RPMI medium and then plated in 96-well plates (at a concentration of 105 cells/well) therefore allowed to proliferate for 72hrs at 37 °C with 5% CO2 either in the presence or absence of SLA (5 μg/ml) or ConA (5 μg/ml). Cells were treated with MTT (0.5 mg/ml) as described earlier39. Then Isopropanol-HCl mixture (0.04%) was used to solubilise the MTT crystals and the absorbance at 570 nm was interpreted at an ELISA plate reader (DTX 800 multimode detector, Beckman Coulter, California).
Measurement of anti leishmanial antibody responses
Serum samples were collected from different groups of hamsters and examined to find out the parasite SLA-specific antibody titer. IgG1 and IgG2 present in the collected sera were measured as stated earlier39.
Real-time PCR to estimate expressions mRNAs of Th1/Th2 cytokines levels
RNA was isolated from the splenocyte of hamsters and 50–100 ng of total RNA was used for synthesis of cDNA. RT-qPCR was done as described elsewhere44. Briefly, it was carried out with 7 μl of SYBR green PCR master mix, 1 μl of cDNA from RT reaction mix and gene specific primers in a final volume of 15 μl. PCR was conducted under the following conditions: initial denaturation at 95 °C for 10 min followed by 40 cycles, each consisting of denaturation at 95 °C for 15 s, annealing at 58 °C for 1 min and extension at 72 °C for 40 s per cycle using the ABI 7500 Real time PCR system and data were analyzed by the comparative CT method45, 54. cDNAs from infected hamsters were used as comparator samples. All quantifications were normalized to the housekeeping gene hypoxanthine phosphoribosyl transferase (HPRT).
Statistical analysis for in vivo study
Statistical level of significance between different groups was calculated by unpaired two-tailed Student’s t-test with GraphPad Prism software (San Diego, California, USA). P < 0.05 were considered to be significant for all analyses.
Electronic supplementary material
Acknowledgements
We sincerely acknowledge the Department of Biotechnology (DBT Twinning Program, BCIL /NER-BPMC/2013), New Delhi, India for financial help. We also acknowledge the Council of Scientific and Industrial Research (CSIR), New Delhi, India for the fellowship of SK and DBT for fellowship of NRS. This work was also supported by the Network Project (Project NWP 0005) and J.C. Bose Fellowship (SB/S2/JCB-65/2014) to SR. We are thankful to the DPI, Higher Education Dept. Govt. of West Bengal, the Principal, Barasat Govt. College, Kolkata, India and the Director, Indian Institute of Chemical Biology, Kolkata. We are grateful to Prof. Shyam Sundar, Institute of Medical Sciences, Banaras Hindu University, Varanasi, India for some clinical isolates of KA.
Author Contributions
S.K. performed all experiments; A.K.D. along with S.K. and M.M. worked in the clinical isolates collection process from the Kala-azar patients and prepared the Giemsa stained slides from bone marrow aspirates for L.D. body identification; S.K. and M.M. stabilized the isolates; N.R.S. transformed and maintained the parasites and assisted S.K. in few experiments; M.M. and S.R. designed the experiments, analyzed and interpreted the data. S.K. and M.M. wrote the manuscript. All authors reviewed the manuscript.
Competing Interests
The authors declare that they have no competing interests.
Footnotes
Electronic supplementary material
Supplementary information accompanies this paper at doi:10.1038/s41598-017-09720-1
Publisher's note: Springer Nature remains neutral with regard to jurisdictional claims in published maps and institutional affiliations.
Contributor Information
Syamal Roy, Email: drsyamalroy@yahoo.com.
Madhumita Manna, Email: madhumita.manna09@gmail.com.
References
- 1.Thakur CP, Kumar K. Post Kala-azar dermal Leishmaniasis: a neglected aspect of Kala-azar control programmes. Ann Trop Med Parasitol. 1992;86:355–359. doi: 10.1080/00034983.1992.11812678. [DOI] [PubMed] [Google Scholar]
- 2.Sundar S. Drug resistance in Indian visceral leishmaniasis. Trop Med Int Health. 2001;6:849–854. doi: 10.1046/j.1365-3156.2001.00778.x. [DOI] [PubMed] [Google Scholar]
- 3.Manna M, Majumder HK, Sundar S, Bhaduri AN. The molecular characterization of clinical isolates from Indian Kala-azar patients by MLEE and RAPD-PCR. Med Sci Monit. 2005;11:BR220–227. [PubMed] [Google Scholar]
- 4.Khanra S, et al. Characterization of the recent clinical isolates of Indian Kala-azar patients by RAPD-PCR method. J Parasit Dis. 2011;35:116–122. doi: 10.1007/s12639-011-0048-1. [DOI] [PMC free article] [PubMed] [Google Scholar]
- 5.Khanra S, et al. RFLPs of ITS, ITS1 and hsp70 amplicons and sequencing of ITS1 of recent clinical isolates of Kala-azar from India and Bangladesh confirms the association of L. tropica with the disease. Acta Trop. 2012;124:229–234. doi: 10.1016/j.actatropica.2012.08.017. [DOI] [PubMed] [Google Scholar]
- 6.Desjeux P, Alvar J. Leishmania/HIV co-infections: epidemiology in Europe. Ann Trop Med Parasitol. 2003;97(suppl 1):3–15. doi: 10.1179/000349803225002499. [DOI] [PubMed] [Google Scholar]
- 7.Dujardin JC. Risk factors in the spread of leishmaniases: towards integrated monitoring? Trends Parasitol. 2006;22:4–6. doi: 10.1016/j.pt.2005.11.004. [DOI] [PubMed] [Google Scholar]
- 8.Lira R, et al. Evidence that the high incidence of treatment failures in Indian Kala-azar is due to the emergence of antimony- resistant strains of Leishmania donovani. J Infect Dis. 1999;180:564–567. doi: 10.1086/314896. [DOI] [PubMed] [Google Scholar]
- 9.Sundar S, et al. Failure of pentavalent antimony in visceral leishmaniasis in India: report from the center of the Indian epidemic. Clin Infect Dis. 2000;31:1104–1107. doi: 10.1086/318121. [DOI] [PubMed] [Google Scholar]
- 10.Jha TK, Giri YN, Singh TK, Jha S. Use of amphotericin B in drug-resistant cases of visceral leishmaniasis in north Bihar, India. Am J Trop Med Hyg. 1995;52:536–538. doi: 10.4269/ajtmh.1995.52.536. [DOI] [PubMed] [Google Scholar]
- 11.Purkait B, et al. Mechanism of amphotericin B resistance in clinical isolates of Leishmania donovani. Antimicrob Agents Chemother. 2011;56:1031–1041. doi: 10.1128/AAC.00030-11. [DOI] [PMC free article] [PubMed] [Google Scholar]
- 12.Moore EM, Lockwood DN. Treatment of visceral leishmaniasis. J Glob Infect Dis. 2010;2(2):151–158. doi: 10.4103/0974-777X.62883. [DOI] [PMC free article] [PubMed] [Google Scholar]
- 13.Croft SL, Neal RA, Pendergast W, Chan JH. The activity of alkyl phosphorylcholines and related derivatives against Leishmania donovani. Biochem Pharmacol. 1987;36:2633–2636. doi: 10.1016/0006-2952(87)90543-0. [DOI] [PubMed] [Google Scholar]
- 14.Escobar P, Matu S, Marques C, Croft SL. Sensitivities of Leishmania species to hexadecylphosphocholine (miltefosine), ET-18- OCH(3) (edelfosine) and amphotericin B. Acta Trop. 2002;81:151–157. doi: 10.1016/S0001-706X(01)00197-8. [DOI] [PubMed] [Google Scholar]
- 15.Croft SL, Snowdon D, Yardley V. The activities of four anticancer alkyllysophospholipids against Leishmania donovani, Trypanosoma cruzi and Trypanosoma brucei. J Antimicrob Chemother. 1996;38:1041–1047. doi: 10.1093/jac/38.6.1041. [DOI] [PubMed] [Google Scholar]
- 16.Seifert K, et al. Effects of miltefosine and other alkylphosphocholines on human intestinal parasite Entamoeba histolytica. Antimicrob Agents Chemother. 2001;45:1505–1510. doi: 10.1128/AAC.45.5.1505-1510.2001. [DOI] [PMC free article] [PubMed] [Google Scholar]
- 17.Walochnik J, et al. Cytotoxic activities of alkylphosphocholines against clinical isolates of Acanthamoeba spp. Antimicrob Agents Chemother. 2002;46:695–701. doi: 10.1128/AAC.46.3.695-701.2002. [DOI] [PMC free article] [PubMed] [Google Scholar]
- 18.Sundar, S. et al. Efficacy of Miltefosine in the treatment of visceral leishmaniasis in India after a decade of use. Clin Infect Dis55, 543–550, doi: 10.1093/cid/cis474 (2012). [DOI] [PubMed]
- 19.World Health Organization (WHO). Control of the leishmaniases. Report of a WHO Expert Committee. World Health Organ Tech Rep Ser949, 1–200 (2010).
- 20.Arif SM, Haque MA, Choudhury AM, Habib AH. Unresponsiveness to miltefosine in visceral leishmaniasis (VL) - an experience of seven cases. J Medicine. 2008;9:105–107. doi: 10.3329/jom.v9i2.1440. [DOI] [Google Scholar]
- 21.Das M, Saudagar P, Sundar S, Dubey VK. Miltefosine-unresponsive Leishmania donovani has a greater ability than miltefosine-responsive L. donovani to resist reactive oxygen species. FEBS J. 2013;280:4807–4815. doi: 10.1111/febs.12449. [DOI] [PubMed] [Google Scholar]
- 22.Rijal S, et al. Increasing failure of miltefosine in the treatment of Kala-azar in Nepal and the potential role of parasite drug resistance, reinfection, or noncompliance. Clin Infect Dis. 2013;56:1530–1538. doi: 10.1093/cid/cit102. [DOI] [PubMed] [Google Scholar]
- 23.Barratt G, Saint-Pierre-Chazalet M, Loiseau PM. Cellular transport and lipid interactions of miltefosine. Curr Drug Metab. 2009;10:247–255. doi: 10.2174/138920009787846332. [DOI] [PubMed] [Google Scholar]
- 24.P´erez-Victoria FJ, et al. Mechanisms of experimental resistance of Leishmania to miltefosine: Implications for clinical use. Drug Resist Updat. 2006;9:26–39. doi: 10.1016/j.drup.2006.04.001. [DOI] [PubMed] [Google Scholar]
- 25.Kumar D, Kulshrestha A, Singh R, Salotra P. In Vitro Susceptibility of Field isolates of Leishmania donovani to miltefosine and amphotericin B: Correlation with Sodium antimony gluconate Susceptibility and implications for treatment in areas of endemicity. Antimicrob Agents Chemother. 2009;53:835–838. doi: 10.1128/AAC.01233-08. [DOI] [PMC free article] [PubMed] [Google Scholar]
- 26.Srivastava S, et al. Laboratory confirmed miltefosine resistant cases of visceral leishmaniasis from India. Parasit Vectors. 2017;10 doi: 10.1186/s13071-017-1969-z. [DOI] [PMC free article] [PubMed] [Google Scholar]
- 27.Mishra J, Singh S. Miltefosine resistance in Leishmania donovani involves suppression of oxidative stress-induced programmed cell death. Exp Parasitol. 2013;135:397–406. doi: 10.1016/j.exppara.2013.08.004. [DOI] [PubMed] [Google Scholar]
- 28.Sacks DL, et al. Indian kala-azar caused by Leishmania tropica. Lancet. 1995;345:959–961. doi: 10.1016/S0140-6736(95)90703-3. [DOI] [PubMed] [Google Scholar]
- 29.Cupolillo E, Grimaldi Junior G, Momen H, Beverley SM. Intergenic region typing (IRT): a rapid molecular approach to the characterization and evolution of Leishmania. Mol Biochem Parasitol. 1995;73:145–155. doi: 10.1016/0166-6851(95)00108-D. [DOI] [PubMed] [Google Scholar]
- 30.Davila AM, Momen H. Internal-transcribed-spacer (ITS) sequences used to explore phylogenetic relationships within Leishmania. Ann Trop Med Parasitol. 2000;94:651–654. doi: 10.1080/00034983.2000.11813588. [DOI] [PubMed] [Google Scholar]
- 31.Victor, K. et al. The gp63 gene locus, a target for genetic characterization of Leishmania belonging to subgenus Viannia. Parasitol117, 1–13 (1998). [PubMed]
- 32.Montalvo AM, et al. Heat-shock protein 70 PCR-RFLP: a universal simple tool for Leishmania species discrimination in the New and Old World. Parasitol. 2010;137:1159–1168. doi: 10.1017/S0031182010000089. [DOI] [PubMed] [Google Scholar]
- 33.Kumar R, et al. Cutaneous Leishmaniasis caused by Leishmania tropica in Bikaner, India: parasite identification and characterization using molecular and immunologic tools. Am J Trop Med Hyg. 2007;76:896–901. [PubMed] [Google Scholar]
- 34.Khanra S, et al. Genetic markers for antimony resistant clinical isolates differentiation from Indian Kala-azar. Acta Trop. 2016;164:177–184. doi: 10.1016/j.actatropica.2016.09.012. [DOI] [PubMed] [Google Scholar]
- 35.Palit P, et al. Discovery of safe and orally effective 4-aminoquinaldine analogues as apoptotic inducers with activity against experimental visceral leishmaniasis. Antimicrob Agents Chemother. 2011;56:432–445. doi: 10.1128/AAC.00700-11. [DOI] [PMC free article] [PubMed] [Google Scholar]
- 36.Mukhopadhyay R, et al. Characterization of antimony-resistant Leishmania donovani isolates: biochemical and biophysical studies and interaction with host cells. Int JParasitol. 2011;41:1311–1321. doi: 10.1016/j.ijpara.2011.07.013. [DOI] [PubMed] [Google Scholar]
- 37.Seifert K, Escobar P, Croft SL. In vitro activity of anti-leishmanial drugs against Leishmania donovani is host cell dependent. J Antimicrob Chemother. 2010;65:508–511. doi: 10.1093/jac/dkp500. [DOI] [PubMed] [Google Scholar]
- 38.Rijal S, et al. Antimonial treatment of visceral leishmaniasis: are current in vitro susceptibility assays adequate for prognosis of in vivo therapy outcome? Microbes Infect. 2007;9:529–535. doi: 10.1016/j.micinf.2007.01.009. [DOI] [PubMed] [Google Scholar]
- 39.Mukherjee S, et al. Imipramine is an orally active drug against both antimony sensitive and resistant Leishmania donovani clinical isolates in experimental infection. PLoS Negl Trop Dis. 2012;6 doi: 10.1371/journal.pntd.0001987. [DOI] [PMC free article] [PubMed] [Google Scholar]
- 40.Sundar S, et al. Clinicoepidemiological study of drug resistance in Indian Kala-azar. BMJ. 1994;308 doi: 10.1136/bmj.308.6924.307. [DOI] [PMC free article] [PubMed] [Google Scholar]
- 41.Sundar S, et al. Resistance to treatment in Kala-azar: speciation of isolates from northeast India. Am J Trop Med Hyg. 2001;65:193–196. doi: 10.4269/ajtmh.2001.65.193. [DOI] [PubMed] [Google Scholar]
- 42.El Fadili, K. et al. Role of the ABC transporter MRPA (PGPA) in antimony resistance in Leishmania infantum axenic and intracellular amastigotes. Antimicrob Agents Chemother49, 1988–1993, doi:10.1128/AAC.49.5 (2005). [DOI] [PMC free article] [PubMed]
- 43.Perez-Victoria, J. M. et al. Alkyl-lysophospholipid resistance in multidrug-resistant Leishmania tropica and chemosensitization by a novel P-glycoprotein-like transporter modulator. Antimicrob Agents Chemother45, 2468–2474, doi: 10.1128/AAC (2001). [DOI] [PMC free article] [PubMed]
- 44.Gupta R, et al. Treatment of Leishmania donovani-infected hamsters with miltefosine: analysis of cytokine mRNA expression by real-time PCR, lymphoproliferation, nitrite production and antibody responses. J Antimicrob Chemother. 2012;67:440–443. doi: 10.1093/jac/dkr485. [DOI] [PubMed] [Google Scholar]
- 45.Samant, M. et al. Immunization with the DNA-Encoding N-Terminal domain of proteophosphoglycan of Leishmania donovani generates Th1-Type immunoprotective response against experimental visceral leishmaniasis. J Immunol183, 470–479, doi:10.4049/jimmunol.0900265 (2009). [DOI] [PubMed]
- 46.Basu R, et al. Kinetoplastid membrane protein- 11 DNAvaccination induces complete protection against both pentavalent antimonial- sensitive and -resistant strains of Leishmania donovani that correlates with inducible nitric oxide synthase activity and IL- 4 generation: evidence for mixed Th1- and Th2-like responses in visceral leishmaniasis. J Immunol. 2005;174:7160–7171. doi: 10.4049/jimmunol.174.11.7160. [DOI] [PubMed] [Google Scholar]
- 47.Paul J, Karmakar S, De T. TLR-mediated distinct IFN-γ/IL-10 pattern induces protective immunity against murine visceral leishmaniasis. Eur J Immunol. 2012;42:2087–2099. doi: 10.1002/eji.201242428. [DOI] [PubMed] [Google Scholar]
- 48.Das S, et al. Modular Multiantigen T Cell epitope–enriched DNA vaccine against human leishmaniasis. Sci Transl Med. 2014;6 doi: 10.1126/scitranslmed.3008222. [DOI] [PubMed] [Google Scholar]
- 49.El Tai NO, et al. Genetic heterogeneity of ribosomal internal transcribed spacer in clinical samples of Leishmania donovani spotted on filter paper as revealed by single-strand conformation polymorphisms and sequencing. Trans R Soc Trop Med Hyg. 2000;94:575–579. doi: 10.1016/S0035-9203(00)90093-2. [DOI] [PubMed] [Google Scholar]
- 50.Sen S, Roy K, Mukherjee S, Mukhopadhyay R, Roy S. Restoration of IFNγR subunit assembly, IFN-γ signaling and parasite clearance in Leishmania donovani infected macrophages: role of membrane cholesterol. PLoS Pathog. 2011;7 doi: 10.1371/journal.ppat.1002229. [DOI] [PMC free article] [PubMed] [Google Scholar]
- 51.Banerjee S, et al. Designing therapies against experimental visceral leishmaniasis by modulating the membrane fluidity of antigen-presenting cells. Infect Immun. 2009;77:2330–2342. doi: 10.1128/IAI.00057-09. [DOI] [PMC free article] [PubMed] [Google Scholar]
- 52.Guha R, et al. Vaccination with Leishmania Hemoglobin Receptor- Encoding DNA Protects Against Visceral Leishmaniasis. Sci Transl Med. 2013;5 doi: 10.1126/scitranslmed.3006406. [DOI] [PubMed] [Google Scholar]
- 53.Datta S, et al. Therapeutic immunization with radio-attenuated Leishmania parasites through i.m. route revealed protection against the experimental murine visceral leishmaniasis. Parasitol Res. 2012;111:361–369. doi: 10.1007/s00436-012-2847-4. [DOI] [PubMed] [Google Scholar]
- 54.Guha R, et al. Antimony resistant Leishmania donovani but not sensitive ones drives greater frequency of potent TR regulatory cells upon interaction with human PBMCs: Role of IL-10 and TGF-β in early immune response. PLoS Negl Trop Dis. 2014;8 doi: 10.1371/journal.pntd.0002995. [DOI] [PMC free article] [PubMed] [Google Scholar]
Associated Data
This section collects any data citations, data availability statements, or supplementary materials included in this article.