

ABSTRACT
The composition and activity of the microbiota in the human gastrointestinal tract are primarily shaped by nutrients derived from either food or the host. Bacteria colonizing the mucus layer have evolved to use mucin as a carbon and energy source. One of the members of the mucosa-associated microbiota is Akkermansia muciniphila, which is capable of producing an extensive repertoire of mucin-degrading enzymes. To further study the substrate utilization abilities of A. muciniphila, we constructed a genome-scale metabolic model to test amino acid auxotrophy, vitamin biosynthesis, and sugar-degrading capacities. The model-supported predictions were validated by in vitro experiments, which showed A. muciniphila to be able to utilize the mucin-derived monosaccharides fucose, galactose, and N-acetylglucosamine. Growth was also observed on N-acetylgalactosamine, even though the metabolic model did not predict this. The uptake of these sugars, as well as the nonmucin sugar glucose, was enhanced in the presence of mucin, indicating that additional mucin-derived components are needed for optimal growth. An analysis of whole-transcriptome sequencing (RNA-Seq) comparing the gene expression of A. muciniphila grown on mucin with that of the same bacterium grown on glucose confirmed the activity of the genes involved in mucin degradation and revealed most of these to be upregulated in the presence of mucin. The transcriptional response was confirmed by a proteome analysis, altogether revealing a hierarchy in the use of sugars and reflecting the adaptation of A. muciniphila to the mucosal environment. In conclusion, these findings provide molecular insights into the lifestyle of A. muciniphila and further confirm its role as a mucin specialist in the gut.
IMPORTANCE Akkermansia muciniphila is among the most abundant mucosal bacteria in humans and in a wide range of other animals. Recently, A. muciniphila has attracted considerable attention because of its capacity to protect against diet-induced obesity in mouse models. However, the physiology of A. muciniphila has not been studied in detail. Hence, we constructed a genome-scale model and describe its validation by transcriptomic and proteomic approaches on bacterial cells grown on mucus and glucose, a nonmucus sugar. The results provide detailed molecular insight into the mucus-degrading lifestyle of A. muciniphila and further confirm the role of this mucin specialist in producing propionate and acetate under conditions of the intestinal tract.
KEYWORDS: Akkermansia, acetate, gut microbiota, metabolic modeling, mucin, propionate, proteomics, transcriptomics
INTRODUCTION
Microbial community composition and activity in the human intestinal tract are largely dependent on the nutrition sources accessible to the gut microbiota (1–4). The availability of diet-derived nutrients changes according to the diet of the host, whereas host-derived nutrients, such as mucin, are constantly available. Therefore, the capacity to use host-derived glycans can confer a competitive advantage to the bacteria residing in the gut (5, 6).
The intestinal mucus layer is one of the most important niches in the gut where microbes and the host are closely interacting. Mucus consists mainly of the heavily glycosylated Muc2 and serves several purposes. It acts as a lubricant for food passing over membranes, as a selective barrier to allow the passage of nutrients to the epithelial cells, and as a protective system against mechanical damage or harmful substances such as pathogens and toxins (7). Regarding the commensal microbiota, the mucus layer offers the bacteria substrates for growth, adhesion, and protection (8). Oppositely, the microbiota composition has been shown to influence mucus barrier properties, with bacterial species commonly related to inflammatory conditions increasing the permeability of the mucus layer and thus decreasing the barrier function (9).
The mucus layer covers the entire intestinal tract and can be divided into inner and outer layers in the stomach and the colon, whereas the small intestine has only one layer. There are strong indications that commensal bacteria in the colon thrive only in the outer layer, whereas the inner layer is meant to keep the bacteria at a distance from the epithelial cells and to enforce immune tolerance in the gut by delivering antimicrobial proteins and IgA (10, 11). Mucins, the main components of the mucus layer, are large glycoproteins secreted by goblet cells in the epithelium and consist of protein backbones decorated with a variety of carbohydrate chains. The main sugar monomers present in mucin are fucose, galactose, N-acetylgalactosamine (GalNAc), and N-acetylglucosamine (GlcNAc); in some cases, they are modified with sialic acid (N-acetylneuraminic acid) and sulfate. These glycans are attached to the protein backbone via O-glycosidic linkages to serine and threonine residues (11).
One of the key players in the mucus-associated microbiota is Akkermansia muciniphila, which colonizes a considerable proportion of the human population (12). A. muciniphila is the only member of the Verrucomicrobia phylum isolated from the human intestine, and its presence has been detected in many other animal species (13). It has been associated with a healthy intestine, and numbers of A. muciniphila in the gut are inversely correlated with inflammatory bowel diseases (14, 15), appendicitis (16), obesity (17, 18), and diabetes (19, 20). A. muciniphila seems to be highly adapted to its living environment, as it has a great capacity for breaking down mucin. An analysis of its 2.7-Mb genome predicted 61 proteins (2.8% of all proteins) involved in the degradation of mucin (21, 22). These enzymes include various proteases, sulfatases, and glycosyl hydrolases, including sialidases (23).
A. muciniphila was previously shown to produce acetate and propionate during its growth on mucin (24). A. muciniphila is also able to grow on glucose or the mucin-derived amino sugars GlcNAc and GalNAc, albeit much less efficiently than on mucin, and only in the presence of large amounts of peptone, tryptone, casitone, and yeast extract (24). A. muciniphila growth on purified mucin O-glycans, fucose, GlcNAc, and GalNAc was recently described using a rich undefined medium based on chopped meat broth (25). However, the specific substrate requirements, enzyme activities, and metabolic pathways behind these observations are not well described. Moreover, the physiological growth parameters during growth on nonmucus substrates have been poorly described. Finally, the annotation of the A. muciniphila genome suggested several pathways (21), but these have not been further validated or experimentally confirmed.
Metabolic reconstructions aggregate all the reactions identified in the annotated genome of an organism. Constraint-based models provide the mathematical framework to explore the metabolic potential of the living system and enable the prediction of degradation capabilities, carbon source utilization, and growth rates (26). We constructed a genome-scale constraint-based metabolic model for A. muciniphila and validated this with in vitro growth experiments and measurements of its main metabolites, as well as global transcriptomic and proteomic responses as readouts, based on whole-transcriptome sequencing (RNA-Seq) and advanced mass spectrometry, respectively. In addition to this, we compared the metabolic responses of the bacteria grown on mucin to those of bacteria grown on mucin-derived monosaccharides and the nonmucin sugar glucose. The results were used to identify mucin-specific pathways and provided indications for the hierarchal use of sugar sources, reflecting the adaptation of A. muciniphila to a mucus-degrading lifestyle.
(The article includes content that first appeared in the dissertation of N. Ottman (27) in partial fulfillment of the requirements for a Ph.D. degree from Wageningen University, Wageningen, the Netherlands.)
RESULTS AND DISCUSSION
We have reconstructed a genome-scale constraint-based metabolic model of A. muciniphila based on the complete genome sequence that we previously reported (21). The model, named iAkkMuc_588, can be found in Data Set S1 in the supplemental material. The model contains all reactions required to generate the macromolecular components of the biomass, lipid precursors, various vitamins such as biotin and B12, and cofactors such as NADPH, coenzyme A (CoA), and flavin adenine dinucleotide (FAD). The model comprises a total of 744 reactions, of which 72 are transport reactions and 63 are exchange reactions required to simulate growth on a mucin-like medium. In the model, a total of 540 unique metabolites are interconverted. A total of 588 genes are associated with the reactions, while 74 reactions are without a gene-protein-reaction (GPR) association. Metabolite identifiers include IUPAC international chemical identifier (InChI) strings (28) so that the model can be mapped to other external databases such as KEGG or other metabolic models.
Since the molecular composition of the preferred substrate mucin or the used tryptone cannot be quantified exactly, a detailed analysis of yields cannot be made; hence, the metabolic model is unable to accurately predict growth rates. However, the model was able to qualitatively simulate the metabolic capacities of A. muciniphila. The model predicted A. muciniphila to be able to synthesize all the essential amino acids, including the amino acids which are abundantly present in mucin (serine, cysteine, and proline), with the exception of threonine. The genomes of all the other members of the Verrucomicrobia phylum encode the enzymes required for the synthesis of threonine from homoserine, but these are missing from the A. muciniphila genome. As threonine is abundantly present in mucin (29), threonine autotrophy is likely to be a consequence of adaptation to the mucosal environment.
Furthermore, according to the initial metabolic model, A. muciniphila is able to individually metabolize all the main sugars present in mucin (fucose, galactose, GlcNAc, and N-acetylneuraminic acid), except for GalNAc, for which no good reference degradation pathway was present in the MetaCyc database (30) at the time of model development. Hence, a mucin-free medium containing threonine and the amino acid source tryptone, termed basal tryptone threonine medium (BTTM), was designed to test A. muciniphila growth on single sugars. The model-based predicted fermentation profiles for the monomeric sugars are shown in Table 1.
TABLE 1.
Summary reactions and thermodynamic parameters of mucin-derived sugar degradation by A. muciniphilaa
| Substrate | Degradation reaction | ΔrG′m (kJ/mol) | ΔrG′° (kJ/mol) |
|---|---|---|---|
| Glucose | Glucose (aq) ↔ 4/3 propionate (aq) + 2/3 acetate (aq) + 2/3 CO2 (aq) + 2/3 H2O (l) | −340.1 | −311.6 |
| Galactose | Galactose (aq) ↔ 4/3 propionate (aq) + 2/3 acetate (aq) + 2/3 CO2 (aq) + 2/3 H2O (l) | −347.1 | −318.5 |
| Fucose | Fucose (aq) + 1/3 H2O (l) ↔ 1,2-propanediol (aq) + 2/3 acetate (aq) + 1/3 propionate (aq) + 2/3 CO2 (aq) | −187.3 | −158.8 |
| GlcNAc | N-Acetyl-d-glucosamine (aq) + 4/3 H2O (l) ↔ 5/3 acetate (aq) + ammonia (aq) + 4/3 propionate (aq) + 2/3 CO2 (aq) | −375.6 | −312.9 |
| GalNAc | N-Acetyl-d-galactosamine (aq) + 4/3 H2O (l) ↔ 5/3 acetate (aq) + 3/3 ammonia (aq) + 4/3 propionate (aq) + 2/3 CO2 (aq) | −376.1 | −313.3 |
| NeuAc | N-Acetylneuraminate (aq) + 5/3 H2O (l) ↔ 5/3 propionate (aq) + 7/3 acetate (aq) + 4/3 CO2 (aq) + ammonia (aq) | −477.2 | −385.9 |
ΔrG′° is the standard reaction Gibbs energy (1 M). ΔrG′m is the reaction Gibbs energy with 1 mM standard, which is more suitable for comparing reactions in biological settings. The large negative numbers indicate thermodynamically favorable events and potentially more favorable kinetics for the amino-sugars. The summary pathways for the degradation of sugars were derived from the constructed metabolic model.
Qualitative testing of the model.
It was confirmed that A. muciniphila could grow, but with limited efficiency, on fucose, GlcNAc, and GalNAc as the main energy source in BTTM (see Fig. S2B, C, and D). Therefore, for GalNAc, the metabolic model did not reflect the in vitro findings, as it did not predict growth on this substrate. Measuring growth rates was in some cases challenging because a clear exponential phase was absent, suggesting that some unknown limitation was occurring. However, it was obvious that growth rates on single sugars were markedly lower than those on mucin (Table 2; see also Data Set S2). Moreover, while GlcNAc, GalNAc, and to some extent fucose supported growth, N-acetylneuraminic did not (see Fig. S3). The utilization of fucose was confirmed by the presence of 1,2-propanediol, an end product of this sugar fermentation, in the culture supernatant (Fig. S2C). Galactose did not support growth in our in vitro experiments (Fig. S2F), even though the genomic model predicted the ability to ferment galactose through the Leloir pathway. We proceeded to test the utilization of galactose in combination with mucin and observed that galactose was not only taken up but was depleted very rapidly, between 15 and 24 h (Fig. 1G). This suggests that A. muciniphila indeed has a system for efficient galactose metabolism, but additional mucin-derived components are needed for growth. The galactose transporter has not been identified in A. muciniphila and, as there are several steps in the metabolic process, further research is needed to recognize the inducible genes.
TABLE 2.
Growth rates of A. muciniphila on the carbon and nitrogen sources used in the study
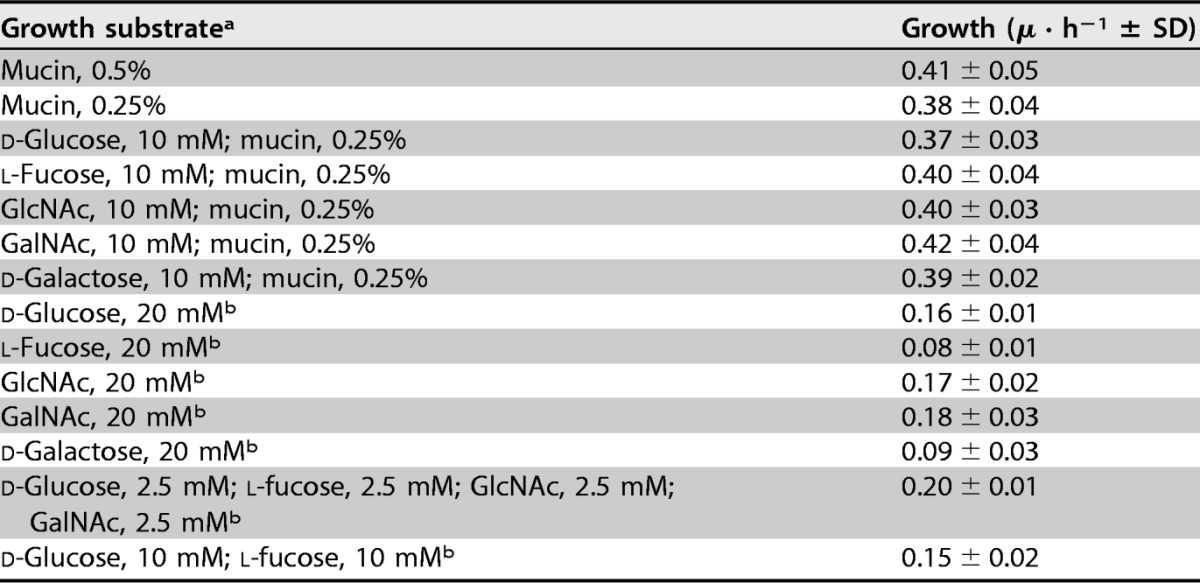
a GlcNAc, N-acetylglucosamine; GalNAc, N-acetylgalactosamine.
b Medium was supplemented with l-threonine (10 mM) and tryptone (8 g/liter).
FIG 1.

A. muciniphila degrades single sugars more efficiently in the presence of mucin. Decreasing the concentration of mucin from 0.5% (A) to 0.25% (B) decreases yield, but this can be compensated for by the addition of single sugars (C to G). Added sugars, including fucose and galactose, are depleted within 48 h of growth. Values represent means from three replicate experiments.
A. muciniphila was also able to grow on BTTM when the nonmucin sugar glucose was added as a carbon source (Fig. S2A). Interestingly, growth on glucose was exponential, but only ∼6 mM glucose was utilized, after which the optical density at 600 nm (OD600) dropped and glucose utilization slowed considerably. A similar trend was observed when A. muciniphila was grown on a mixture of glucose and fucose (Fig. S2E). This indicates a depletion of an unknown factor or factors, possibly amino acids or proteins, which prevents further utilization of glucose and growth. Conversely, when grown on GlcNAc or GalNAc, the exponential phase was very short, after which the OD600 increased linearly until the end of measurements (100 h of incubation) and substrate utilization was stable (Fig. S2B and D).
The main difference between these sugars and glucose and fucose is the presence of an N-acetyl group in GlcNAc and GalNAc. One benefit of metabolizing amino sugars is the production of ammonia, which can neutralize the environment and is acidified as a result of carbohydrate catabolism to organic acids, such as acetate and propionate. Furthermore, the production of ammonia inside cells has the dual advantage of neutralizing the cytoplasm and providing a nitrogen source. This eliminates the need to devote energy to transporting ammonium ions or other nitrogen sources from the environment.
The growth of A. muciniphila on BTTM with a mixture of the single sugars (fucose, glucose, GlcNAc, and GalNAc [2.5 mM each]) resulted in cometabolism of all the sugars but with different consumption rates (Fig. S2G). The consumption of glucose and fucose was three times faster than the consumption of GlcNAc and GalNAc at the 20-h time point. GlcNAc and GalNAc still remained in the medium after 100 h of incubation. After the depletion of glucose and fucose, growth (as measured by OD600) increased linearly and no dip was observed, unlike in the case with glucose alone or in combination with fucose. This faster and longer growth indicates that the culture with a mixture of sugars shows the combined characteristics of A. muciniphila grown on both nonamino sugars (glucose and fucose) as well as on hexosamines (GlcNAc and GalNAc). A simple explanation could be that the amino sugars serve as a nitrogen source and the nonamino sugars glucose and fucose are rapidly transported and used for energy generation.
The cometabolism of sugars could be a consequence of the adaptation of A. muciniphila to the mucin environment, where a mixture of sugars is constantly present and the bacteria produce simultaneously a wide range of enzymes to degrade them. To our surprise, the nonamino sugars were preferred over the thermodynamically more favorable hexosamines (Table 1). This could be some form of catabolite repression of monosaccharides, even though the canonical catabolite repression protein was not found to be encoded by the genome of A. muciniphila. The release and subsequent consumption of fucose, galactose, and sialic acid from mucin by A. muciniphila were observed using high-performance anion-exchange chromatography (31). However, the exact degradation pattern of mucin by A. muciniphila is not known, and the faster consumption of fucose in comparison to GlcNAc and GalNAc may reflect the manner of degradation taking place in vivo. The faster uptake of glucose in the presence of mucin-derived sugars may also reflect the situation in the gut, where glucose may be derived from consumed polysaccharides that end up in the colonic lumen, while mucus is derived from the goblet cells embedded in the mucosa. Interestingly, genes for two alpha-amylases and an alpha-glucosidase were identified in the annotated genome (Amuc_1637, Amuc_1812, and Amuc_1187, respectively), the expression of which was found to be upregulated on glucose in comparison to mucin (see Data Set S2). We also tested the growth of A. muciniphila on the di- and trisaccharides maltose, melibiose, trehalose, and raffinose but observed no growth or metabolic activity (data not shown), suggesting that glucose is a preferred substrate.
Eventually, all the tested sugars ended up in glycolysis, but the routes leading up to it and the final fermentation profiles were found to be different, as depicted in Fig. 2. Differences in the growth kinetics of A. muciniphila grown on glucose as opposed to mucin-derived sugars may be due to the transcriptional regulation of transporters or kinases in response to environmental conditions. Overall, these data indicate that the high-energy nitrogen-carbon compounds are important for A. muciniphila. This reflects the adaptation of A. muciniphila to the intestinal environment, as GlcNAc and GalNAc are abundant in mucin.
FIG 2.

Overview of reactions for mucin degradation and carbon metabolism in A. muciniphila. Reactions, gene associations, and reaction directionality reflect the content of the constraint-based model iAkkMuc_586.
Quantitative testing of the model.
Our results indicate that the BTTM with single sugars added as carbon sources does not support optimal growth, as the growth rates were higher on mucin medium (P < 0.001) (Data Set S2). When grown on 0.5% mucin, A. muciniphila grew to an OD600 of ∼2.5 and produced acetate and propionate and small amounts of 1,2-propanediol and succinate (Fig. 1A). As the exact decomposition process for mucin is unknown, the expected ratios of fermentation products cannot be predicted. Assuming that mucin contains the substrate molecules essential for optimal growth, we set out to lower the mucin concentration and compensate the carbon availability by adding single sugars. A reduction of the concentration of mucin from 0.5% to 0.25% resulted in lower biomass yields (OD600 of ∼1.4) and also halved the amounts of fermentation products, indicating that substrate availability is the limiting factor (Fig. 1B). The addition of 10 mM concentrations of the tested individual sugars together with 0.25% mucin partially compensated for the decreases in OD600 and amounts of fermentation products (Fig. 1C to G). This in turn implies that the energy source limits the growth. More importantly, all the sugars, including fucose and galactose, were used by A. muciniphila and were depleted 48 h after incubation.
Based on the metabolic model, a 1:2 ratio of acetate to propionate was predicted to be produced when the bacteria were grown on glucose as the sole carbon source, but we detected equal amounts of these fermentation products. For growth on GlcNAc and GalNAc, a 5:4 ratio of acetate to propionate was expected, but we observed 1.5 to 2 times more acetate than propionate. The carbon recovery for glucose, GlcNAc, and GalNAc cultures was 80 to 90%. These discrepancies between the metabolic model and the experimental data suggest the presence of an alternative fermentation product and electron sink. While the model predicted the potential production of sulfide, this has not been detected in A. muciniphila (24). However, high-performance liquid chromatography (HPLC) results indicated that sometimes succinate, which is an intermediate compound in the propionate pathway, was produced and may partially explain the higher-than-expected acetate-to-propionate ratios. Succinate production cooccurred with high growth rates and long exponential phases, as cultures with glucose or mucin as the carbon source showed higher succinate levels than other cultures (Fig. 1A and C; see also Fig. S2A). Under these conditions, conversion from succinate to propionate seems to be a metabolic bottleneck, and as excess succinate is accumulated, it is excreted outside the cell. In Bacteroides, the balance between succinate and propionate is controlled by both CO2 and vitamin B12 availability (32). Higher succinate levels can be a means to reduce CO2 levels, because the conversion of succinate to propionate releases CO2. It may also be that during fast growth, the rate of B12 uptake limits the conversion of succinate to propionate, as B12 is the cofactor for methylmalonyl-CoA mutase, which is required in the process. The uptake of succinate at the stationary phase suggests that there is an energetic gain from further metabolizing it into propionate (Fig. 1A and C). This is supported by the model, where the final step is coupled to sodium transport, which in turn fuels proton translocation and ATP generation (Fig. 2; see also Data Set S1).
Interestingly, acetate is not produced from acetyl-CoA via the commonly used acetate kinase. Instead, the CoA group is transferred to succinate to generate succinyl-CoA, an intermediate of the propionate cycle, and conversely, ATP is generated via the succinyl-CoA ligase complex. This link between the acetate and propionate pathways may serve to enhance the thermodynamic properties of the primary ATP-generating pathways.
As predicted by the metabolic model, 1,2-propanediol was produced when A. muciniphila was grown on fucose as the sole carbon source. However, the ratio of 1,2-propanediol produced relative to acetate and propionate (3:2:1) was lower than predicted. The carbon recovery for A. muciniphila cultures grown on fucose was 87%. The amount of 1,2-propanediol should be equal to the amount of fucose consumed, but we observed less than 1 mM 1,2-propanediol after consumption of 6 mM fucose (Fig. S2C). Furthermore, the levels of propionate production were higher than expected (Fig. S2C). A pathway in which 1,2-propanediol is converted to propionate exists in some members of the gut microbiota (33), and recently it was shown that Eubacterium hallii utilizes 1,2-propanediol in a cobalamin-dependent manner to form propionate (34). However, the genes required for these conversions are not present in A. muciniphila.
It was previously shown that growth rates and bacterial cell yields are higher on oligosaccharides than on their monomeric moieties (35–37). It can be speculated that A. muciniphila substrate transporter systems are designed for oligosaccharide transport, and metabolic features have been optimized for growth on complex carbohydrates. In line with this is the expression of a carbohydrate-selective porin gene (Amuc_1085) that is highly induced during growth on mucin (Data Set S2).
For practical reasons, our model was validated with hog gastric mucin. While this mucin resembles that of human colonic mucin, notably for the nature of the sugar modifications, small differences in the relative sugar ratios cannot be excluded (11, 38). Moreover, the protein backbone differs (primarily Muc5 and Muc6 in gastric mucus and Muc2 in colonic mucus), but the general protein composition is highly similar, and it is known that A. muciniphila can use the protein moieties of both Muc5 and Muc2 (14, 24).
Transcriptomic and proteomic responses to A. muciniphila growth on mucin and glucose.
To answer some of the questions that arose from the growth experiments, whole-genome transcriptome analyses of A. muciniphila grown on mucin, glucose, and a mixture of the two were performed. In addition, we analyzed the proteomes of A. muciniphila grown on mucin and glucose with mass spectrometry. The proteome analysis showed results highly similar to the transcriptional response, corroborating the findings from both methods (Fig. 3; see also Data Set S2). As the similarity is so high (Spearman rank coefficient, 0.581), we focus here mainly on the transcriptome data, as these were deeper and more global than the proteome results.
FIG 3.

Correlation between fold change in relative abundance at the transcript and protein levels. Fold changes indicate differences between A. muciniphila grown on mucin and glucose. Large filled circles represent genes that were significantly differentially abundant at both levels. Positive values correspond to the mucin condition while negative values reflect the glucose condition. (Spearman rank coefficient = 0.581.).
Comparison of the transcriptomic analyses revealed the largest difference in responses between the mucin- and glucose-grown cultures, while that of a culture grown on the mixture of mucin and glucose was more similar to that of the mucin-grown culture (Fig. 4; see also Fig. S4). Differential gene expression (DGE) showed only 57 genes to be significantly (P < 0.05) differentially expressed between the mucin and the mixture (mucin plus glucose) cultures (Data Set S2). In the mixture cultures, decreased levels of expression were observed for genes encoding hydrolases (see Fig. S5), indicating a potential lower requirement for carbohydrate sources normally obtained by release from the mucin substrate. Among the upregulated genes were those encoding glycosyl transferases and a glucokinase (Amuc_1094) (Data Set S2). A comparison of the glucose and the mucin cultures showed many more genes to be significantly differentially expressed (1,074 in total, and 657 more than 2-fold; Data Set S2). In addition to the processes already seen in the comparison between the mixture and the mucin cultures, genes involved in protein biosynthesis and energy metabolism were upregulated under the mucin condition (Fig. S5). The mass spectrometry analysis of the A. muciniphila proteome identified peptides from 1,129 proteins (52% of all predicted protein-coding sequences). The abundances of 207 proteins differed significantly (fold change ≥2, P < 0.05) between mucin and glucose-grown A. muciniphila cultures.
FIG 4.
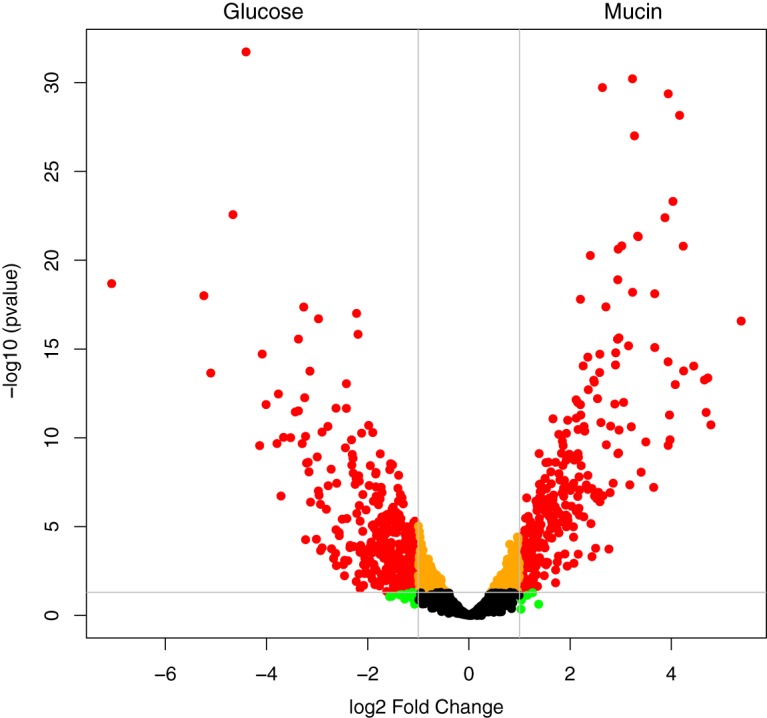
Volcano plot of the distribution of gene expression for A. muciniphila grown on glucose versus mucin. Positive fold change indicates upregulation under the mucin condition. Red data points indicate genes having a P of < 0.05 and fold change ≥2.
Several genes encoding ribosomal proteins, tRNA-charging proteins, and most amino acid biosynthesis pathways were upregulated during growth on mucin compared with those during growth on glucose. Sampling times were selected to capture the mid-exponential growth phase (see Fig. S1). However, because of the specialization of A. muciniphila in mucin degradation, the growth rate on mucin is higher than on the other media, which is reflected in the upregulation of genes associated with the indicated translation processes. Biosynthesis pathways for cysteine, proline, glutamate, and glutamine were downregulated. Since both cysteine and proline are highly abundant in the mucin protein backbone, this likely reflects the uptake of these amino acids. Interestingly, the incorporation of ammonia via glutamine synthase (Amuc_1252) was downregulated under mucin conditions, indicating a reduced requirement for ammonia assimilation.
Glutamate decarboxylase (Amuc_0372) was significantly upregulated in glucose cultures at both the transcriptome and proteome levels (Data Set S2). The glutamate decarboxylase (GAD) system is known to be activated in response to acid stress and multiple other stresses in many bacteria (39). Oxidative stress response (Amuc_1466 and Amuc_2070) and nucleotide excision repair (Amuc_1452, Amuc_1555, Amuc_1237, Amuc_0683, Amuc_1938, and Amuc_0011) genes were also upregulated in the glucose cultures, indicating the organism is dealing with a nonoptimal stressful environment (Data Set S2). Other processes upregulated in the glucose cultures were polysaccharide biosynthesis (Amuc_2096, Amuc_2077, and Amuc_2078) and inorganic ion transport and motility (Amuc_0166, Amuc_1101, and Amuc_1584).
A total of 30 hydrolases implicated in mucin degradation were significantly upregulated under the mucin condition compared with those on glucose, and 17 of these were also significantly more abundant in the proteome analysis (Data Set S2). Conversely, under the glucose condition, 15 glycosyl transferases were significantly upregulated, including the entire gene cluster Amuc_2079 to Amuc_2098, which contains nine glycosyl transferases. It is likely that A. muciniphila can produce exopolysaccharides (EPS) as a protection to the sometimes harsh conditions present in the intestinal environment. Moreover, the production of EPS appears to be induced by glucose, and this is likely to be the case when A. muciniphila is no longer located in the protecting mucus layer but has a luminal location where other intestinal bacteria are competing for food-derived substrates, such as glucose.
Of the 12 sulfatases found in the genome of A. muciniphila, six were significantly upregulated under the mucin condition, along with the sulfate transporter (Amuc_0840). On the proteome level, one of the sulfatases (Amuc_0491) and the sulfate transporter (Amuc_0840) were also significantly more abundant under the mucin condition than under the glucose condition (Data Set S2). Mucin contains substantial levels of sulfate covalently bound to the oligosaccharide chains (40), and the sulfatases produced by A. muciniphila most likely desulfate this to increase the susceptibility of the mucin to degradation by other mucin-degrading enzymes (31). Recently, control experiments, aimed to explain the gut bacterial response in fiber-deprived mice, revealed the upregulation of a number of glycosyl hydrolases when A. muciniphila was grown on purified mucin O-glycans compared with that grown on GlcNAc (25). The study confirmed the upregulation of a few sulfatase genes during growth on mucin O-glycans. However, the reported transcriptome analysis covered only 681 A. muciniphila genes, whereas here, we describe the expression of 2,138 genes. Of all the significantly differentially expressed hypothetical proteins, a total of 41 proteins (over 70%) were upregulated in the glucose cultures. More insight on the adaption of A. muciniphila to glucose could be gained by further research on the functions of these proteins.
The transcriptome and proteome data were also used to verify the metabolic model of A. muciniphila and its visualization (Fig. 2). Analysis of the gene and protein expression data showed that genes underlying the reactions included in the model were expressed under the described conditions.
The identified GlcNAc transporters, Amuc_0502 and Amuc_0516, are among the most highly upregulated genes under the mucin condition compared with those from growth on glucose. Upregulation of the N-acetylglucosamine deacetylase (Amuc_1918) indicates a possible GlcNAc degradation mechanism through the acetate-producing conversion to glucosamine and subsequent conversion to glucose. However, the gene associated with the glucosamine deaminase reaction is not known, and this reaction has been included without an associated gene in the model. Moreover, the downregulation of the glucokinases (Amuc_0097 and Amuc_1094) under the mucin condition, together with the upregulation of the 6-phosphofructokinases Amuc_0210, at transcript level, and Amuc_1481, at the protein level, point to the prominent role of the upregulated glucosamine-6-phosphate deaminase (Amuc_1822) in GlcNAc degradation. We conclude that GlcNAc entry into glycolysis proceeds through its conversion to fructose-6-phosphate.
Gene expression in lower glycolysis (from glyceraldehyde-3-phosphate to pyruvate) is also generally upregulated under the mucin condition, consistent with the observed higher growth rate. The expression data also point to the major role of succinate for energy generation. Succinate production in the higher growth phase is promoted by the upregulation of the malate dehydrogenase (Amuc_2106) and the succinate dehydrogenase complex (Amuc_0984 to Amuc_0986). Genes associated with reactions leading to propionyl-CoA or acetyl-CoA formation remain either unchanged or upregulated (Amuc_2034 and Amuc_1543). The upregulation of the formate acetyltransferase (Amuc_1543), both at the transcript and protein levels, indicates a possible formate accumulation under mucin growing conditions. It is not possible to assess the relative production rates of acetate and propionate from the expression data, given that CoA group transfer to succinate to form succinyl-CoA is performed in both cases by Amuc_0206, which remains largely unchanged. Nevertheless, the upregulation of the succinyl-CoA ligase (Amuc_1712 and Amuc_1713) indicates that this might be a preferred ATP generation mechanism.
The genomic diversity of A. muciniphila strains has recently been addressed in various studies, including whole-genome assembly, a metagenomic analysis of single nucleotide variations, and a genomic analysis of new isolates (41–43). The sequences of the obtained genomes showed high similarity to those of the type strain analyzed here, including the genes involved in mucin degradation. Nevertheless, it remains to be explored what variations exist between A. muciniphila strains and to what extent these might help explain differences between humans in the acquisition and retention of these mucolytic strains in early life or following fecal microbiota transfer.
In conclusion, the transcriptome and proteome analyses, together with the analysis of metabolic end products of A. muciniphila grown under different conditions, allowed for the validation of the genome-based metabolic model, the predicted pathways, and the metabolic end products. Notably, the production of propionate in the mucosa is of interest, as this short-chain fatty acid is known to increase satiety in humans and is involved in metabolic and immune signaling (44, 45). Moreover, the global analysis of the response to mucin and its components demonstrates the adaptation of A. muciniphila to the mucosal environment. Altogether, the results presented here provide a knowledge-based platform for further studies aimed at understanding, and possibly predicting, the potential health-promoting roles of this mucosal symbiont.
MATERIALS AND METHODS
Bacterial growth conditions.
Akkermansia muciniphila MucT (ATCC BAA-835) was grown in a basal medium as described previously (24) supplemented with 1 mM l-threonine and 10 g/liter tryptone (BTTM). BTTM was supplemented with carbon and nitrogen sources (Table 2) and used to test the growth of A. muciniphila on single sugars. Hog gastric mucin (type III; Sigma-Aldrich, St. Louis, MO, USA) was purified by ethanol precipitation as described previously (46). Briefly, 10 g of mucin was stirred for 24 h at 4°C in 500 ml of 0.1 M NaCl containing 0.02 M phosphate buffer (pH 7.8) and a few drops of toluene. After the first hour, the pH was adjusted to 7.2 with 2 M NaOH. After centrifugation at 10,000 × g, the supernatant was cooled to 0°C and precooled ethanol was added to a final concentration of 60% (vol/vol). The resulting precipitate was dissolved in 0.1 M NaCl and precipitated again with ethanol to 60% (vol/vol). The total precipitate was washed with 100% ethanol and dissolved in distilled water. Thereafter, the mucin solution was dialyzed against distilled water for 24 h at 4°C. The dialyzed mucin solution was then lyophilized, dissolved in distilled water, and autoclaved before use. No discoloring was observed, and we assume that modifications due to the Maillard reaction were limited.
All medium components were purchased from Sigma-Aldrich, except for tryptone (Oxoid Ltd., Basingstoke, Hampshire, England). Incubations were performed in serum bottles sealed with butyl-rubber stoppers at 37°C under anaerobic conditions provided by a gas phase of 182 kPa (1.8 atm) N2-CO2. The culture volume was 20 ml. The cultures were inoculated with 2 × 10⁷ bacterial cells from bacterial cultures that were transferred three times on the respective carbohydrate before the start of the experiment, except for the cultures with galactose or a mixture of more than one sugar, which were inoculated from a culture grown on mucin. Growth was followed spectrophotometrically by determining the optical density at 600 nm (OD600).
For RNA-Seq analysis, the bacteria were grown on mucin (0.5%), d-glucose (20 mM), or a mixture of d-glucose (10 mM) and mucin (0.25%). Cultures with only glucose were supplemented with 16 g/liter tryptone and 10 mM threonine. The culture volumes for cultures containing mucin were 50 ml and 100 ml for cultures with only glucose. Cells from cultures containing mucin were harvested for RNA extraction at exponential phase after 10 to 12 h of incubation and from cells in cultures containing only glucose at 32 to 33 h (Fig. S1 and Tables S1, S2, and S3 in the supplemental material). Experiments for each condition were performed in triplicate. Cells were collected by centrifugation at 4,800 × g for 15 min at 4°C. Cell pellets were suspended in TRIzol reagent (Ambion, Life Technologies, Carlsbad, CA, USA) and stored at −80°C until RNA was purified.
Statistical analysis.
Statistical analysis of the results for bacterial growth rates was performed by one-way analysis of variance (ANOVA) followed by Tukey's honestly significant difference (HSD) using R version 3.3.2 (47); P values of < 0.05 were considered significant.
High-performance liquid chromatography.
For fermentation product analysis, samples were obtained at different time points of the incubations. One milliliter of bacterial culture was centrifuged, and the supernatant was stored at −20°C until the HPLC analysis. Substrate conversion and product formation were measured with a Thermo Scientific SpectraSystem HPLC system equipped with a Varian MetaCarb 67H 300 mm by 6.5 mm column kept at 45°C and run with 0.005 mM sulfuric acid as the eluent. The eluent had a flow of 0.8 ml/min, and metabolites were detected by determining the refractive indices and identified by comparing the retention times to those of standards of pure compounds as described previously (48).
RNA-purification and sequencing.
Total RNA was isolated by a method combining the TRIzol reagent and the RNeasy minikit (Qiagen GmbH, Hilden, Germany) essentially as described previously (49, 50). Briefly, 0.2 ml of chloroform was added per 1 ml of TRIzol reagent containing the cell pellet. The tube was shaken for 15 s, incubated for 2 to 3 min at room temperature, and centrifuged at 12,000 × g for 15 min at 4°C. Phase Lock Gel heavy tubes (5 Prime GmbH, Hamburg, Germany) were used during phase separation. The upper aqueous phase was transferred into a new tube. Subsequently, the RNA isolation was continued with the RNA cleanup procedure according to the manufacturer's instructions for the RNeasy minikit. Genomic DNA was removed by on-column DNase digestion during RNA purification (DNase I recombinant, RNase-free; Roche Diagnostics GmbH, Mannheim, Germany). For the RNA purified from cultures containing only glucose as the growth substrate, Turbo DNase treatment was performed according to the manufacturer's instructions (Ambion, Life Technologies). Yield and RNA quality were assessed using the Experion RNA StdSens analysis kit in combination with the Experion system (Bio-Rad Laboratories, Inc., Hercules, CA, USA). Depletion of rRNA was performed using the Ribo-Zero kit for bacteria (Epicentre, Madison, WI, USA) according to the manufacturer's instructions. The success of the rRNA depletion step was checked using the Experion RNA StdSens analysis kit in combination with the Experion System. Libraries for whole-transcriptome sequencing (RNA-Seq) were constructed using a ScriptSeq v2 RNA-Seq library preparation kit in combination with ScriptSeq Index PCR primers (Epicentre) according to the manufacturer's instructions. Barcoded cDNA libraries were sent to BaseClear (Leiden, The Netherlands) where they were pooled and 50-bp sequencing (single-end reads) was performed on two lanes using the Illumina HiSeq 2500 platform in combination with the TruSeq Rapid SBS and TruSeq Rapid SR cluster kits (Illumina).
Transcriptome analysis.
The data were processed for rRNA sequences, adapter sequences, and low-quality reads using a set of dedicated tools. SortMeRNA (version 1.2) (51) was used to remove rRNA sequences. Cutadapt (52) was used to remove TruSeq adapter sequences. The Bowtie2 package v2.2.1 (53) was used to align the remaining high-quality (Phred score > 30) RNA-reads to the genome using default settings. SAMtools v0.1.19 (54) was used for postprocessing of the short DNA sequence read alignments. BEDTools suite v2.17.0 was used to determine the read count for each protein-coding region (55). Upon counting, reads that aligned only to the sense strands of the respective open reading frames (ORFs) were taken into account. Reads at the 5′ and 3′ ends of an ORF were taken into account if they showed a minimum of 30% overlap with the ORF region. Details on the RNA-Seq raw data analysis can be found in Table S4 in the supplemental material. Differential gene expression was assessed with edgeR (56) with default trimmed mean of M-values (TMM) settings.
Proteome analysis.
The whole proteome fraction was obtained from A. muciniphila cultures grown with mucin or glucose as the carbon source. Bacterial cells from an overnight 2-ml culture were spun down, washed with phosphate-buffered saline (PBS), and suspended in 500 μl of PBS. Cells were lysed by sonication using a Branson sonifier equipped with a 3-mm tip (four pulses of 20 s with 30 s rest on ice between each pulse; the strength of the pulse was 4). The samples were stored in 2-ml low-binding tubes (Eppendorf, Hamburg, Germany) at −20°C. A Qubit protein assay kit (Life Technologies, Oregon, USA) was used according to the manufacturer's instructions to determine the protein content of cell extracts. Samples were loaded on a 10% acrylamide separation gel (Precise Protein Gels; Thermo Scientific, Rockford, IL, USA) using the mini-PROTEAN 3 cell (Bio-Rad Laboratories, Hercules, CA, USA). The electrophoresis procedure was according to the manufacturer's instructions. Gels were stained using Coomassie brilliant blue (CBB) R-250 as indicated in the protocol of the mini-PROTEAN 3 system.
In-gel digestion of proteins and purification of peptides were performed according to a modified version of a protocol described earlier (57). Disulfide bridges in proteins were reduced by covering whole gels with reducing solution (10 mM dithiothreitol, pH 7.6, in 50 mM NH4HCO3), and the gels were incubated at 60°C for 1 h. Alkylation was performed for 1 h by adding 25 ml of iodoacetamide solution (10 mM iodoacetamide in 100 mM Tris-HCl, pH 8.0). Gels were thoroughly rinsed with double-distilled H2O water between steps. Each lane of SDS-PAGE gels was cut into five slices, and the slices were cut into approximately 1 mm3 cubes and transferred to separate 0.5-ml protein LoBind tubes (Eppendorf, Hamburg, Germany). Enzymatic digestion was performed by adding 50 μl of trypsin solution (5 ng/μl trypsin in 50 mM NH4HCO3) to each tube and incubating at room temperature overnight with gentle shaking. The extraction of peptides was performed with manual sonication in an ultrasonic water bath for 1 s before the supernatants were transferred to clean protein LoBind tubes. Trifluoroacetic acid (10%) was added to the supernatants to reach a pH between 2 and 4. The supernatants were used for nano-scale liquid chromatography-tandem mass spectrometry (nLC-MS/MS) analysis. Samples were measured by nLC-MS/MS with a Proxeon EASY nLC and a LTQ-Orbitrap XL mass spectrometer as previously described (58).
LC-MS data analysis (false discovery rates were set to 0.01 on peptide and protein levels) and additional result filtering (minimally 2 peptides are necessary for protein identification of which at least one is unique and at least one is unmodified) were performed as described previously (57). To analyze the abundance of proteins, their label-free quantification (LFQ) intensities were compared (59). Nonexisting LFQ intensity values due to insufficient amounts of quantified peptides were substituted with a value lower than the LFQ intensity value for the least-abundant quantified protein. Differential protein abundance was assessed using edgeR as described for the transcriptome analysis.
Construction of a metabolic model.
A genome- and constraint-based metabolic model for A. muciniphila was constructed. A draft metabolic model was generated using Pathway Tools gene-protein-reaction (GPR) mapping and gap filling for the improvement of genomic annotation (60). The model was iteratively curated in the MATLAB COBRA (61, 62) environment to get a functional model and reflect the metabolic capacities observed in the fermentations. The Gibbs energy of the reactions was calculated using eQuilibrator (63).
Model growth simulations.
Exchange reactions for all extracellular metabolites in the experimental media were added to the model. Limited negative lower bounds (−10) were set for mucin-derived components, while other essential and abundant metabolites, such as water and phosphate, were set to be nonlimiting. Flux balance analysis (FBA) simulations were used to qualitatively test the model. FBA simulates interconversion of metabolites with a mass conservation constraint and obtains flux distributions leading to the optimization (maximization or minimization) of a selected objective function (26). All FBA growth simulations were performed with Gurobi5 LP solver (Gurobi Optimizer version 3.0; Gurobi, Houston, Texas) within the MATLAB COBRA toolbox environment and with setting various macromolecular parameters, such as the synthesis of DNA and RNA or protein reactions, as objectives.
Accession numbers.
The raw sequencing data have been submitted to the European Nucleotide Archive under study code PRJEB9527.
Supplementary Material
ACKNOWLEDGMENTS
This work was supported by Advanced Research Grant 250172 (MicrobesInside) of the European Research Council to W.M.D.V., the Gravitation (024.002.002 SIAM) and Spinoza grants of the Netherlands Organization for Scientific Research (NWO) to W.M.D.V., the European Community's Seventh Framework Programme (FP7/2007-2013) under grant agreement no. 215553-2 to N.O., and the Finland Academy of Sciences (141130) to W.M.D.V.
The authors declare no relevant conflict of interest.
Footnotes
Supplemental material for this article may be found at https://doi.org/10.1128/AEM.01014-17.
REFERENCES
- 1.Zoetendal EG, Raes J, van den Bogert B, Arumugam M, Booijink CC, Troost FJ, Bork P, Wels M, de Vos WM, Kleerebezem M. 2012. The human small intestinal microbiota is driven by rapid uptake and conversion of simple carbohydrates. ISME J 6:1415–1426. doi: 10.1038/ismej.2011.212. [DOI] [PMC free article] [PubMed] [Google Scholar]
- 2.Nicholson JK, Holmes E, Kinross J, Burcelin R, Gibson G, Jia W, Pettersson S. 2012. Host-gut microbiota metabolic interactions. Science 336:1262–1267. doi: 10.1126/science.1223813. [DOI] [PubMed] [Google Scholar]
- 3.Lacroix C, de Wouters T, Chassard C. 2015. Integrated multi-scale strategies to investigate nutritional compounds and their effect on the gut microbiota. Curr Opin Biotechnol 32:149–155. doi: 10.1016/j.copbio.2014.12.009. [DOI] [PubMed] [Google Scholar]
- 4.Salonen A, de Vos WM. 2014. Impact of diet on human intestinal microbiota and health. Annu Rev Food Sci Technol 5:239–262. doi: 10.1146/annurev-food-030212-182554. [DOI] [PubMed] [Google Scholar]
- 5.Koropatkin NM, Cameron EA, Martens EC. 2012. How glycan metabolism shapes the human gut microbiota. Nat Rev Microbiol 10:323–335. doi: 10.1038/nrmicro2746. [DOI] [PMC free article] [PubMed] [Google Scholar]
- 6.Martens EC, Chiang HC, Gordon JI. 2008. Mucosal glycan foraging enhances fitness and transmission of a saccharolytic human gut bacterial symbiont. Cell Host Microbe 4:447–457. doi: 10.1016/j.chom.2008.09.007. [DOI] [PMC free article] [PubMed] [Google Scholar]
- 7.Cone RA. 2009. Barrier properties of mucus. Adv Drug Deliv Rev 61:75–85. doi: 10.1016/j.addr.2008.09.008. [DOI] [PubMed] [Google Scholar]
- 8.Johansson ME, Sjovall H, Hansson GC. 2013. The gastrointestinal mucus system in health and disease. Nat Rev Gastroenterol Hepatol 10:352–361. doi: 10.1038/nrgastro.2013.35. [DOI] [PMC free article] [PubMed] [Google Scholar]
- 9.Jakobsson HE, Rodriguez-Pineiro AM, Schutte A, Ermund A, Boysen P, Bemark M, Sommer F, Backhed F, Hansson GC, Johansson ME. 2015. The composition of the gut microbiota shapes the colon mucus barrier. EMBO Rep 16:164–177. doi: 10.15252/embr.201439263. [DOI] [PMC free article] [PubMed] [Google Scholar]
- 10.Johansson ME, Phillipson M, Petersson J, Velcich A, Holm L, Hansson GC. 2008. The inner of the two Muc2 mucin-dependent mucus layers in colon is devoid of bacteria. Proc Natl Acad Sci U S A 105:15064–15069. doi: 10.1073/pnas.0803124105. [DOI] [PMC free article] [PubMed] [Google Scholar]
- 11.Johansson ME, Larsson JM, Hansson GC. 2011. The two mucus layers of colon are organized by the MUC2 mucin, whereas the outer layer is a legislator of host-microbial interactions. Proc Natl Acad Sci U S A 108 (Suppl 1):S4659–S4665. doi: 10.1073/pnas.1006451107. [DOI] [PMC free article] [PubMed] [Google Scholar]
- 12.Derrien M, Collado MC, Ben-Amor K, Salminen S, de Vos WM. 2008. The mucin degrader Akkermansia muciniphila is an abundant resident of the human intestinal tract. Appl Environ Microbiol 74:1646–1648. doi: 10.1128/AEM.01226-07. [DOI] [PMC free article] [PubMed] [Google Scholar]
- 13.Belzer C, de Vos WM. 2012. Microbes inside–from diversity to function: the case of Akkermansia. ISME J 6:1449–1458. doi: 10.1038/ismej.2012.6. [DOI] [PMC free article] [PubMed] [Google Scholar]
- 14.Png CW, Linden SK, Gilshenan KS, Zoetendal EG, McSweeney CS, Sly LI, McGuckin MA, Florin TH. 2010. Mucolytic bacteria with increased prevalence in IBD mucosa augment in vitro utilization of mucin by other bacteria. Am J Gastroenterol 105:2420–2428. doi: 10.1038/ajg.2010.281. [DOI] [PubMed] [Google Scholar]
- 15.Rajilić-Stojanović M, Shanahan F, Guarner F, de Vos WM. 2013. Phylogenetic analysis of dysbiosis in ulcerative colitis during remission. Inflamm Bowel Dis 19:481–488. doi: 10.1097/MIB.0b013e31827fec6d. [DOI] [PubMed] [Google Scholar]
- 16.Swidsinski A, Dorffel Y, Loening-Baucke V, Theissig F, Ruckert JC, Ismail M, Rau WA, Gaschler D, Weizenegger M, Kuhn S, Schilling J, Dorffel WV. 2011. Acute appendicitis is characterised by local invasion with Fusobacterium nucleatum/necrophorum. Gut 60:34–40. doi: 10.1136/gut.2009.191320. [DOI] [PubMed] [Google Scholar]
- 17.Karlsson CL, Onnerfalt J, Xu J, Molin G, Ahrne S, Thorngren-Jerneck K. 2012. The microbiota of the gut in preschool children with normal and excessive body weight. Obesity (Silver Spring) 20:2257–2261. doi: 10.1038/oby.2012.110. [DOI] [PubMed] [Google Scholar]
- 18.Dao MC, Everard A, Aron-Wisnewsky J, Sokolovska N, Prifti E, Verger EO, Kayser BD, Levenez F, Chilloux J, Hoyles L, MICRO-Obes Consortium, Dumas ME, Rizkalla SW, Dore J, Cani PD, Clement K. 2016. Akkermansia muciniphila and improved metabolic health during a dietary intervention in obesity: relationship with gut microbiome richness and ecology. Gut 65:426–436. doi: 10.1136/gutjnl-2014-308778. [DOI] [PubMed] [Google Scholar]
- 19.Zhang X, Shen D, Fang Z, Jie Z, Qiu X, Zhang C, Chen Y, Ji L. 2013. Human gut microbiota changes reveal the progression of glucose intolerance. PLoS One 8:e71108. doi: 10.1371/journal.pone.0071108. [DOI] [PMC free article] [PubMed] [Google Scholar]
- 20.Plovier H, Everard A, Druart C, Depommier C, Van Hul M, Geurts L, Chilloux J, Ottman N, Duparc T, Lichtenstein L, Myridakis A, Delzenne NM, Klievink J, Bhattacharjee A, van der Ark KC, Aalvink S, Martinez LO, Dumas ME, Maiter D, Loumaye A, Hermans MP, Thissen JP, Belzer C, de Vos WM, Cani PD. 2017. A purified membrane protein from Akkermansia muciniphila or the pasteurized bacterium improves metabolism in obese and diabetic mice. Nat Med 23:107–113. doi: 10.1038/nm.4236. [DOI] [PubMed] [Google Scholar]
- 21.van Passel MW, Kant R, Zoetendal EG, Plugge CM, Derrien M, Malfatti SA, Chain PS, Woyke T, Palva A, de Vos WM, Smidt H. 2011. The genome of Akkermansia muciniphila, a dedicated intestinal mucin degrader, and its use in exploring intestinal metagenomes. PLoS One 6:e16876. doi: 10.1371/journal.pone.0016876. [DOI] [PMC free article] [PubMed] [Google Scholar]
- 22.Derrien M, van Passel MW, van de Bovenkamp JH, Schipper RG, de Vos WM, Dekker J. 2010. Mucin-bacterial interactions in the human oral cavity and digestive tract. Gut Microbes 1:254–268. doi: 10.4161/gmic.1.4.12778. [DOI] [PMC free article] [PubMed] [Google Scholar]
- 23.Ottman N, Huuskonen L, Reunanen J, Boeren S, Klievink J, Smidt H, Belzer C, de Vos WM. 2016. Characterization of outer membrane proteome of Akkermansia muciniphila reveals sets of novel proteins exposed to the human intestine. Front Microbiol 7:1157. doi: 10.3389/fmicb.2016.01157. [DOI] [PMC free article] [PubMed] [Google Scholar]
- 24.Derrien M, Vaughan EE, Plugge CM, de Vos WM. 2004. Akkermansia muciniphila gen. nov., sp. nov., a human intestinal mucin-degrading bacterium. Int J Syst Evol Microbiol 54:1469–1476. doi: 10.1099/ijs.0.02873-0. [DOI] [PubMed] [Google Scholar]
- 25.Desai MS, Seekatz AM, Koropatkin NM, Kamada N, Hickey CA, Wolter M, Pudlo NA, Kitamoto S, Terrapon N, Muller A, Young VB, Henrissat B, Wilmes P, Stappenbeck TS, Nunez G, Martens EC. 2016. A dietary fiber-deprived gut microbiota degrades the colonic mucus barrier and enhances pathogen susceptibility. Cell 167:1339.e21–1353.e21. doi: 10.1016/j.cell.2016.10.043. [DOI] [PMC free article] [PubMed] [Google Scholar]
- 26.Orth JD, Thiele I, Palsson BO. 2010. What is flux balance analysis? Nat Biotechnol 28:245–248. doi: 10.1038/nbt.1614. [DOI] [PMC free article] [PubMed] [Google Scholar]
- 27.Ottman N. 2015. Host immunostimulation and substrate utilization of the gut symbiont Akkermansia muciniphila. PhD thesis Wageningen University, Wageningen, the Netherlands. [Google Scholar]
- 28.Stein SE, Heller SR, Tchekhovski D. 2003. An open standard for chemical structure representation: the IUPAC chemical identifier, p 131–143. In Proceedings of the 15th International Chemical Information Conference, Nimes, France. [Google Scholar]
- 29.Schrager J. 1970. The chemical composition and function of gastrointestinal mucus. Gut 11:450–456. doi: 10.1136/gut.11.5.450. [DOI] [PMC free article] [PubMed] [Google Scholar]
- 30.Caspi R, Altman T, Billington R, Dreher K, Foerster H, Fulcher CA, Holland TA, Keseler IM, Kothari A, Kubo A, Krummenacker M, Latendresse M, Mueller LA, Ong Q, Paley S, Subhraveti P, Weaver DS, Weerasinghe D, Zhang P, Karp PD. 2014. The MetaCyc database of metabolic pathways and enzymes and the BioCyc collection of pathway/genome databases. Nucleic Acids Res 42:D459–D471. doi: 10.1093/nar/gkt1103. [DOI] [PMC free article] [PubMed] [Google Scholar]
- 31.Derrien M. 2007. Mucin utilisation and host interactions of the novel intestinal microbe Akkermansia muciniphila. PhD thesis Wageningen University, Wageningen, the Netherlands. [Google Scholar]
- 32.Fischbach MA, Sonnenburg JL. 2011. Eating for two: how metabolism establishes interspecies interactions in the gut. Cell Host Microbe 10:336–347. doi: 10.1016/j.chom.2011.10.002. [DOI] [PMC free article] [PubMed] [Google Scholar]
- 33.Reichardt N, Duncan SH, Young P, Belenguer A, McWilliam Leitch C, Scott KP, Flint HJ, Louis P. 2014. Phylogenetic distribution of three pathways for propionate production within the human gut microbiota. ISME J 8:1323–1335. doi: 10.1038/ismej.2014.14. [DOI] [PMC free article] [PubMed] [Google Scholar]
- 34.Engels C, Ruscheweyh HJ, Beerenwinkel N, Lacroix C, Schwab C. 2016. The common gut microbe Eubacterium hallii also contributes to intestinal propionate formation. Front Microbiol 7:713. doi: 10.3389/fmicb.2016.00713. [DOI] [PMC free article] [PubMed] [Google Scholar]
- 35.Van der Meulen R, Avonts L, De Vuyst L. 2004. Short fractions of oligofructose are preferentially metabolized by Bifidobacterium animalis DN-173 010. Appl Environ Microbiol 70:1923–1930. doi: 10.1128/AEM.70.4.1923-1930.2004. [DOI] [PMC free article] [PubMed] [Google Scholar]
- 36.Palframan RJ, Gibson GR, Rastall RA. 2003. Carbohydrate preferences of Bifidobacterium species isolated from the human gut. Curr Issues Intest Microbiol 4:71–75. [PubMed] [Google Scholar]
- 37.Tsujikawa Y, Nomoto R, Osawa R. 2013. Difference in degradation patterns on inulin-type fructans among strains of Lactobacillus delbrueckii and Lactobacillus paracasei. Biosci Microbiota Food Health 32:157–165. doi: 10.12938/bmfh.32.157. [DOI] [PMC free article] [PubMed] [Google Scholar]
- 38.Yakubov GE, Papagiannopoulos A, Rat E, Easton RL, Waigh TA. 2007. Molecular structure and rheological properties of short-side-chain heavily glycosylated porcine stomach mucin. Biomacromolecules 8:3467–3477. doi: 10.1021/bm700607w. [DOI] [PubMed] [Google Scholar]
- 39.Feehily C, Karatzas KA. 2013. Role of glutamate metabolism in bacterial responses towards acid and other stresses. J Appl Microbiol 114:11–24. doi: 10.1111/j.1365-2672.2012.05434.x. [DOI] [PubMed] [Google Scholar]
- 40.Wright DP, Knight CG, Parkar SG, Christie DL, Roberton AM. 2000. Cloning of a mucin-desulfating sulfatase gene from Prevotella strain RS2 and its expression using a Bacteroides recombinant system. J Bacteriol 182:3002–3007. doi: 10.1128/JB.182.11.3002-3007.2000. [DOI] [PMC free article] [PubMed] [Google Scholar]
- 41.Caputo A, Dubourg G, Croce O, Gupta S, Robert C, Papazian L, Rolain JM, Raoult D. 2015. Whole-genome assembly of Akkermansia muciniphila sequenced directly from human stool. Biol Direct 10:5. doi: 10.1186/s13062-015-0041-1. [DOI] [PMC free article] [PubMed] [Google Scholar]
- 42.Li SS, Zhu A, Benes V, Costea PI, Hercog R, Hildebrand F, Huerta-Cepas J, Nieuwdorp M, Salojarvi J, Voigt AY, Zeller G, Sunagawa S, de Vos WM, Bork P. 2016. Durable coexistence of donor and recipient strains after fecal microbiota transplantation. Science 352:586–589. doi: 10.1126/science.aad8852. [DOI] [PubMed] [Google Scholar]
- 43.Ouwerkerk JP. 2016. Akkermansia species - phylogeny, physiology and comparative genomics. PhD thesis Wageningen University, Wageningen, the Netherlands. [Google Scholar]
- 44.Correa-Oliveira R, Fachi JL, Vieira A, Sato FT, Vinolo MA. 2016. Regulation of immune cell function by short-chain fatty acids. Clin Transl Immunology 5:e73. doi: 10.1038/cti.2016.17. [DOI] [PMC free article] [PubMed] [Google Scholar]
- 45.Byrne CS, Chambers ES, Morrison DJ, Frost G. 2015. The role of short chain fatty acids in appetite regulation and energy homeostasis. Int J Obes (Lond) 39:1331–1338. doi: 10.1038/ijo.2015.84. [DOI] [PMC free article] [PubMed] [Google Scholar]
- 46.Miller RS, Hoskins LC. 1981. Mucin degradation in human colon ecosystems. Fecal population densities of mucin-degrading bacteria estimated by a “most probable number” method. Gastroenterology 81:759–765. [PubMed] [Google Scholar]
- 47.R Core Team. 2016. R: a language and environment for statistical computing. R Foundation for Statistical Computing, Vienna, Austria: http://www.r-project.org/. [Google Scholar]
- 48.van Gelder AH, Aydin R, Alves MM, Stams AJ. 2012. 1,3-Propanediol production from glycerol by a newly isolated Trichococcus strain. Microb Biotechnol 5:573–578. doi: 10.1111/j.1751-7915.2011.00318.x. [DOI] [PMC free article] [PubMed] [Google Scholar]
- 49.Zoetendal EG, Booijink CC, Klaassens ES, Heilig HG, Kleerebezem M, Smidt H, de Vos WM. 2006. Isolation of RNA from bacterial samples of the human gastrointestinal tract. Nat Protoc 1:954–959. doi: 10.1038/nprot.2006.143. [DOI] [PubMed] [Google Scholar]
- 50.Chomczynski P. 1993. A reagent for the single-step simultaneous isolation of RNA, DNA and proteins from cell and tissue samples. Biotechniques 15:532–537. [PubMed] [Google Scholar]
- 51.Kopylova E, Noe L, Touzet H. 2012. SortMeRNA: fast and accurate filtering of ribosomal RNAs in metatranscriptomic data. Bioinformatics 28:3211–3217. doi: 10.1093/bioinformatics/bts611. [DOI] [PubMed] [Google Scholar]
- 52.Martin M. 2011. Cutadapt removes adapter sequences from high-throughput sequencing reads. EMBnet.journal 17:10–12. doi: 10.14806/ej.17.1.200. [DOI] [Google Scholar]
- 53.Langmead B, Salzberg SL. 2012. Fast gapped-read alignment with Bowtie 2. Nat Methods 9:357–359. doi: 10.1038/nmeth.1923. [DOI] [PMC free article] [PubMed] [Google Scholar]
- 54.Li H, Handsaker B, Wysoker A, Fennell T, Ruan J, Homer N, Marth G, Abecasis G, Durbin R, 1000 Genome Project Data Processing Subgroup . 2009. The Sequence Alignment/Map format and SAMtools. Bioinformatics 25:2078–2079. doi: 10.1093/bioinformatics/btp352. [DOI] [PMC free article] [PubMed] [Google Scholar]
- 55.Quinlan AR, Hall IM. 2010. BEDTools: a flexible suite of utilities for comparing genomic features. Bioinformatics 26:841–842. doi: 10.1093/bioinformatics/btq033. [DOI] [PMC free article] [PubMed] [Google Scholar]
- 56.Robinson MD, McCarthy DJ, Smyth GK. 2010. edgeR: a Bioconductor package for differential expression analysis of digital gene expression data. Bioinformatics 26:139–140. doi: 10.1093/bioinformatics/btp616. [DOI] [PMC free article] [PubMed] [Google Scholar]
- 57.Rupakula A, Kruse T, Boeren S, Holliger C, Smidt H, Maillard J. 2013. The restricted metabolism of the obligate organohalide respiring bacterium Dehalobacter restrictus: lessons from tiered functional genomics. Philos Trans R Soc Lond B Biol Sci 368:20120325. doi: 10.1098/rstb.2012.0325. [DOI] [PMC free article] [PubMed] [Google Scholar]
- 58.Lu J, Boeren S, de Vries SC, van Valenberg HJ, Vervoort J, Hettinga K. 2011. Filter-aided sample preparation with dimethyl labeling to identify and quantify milk fat globule membrane proteins. J Proteomics 75:34–43. doi: 10.1016/j.jprot.2011.07.031. [DOI] [PubMed] [Google Scholar]
- 59.Cox J, Hein MY, Luber CA, Paron I, Nagaraj N, Mann M. 2014. Accurate proteome-wide label-free quantification by delayed normalization and maximal peptide ratio extraction, termed MaxLFQ. Mol Cell Proteomics 13:2513–2526. doi: 10.1074/mcp.M113.031591. [DOI] [PMC free article] [PubMed] [Google Scholar]
- 60.Karp PD, Paley SM, Krummenacker M, Latendresse M, Dale JM, Lee TJ, Kaipa P, Gilham F, Spaulding A, Popescu L, Altman T, Paulsen I, Keseler IM, Caspi R. 2010. Pathway Tools version 13.0: integrated software for pathway/genome informatics and systems biology. Brief Bioinform 11:40–79. doi: 10.1093/bib/bbp043. [DOI] [PMC free article] [PubMed] [Google Scholar]
- 61.Schellenberger J, Que R, Fleming RM, Thiele I, Orth JD, Feist AM, Zielinski DC, Bordbar A, Lewis NE, Rahmanian S, Kang J, Hyduke DR, Palsson BO. 2011. Quantitative prediction of cellular metabolism with constraint-based models: the COBRA toolbox v2.0. Nat Protoc 6:1290–1307. doi: 10.1038/nprot.2011.308. [DOI] [PMC free article] [PubMed] [Google Scholar]
- 62.Thiele I, Palsson BO. 2010. A protocol for generating a high-quality genome-scale metabolic reconstruction. Nat Protoc 5:93–121. doi: 10.1038/nprot.2009.203. [DOI] [PMC free article] [PubMed] [Google Scholar]
- 63.Flamholz A, Noor E, Bar-Even A, Milo R. 2012. eQuilibrator–the biochemical thermodynamics calculator. Nucleic Acids Res 40:D770–D775. doi: 10.1093/nar/gkr874. [DOI] [PMC free article] [PubMed] [Google Scholar]
Associated Data
This section collects any data citations, data availability statements, or supplementary materials included in this article.