

Summary
Predicting vaccine efficacy remains a challenge. We used a systems vaccinology approach to identify early innate immune correlates of antibody induction in humans receiving the Ebola vaccine rVSV-ZEBOV. Blood samples from days 0, 1, 3, 7, and 14 were analyzed for changes in cytokine levels, innate immune cell subsets, and gene expression. Integrative statistical analyses with cross-validation identified a signature of 5 early innate markers correlating with antibody titers on day 28 and beyond. Among those, IP-10 on day 3 and MFI of CXCR6 on NK cells on day 1 were independent correlates. Consistently, we found an early gene expression signature linked to IP-10. This comprehensive characterization of early innate immune responses to the rVSV-ZEBOV vaccine in humans revealed immune signatures linked to IP-10. These results suggest correlates of vaccine-induced antibody induction and provide a rationale to explore strategies for augmenting the effectiveness of vaccines through manipulation of IP-10.
Keywords: Ebola vaccine, rVSV-ZEBOV, viral immunity, innate immunity, emerging infections, systems vaccinology, IP-10, RNA sequencing
Graphical Abstract
Highlights
-
•
5 early innate markers correlate with antibody response to Ebola vaccine rVSV-ZEBOV
-
•
IP-10 on day 3 after vaccination is an independent correlate of antibody induction
-
•
RNA-seq analysis identifies early gene expression signature linked to IP-10
Rechtien et al. apply a systems vaccinology approach to examine the early innate immune responses elicited by the Ebola vaccine rVSV-ZEBOV. They find that early innate immune responses, with IP-10 as an independent soluble marker, correlate with EBOV-GP-specific antibody induction.
Introduction
Recent outbreaks of emerging infections, caused by viruses such as Ebola, Middle East Respiratory Syndrome (MERS), Coronavirus, and Zika Virus, represent a global threat and emphasize the critical need for new vaccine concepts and vectors and for rapid clinical development. However, predicting and achieving vaccine efficacy remains a major challenge in the acceleration of vaccine development. Systems vaccinology approaches can assist with the identification of early immune signatures predictive of vaccine immunogenicity (Pulendran et al., 2010). Previous studies have investigated the potential of early innate immune signatures to predict the antibody response to vaccines, such as the yellow fever or influenza vaccines (Nakaya et al., 2011, Querec et al., 2009, Gaucher et al., 2008, Furman et al., 2013), among others (Li et al., 2014), but it remains unknown whether molecular signatures can be identified that can be used to predict immune responses to novel vaccines. Here we applied a systems vaccinology approach to disentangle the early innate immune responses elicited by the Ebola vaccine rVSV-Zaire Ebola virus (ZEBOV) to identify innate immune responses correlating with Ebola virus (EBOV)-glycoprotein (GP)-specific antibody induction. This replication-competent recombinant vaccine candidate is based on the vesicular stomatitis virus (rVSV)-based vaccine vector, for which limited data on immune responses and no innate immunity profiles in humans have been reported thus far. rVSV-ZEBOV represents one of the most promising Ebola vaccine candidates to date, with anticipated licensure expected soon. This vaccine has shown to be protective in relevant EBOV animal challenge models, including non-human primates (NHPs), where it conferred 100% protection (Jones et al., 2005, Qiu et al., 2009, Geisbert et al., 2008, Geisbert et al., 2009). Furthermore, it is the only EBOV candidate vaccine for which an efficacy evaluation against the risk of infection in humans was possible. A cluster-randomized ring vaccination trial conducted in Guinea in 2015 showed promising results, demonstrating that a strategy of contact tracing and immediate ring vaccination of contacts with the rVSV-ZEBOV vaccine protects against Ebola virus disease compared with controls (Henao-Restrepo et al., 2017). While this ring vaccination trial was focused on clinical endpoints only and did not assess immune responses induced by the vaccine, the safety and immunogenicity of vaccination with rVSV-ZEBOV were evaluated in 2014–2015 in a number of investigator-initiated dose-escalation phase 1 clinical trials coordinated through a World Health Organization (WHO)-led African and European VSV-Ebola Consortium (VEBCON), which informed dose selection for the efficacy trials. These harmonized but independent investigator-initiated phase I trials were completed in 2015 and took place at four different international sites, including the University Medical Center Hamburg-Eppendorf (UKE) in Germany (Agnandji et al., 2016). In these trials, vaccination with rVSV-ZEBOV was shown to be immunogenic and induced GP-specific antibodies in all participants (Agnandji et al., 2016). However, the immunological mechanisms leading to antibody induction, in particular the role of early innate immune responses to this vaccine vector, remain to be elucidated.
The systems vaccinology approach presented here comprehensively dissects innate immunity profiles to rVSV-ZEBOV and reveals strong and early innate immune activation following vaccination. A subset of early innate markers, encompassing interferon-γ-inducible protein 10 (IP-10) and subsets of monocytes, dendritic cells, and natural killer (NK) cells as well as an early gene signature linked to the IP-10 pathway, were identified as innate immune signatures that correlate with the GP-specific antibody response on day 28 and beyond. Because human data on the recombinant VSV vaccine platform are scarce, our study makes important contributions to the understanding of the immunological properties of this vaccine in humans and may provide unique insights for future use of this vector technology in emergency vaccines, including candidate vaccines currently in development against Zika virus (Betancourt et al., 2017).
Results
Induction of Antiviral Plasma Cytokines Starts on Day 1 after Vaccination
Human data on immunity induced by vaccines based on rVSV vectors are scarce. We therefore first studied early plasma cytokine responses induced by the vaccine. Plasma was isolated on days 0, 1, 3, 7, and 14 after vaccination and analyzed for concentration levels of interleukin-2 (IL-2), IL-6, IL-12 p70, IL-10, interleukin-1 receptor antagonist (IL-1RA), interferon-γ (IFN-γ), IFN-α, tumor necrosis factor alpha (TNF-α), TNF-β, macrophage-inflammatory protein-1α (MIP-1α), MIP-1β, monocyte-chemoattractant protein-1 (MCP-1) and IP-10 using a Luminex assay. The respective cytokines were selected based on their reported roles in orchestrating host immune responses to vaccines (Querec et al., 2009, Nakaya et al., 2011, Barouch et al., 2013, Teigler et al., 2012). The vaccine rVSV-ZEBOV induced a rapid and robust increase in cytokine levels, with a maximum peak as early as day 1. Significant increases in concentration levels were noted for IP-10 (CXCL-10) on days 1 and 3 and for MCP-1 and MIP-1β on day 1 relative to their expression on day 0 (Wilcoxon signed-rank test, false discovery rate [FDR]-adjusted p < 0.001 for each cytokine; Figures 1A and 1B). Cytokine levels of MCP-1 and IP-10 were vaccine dose-dependent, with the highest levels observed in higher vaccine dose group 2 receiving 20 × 106 plaque-forming units (PFUs) compared with the lower dose group receiving 3 × 10⁶ PFUs (Wilcoxon rank-sum test for between-group comparison on day 1; FDR-adjusted p = 0.003 and 0.048, respectively; Figure 1C). The remaining 10 cytokines had concentration levels below the range of the standard curve in >50% of the measurements at several time points, and no statistical analyses were performed on these cytokines. Altogether, we show here that rVSV-ZEBOV leads to a significant and early induction of the cytokines IP-10, MCP-1, and MIP-1β, with maximum plasma peak levels on day 1 after vaccination.
Figure 1.

A Strong Increase in Cytokine Levels as Early as Day 1 after Vaccination
(A) Graphs showing box and whisker plots with the minimum, first quartile, median, third quartile, and maximum of the cytokine levels on the different days. Two-sided Wilcoxon signed-rank test was performed for within-group comparisons of post-vaccination time points to baseline (d0) across both dose groups (n = 20 trial participants). Significant p values adjusted for multiple testing by adaptive FDR are shown for the day 1 to day 0 and day 3 to day 0 comparisons.
(B) Heatmap reflecting the plasma concentration of 13 cytokines on days 0, 1, 3, 7, and 14 for both vaccine dose groups (group 1 [n = 10 trial participants] with 3 × 10⁶ PFUs in orange symbols, group 2 [n = 10 trial participants] with 20 × 106 PFUs in blue symbols on the top part of the figure). For generation of the heatmap, plasma concentration levels below the range of the standard curve were replaced with a value of 0 pg/mL, and all values per cytokine were then standardized.
(C) Box and whisker plots with the minimum, first quartile, median, third quartile, and maximum of the cytokine levels of MCP-1 and IP-10 for each dose group on day 1 (n = 10 participants per dose group). Two-sided Wilcoxon rank-sum test was performed for between-group comparisons. The p values are adjusted for multiple testing by adaptive FDR. Data were generated from one experiment. Samples were measured in duplicates.
The rVSV-ZEBOV Vaccine Induces Expansion of Activated Innate Cell Subsets and Increased Expression of Innate Immune Markers
To gain additional insights into the underlying innate immune responses to the rVSV-ZEBOV vaccine, we further analyzed peripheral blood mononuclear cells (PBMCs) for changes in frequency and activation status of innate immune cell subsets, including myeloid and plasmacytoid dendritic cells (mDCs and pDCs, respectively), monocytes, and NK cells. Vaccination with rVSV-ZEBOV led to a strong and early induction of a wide spectrum of activating molecules and upregulation of costimulatory molecules on both antigen-presenting cells (monocytes and DCs) and NK cells (Figure 2 ). Significant modulations were seen in the frequency of CD86+/CD40+ mDCs and pDCs as well as CD16+ inflammatory monocytes, accompanied by an increase in the mean fluorescence intensity (MFI) of CD40 on pDCs and CD86 on mDCs. Analysis also revealed significant upregulation of several activation markers on NK cells, including NKG2D and CD38 (Figure 2). The entire spectrum of assessed innate surface markers is shown in Table S1. The kinetics of surface marker expression and frequency differed among the distinct cell subsets, with peak values either reached by day 1 or day 3 following vaccination (Table S1). For all markers, frequency and surface expression declined again following day 3 after vaccination (Figure 2; Table S1).
Figure 2.

Early Vaccine-Induced Changes in Frequency and Activation Status of Innate Immune Cell Subsets
(A and B) Graphs show box and whisker plots with the minimum, first quartile, median, third quartile, and maximum. Shown are the changes in frequency of selected innate cell subsets (A) and a summary of the modulated MFI on selected subsets of DCs, (inflammatory CD16+) monocytes, and NK cells between day 0 and day 14 (B). Two-sided Wilcoxon signed rank-test was performed for within-group comparisons of post-vaccination time points to baseline (d0) across both dose groups (n = 20 trial participants). Significant p values, adjusted for multiple testing by adaptive FDR, are shown for the day 1 to day 0 and day 3 to day 0 comparisons. Data were generated from one experiment. See also Table S1.
Overall, rVSV-ZEBOV vaccination resulted in significant and early activation of NK cells, (inflammatory) monocytes, and DCs between day 1 and day 3 after vaccination.
EBOV-GP-Binding Antibody Responses Induced by the Vaccine
GP-specific antibody responses were measured using an ELISA in two centralized laboratories (Marburg, Germany and United States Army Medical Research Institute for Infectious Diseases [USAMRIID], USA) on days 0, 7, 14, 28, 56, 84, and 180. EBOV-GP-binding antibodies were measured using an ELISA against the homologous GP of the Zaire-Kikwit strain (short Kikwit-GP-specific antibodies) by USAMRIID on day 0 and day 28 (these were the only time points available at the time of analysis) or against inactivated whole virions of the Zaire-Gueckedou strain (short Gueckedou-GP-specific antibodies) in Marburg at all available time points (days 28, 56, 84, and 180) (Agnandji et al., 2016). On day 28 after vaccination, the rVSV-ZEBOV vaccine induced glycoprotein-specific antibodies in all participants at all doses, demonstrating its robust immunogenicity (Figure S1). The levels of EBOV-GP-binding antibodies were durable over time until day 180 (Figure 3 ), as published previously (Agnandji et al., 2016).
Figure 3.

Individual Changes in Gueckedou-GP-Specific Antibody Levels Over Time
Each line corresponds to an individual trial participant. Participants in the 3 × 10⁶ PFU group are shown in blue, and participants in the 20 × 106 PFU group are shown in orange. Negative optical density (OD) values were imputed as the lowest positive observed OD value (0.003). See also Figure S1.
Identification of Vaccine-Induced Early Innate Immune Responses that Correlate with Later EBOV-GP Antibody Responses Using a Multidimensional Statistical Approach
We next studied whether any of the cytokines and/or cell surface markers measured on days 0, 1, and 3 after vaccination or a combination thereof represented an early innate immune signature associated with later antibody responses. A multidimensional statistical analysis method was used to assess the early innate immune responses between day 0 and day 3 as correlates of the subsequent EBOV-GP-specific antibody responses. Given the high number of predictor variables (435 early innate immune marker variables across day 0, day 1, and day 3) and the small sample size (20 trial participants), we took advantage of the full spectrum of antibody response measurements between day 28 and day 180 to increase the amount of response information in the model using sparse partial least-squares (sPLS). Cross-validated down-selection resulted in a single sPLS component including five early innate markers as correlates of the later antibody responses (with 49%–67% of the variance of each of the five antibody response measurements explained; Table S2). The correlation matrix between the selected innate markers and the antibody response variables is shown in Figure 4 (additional numerical results are shown in in Table S3 and correlations among innate markers in Figure S2).
Figure 4.

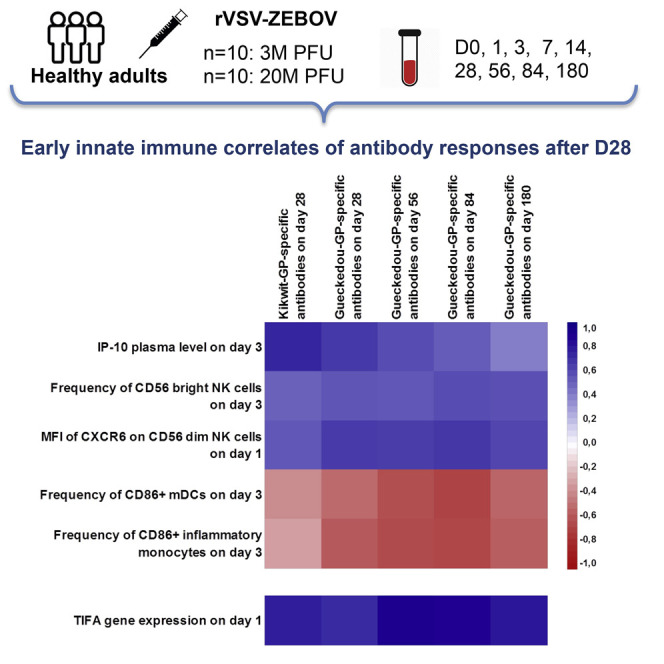
Correlation Matrix (Pearson Correlation Coefficients) between Each of the Five Early Cell Populations, Cytokine Immune Response Markers Selected by sPLS, and the Antibody Responses between day 28 and day 180 (n = 20 Trial Participants)
The matrix shows positive correlations with the corresponding antibody responses in blue and negative correlations in red. The stronger the intensity of the color, the stronger is the correlation. See also Figure S1, Tables S2 and S3, and Table S4.
IP-10 plasma levels on day 3, the frequency of CD56bright NK cells on day 3, and the mean fluorescence intensity of CXCR6 on CD56dim NK cells on day 1 post-vaccination were positively correlated with antibody responses on day 28 and onward. Antibody levels on day 28 were most strongly correlated with IP-10. The other two innate immune response markers, related to CD86 expression on monocytes on day 3, were negatively correlated with antibody responses. Absolute numbers of these markers identified through flow cytometry are shown in Table S4. Taken together, our data reveal a signature of five early innate immune markers that correlate with the GP-specific vaccine-induced antibody response on day 28 and beyond.
Independent Innate Predictors of Antibody Response on Day 28
To further disentangle whether the effects of the five selected innate markers were independent from each other, we used multivariable linear regressions with a stepwise bottom-up variable selection, starting with the five innate markers identified by the sPLS analysis above. We assessed the independent determinants of the Gueckedou-GP-specific antibody response on day 28, an immunogenicity time point of primary interest in ongoing vaccine trials.
Two significant independent determinants were retained in the final multivariable model by this method (Table 1 ). The plasma level of IP-10 on day 3 was a significant positive determinant of the day 28 antibody response: per 1,000 pg/mL increase in IP-10 plasma levels on day 3, the level of Gueckedou-specific antibodies increased by 0.33 log optical density units. The second significant positive determinant was the mean fluorescence intensity of CXCR6 on CD56dim NK cells on day 1: per 1,000 units of increase in MFI, the level of Gueckedou-specific antibodies increased by 1.37 log optical density units. Although the predictive value of the model was imperfect (root square residuals [RSRs] leave-one-out: 0.77, SD 0.64), it explained 55% of the variability of the antibody response measured on day 28.
Table 1.
Multivariable Linear Modeling Results
| Determinant | Regression Coefficient Estimate | 95% Confidence Interval | p Value |
|---|---|---|---|
| Intercept | −5.61 | [-8.03; −3:19] | < 10−3 |
| Plasma IP-10 level on day 3 (per 1000 pg/mL change) | 0.33 | [0.05; 0.60] | 0.02 |
| MFI of CXCR6 on CD56dim NK cells on day 1 (per 1,000 MFI change) | 1.37 | [0.15; 2.58] | 0.03 |
Model selection criteria: adjusted R2, 0.55; RSR leave-one-out, 0.77 (SD, 0.64).
When the Kikwit GP-specific antibody levels on day 28 were used as a response variable instead of Gueckedou-GP-specific antibodies, plasma IP-10 on day 3 was the only significant determinant in the final model (0.48 increase in Kikwit GP-specific antibody log ELISA units/mL per 1,000 pg/mL increase in plasma IP-10; 95% confidence interval, 0.28; 0:67, p < 0.001; adjusted R2, 0.56; RSR leave-one-out, 0.69 [SD, 0.50]).
Altogether, the final multivariable linear model identified two early innate markers positively and independently associated with later EBOV-Gueckedou-GP-specific antibody responses. In particular, among the five markers in the early innate signature identified by the sPLS model, plasma IP-10 on day 3 was found to be a statistically significant, positive determinant of antibody responses on day 28, thus being independently associated with the day 28 antibody response level regardless of the levels of the four other early markers.
Next-Generation RNA Sequencing of Full Blood Shows Differential Gene Expression after Vaccination
We next sought to assess whether early vaccine effects were also identifiable in gene expression levels from whole blood sampled on days 0, 1, 3, and 7. Differential gene expression from the day 0 baseline was investigated gene-wise using the voom/limma method (Law et al., 2014). Sequences from 60,417 genes were measured, of which 19,797 were identified as protein-coding. After excluding genes with very low expression levels (mean count < 5), 18,301 genes were included in the statistical analyses.
The highest number of differentially expressed genes was observed on day 1 after vaccination, with 10,123 genes being significantly differentially expressed compared with day 0 (Figure 5 A), with a larger up- than downregulation (Figure 5B). When analyzing differential expression on day 1 in each dose group separately, a dose effect was apparent, with 3,509 differentially expressed genes in the lower dose group and 19,539 in the higher dose group (Figure S3). Among the 10,123 differentially expressed genes on day 1 overall (both dose groups combined), the 10 genes with the largest fold changes included CXCL10, the gene encoding for IP-10 (Table 2 ).
Figure 5.

Differentially Expressed Genes after Vaccination (n = 18 Trial Participants with Available RNA-Seq Data)
(A) Venn diagram of the number of differentially expressed genes per post-vaccination time point.
(B) Distribution of log fold changes on day 1. Each dot corresponds to a gene, plotted according to its mean log expression on the x axis and its log fold change on the y axis. Red dots indicate statistically significant differentially expressed genes.
See also Figures S2 and S3.
Table 2.
List of 10 Differentially Expressed Genes on Day 1 with the Largest Fold Changes
| Ensemble Gene ID | Gene Name | Day 0 Log2 Mean Expression | Day 1 log2 Fold Change | p Value |
|---|---|---|---|---|
| ENSG00000108700 | CCL8 | −1.79 | 9.15 | 1.33E−18 |
| ENSG00000108691 | CCL2 | 0.20 | 8.55 | 1.69E−18 |
| ENSG00000078081 | LAMP3 | 3.15 | 8.02 | 2.22E−27 |
| ENSG00000169245 | CXCL10 | 0.82 | 7.89 | 1.15E−19 |
| ENSG00000134321 | RSAD2 | 7.44 | 7.77 | 1.02E−28 |
| ENSG00000163666 | HESX1 | −0.94 | 7.52 | 8.26E−18 |
| ENSG00000184979 | USP18 | 4.05 | 7.34 | 2.46E−27 |
| ENSG00000187608 | ISG15 | 8.26 | 7.25 | 8.34E−28 |
| ENSG00000185745 | IFIT1 | 7.54 | 7.06 | 9.44E−30 |
| ENSG00000138646 | HERC5 | 6.78 | 6.79 | 6.18E−30 |
The p values were adjusted for multiple testing by the Benjamini-Hochberg procedure.
In canonical pathway analyses including all significant genes on day 1 (Ingenuity Pathways Analysis software), the top enriched pathways included the interferon signaling pathway, the pathway of pattern recognition receptors in recognition of bacteria and viruses, and the inflammasome pathway, which were all upregulated (Figure S4).
Early Gene Expression Signature Linked to the IP-10 Pathway Correlates with Later GP-Specific Antibody Responses to the Vaccine
We next assessed whether early gene expression correlates of later antibody responses could be identified. To do so, we used an unbiased approach, including gene expression levels of all analyzed genes (18,301 genes) on days 1, 3, and 7 as potential predictors regardless of their differential expression level. We again used sPLS to down-select an early signature of genes correlating with the multivariate antibody response measurements between day 28 and day 180. Bootstrapping methods were used in addition to leave-one-out cross-validation to avoid overfitting of the model.
Leave-one-out cross-validation identified a signature of gene expression comprising 15 genes on a single component that correlated with the later antibody responses (Figure S5). Of these, two genes were consistently more often selected using bootstrapping methods than the other genes. The first gene was TIFA (TRAF-interacting protein with forkhead-associated domain) on day 1, which is related to the IP-10 pathway (Figure 6 A). The second gene was SLC6A9 (solute carrier family 6 member 9) on day 3, which is not known to be related to the IP-10 pathway. Between these two genes, only TIFA was significantly differentially expressed at the concerned time point compared with baseline (D0 log2 mean expression, 3.38; D1 log2 fold change, 1.33; multiplicity-adjusted p value, 1.14E−09; Figure S6).
Figure 6.

IP-10 Gene Expression Pathway
(A) Pathway analyses of the TIFA gene, detected in the early gene expression signature, with regards to the IP-10 (CXCL-10) pathway.
(B) Observed correlations between TIFA gene expression on day 1, representative intermediate genes of the CXCL-10 pathway on day 1, CXCL10 gene expression on day or 3, and plasma IP-10 cytokine concentration on day 1 or 3; Pearson correlation coefficients are shown.
TIFA, TRAF-interacting protein with forkhead-associated domain; NFKB1, NF-κB subunit 1; NFKB2, NF-κB subunit 2; CHUK, conserved helix-loop-helix ubiquitous kinase; IKBKB, inhibitor of NF-κB kinase subunit beta; IKBKE, inhibitor of NF-κB kinase subunit epsilon; IKBKG, inhibitor of NF-κB kinase subunit gamma; TNFRSF1A, TNF receptor superfamily member 1A; TRAF2, TNF receptor-associated factor 2; CXCL10, C-X-C motif chemokine ligand 10; IP-10, plasma IP-10 cytokine concentration; IKK complex, IKB kinase complex; NfkB complex, nuclear factor κB complex. See also Figures S4 and S5.
Because pathway analyses were based on external curated databases (Ingenuity Pathways Analysis), we next assessed whether the correlations reflecting the identified pathways were also present in our dataset. Figure 6B shows the correlations between TIFA gene expression on day 1, representative intermediate genes of each pathway on day 1, CXCL10 gene expression on day 1 or 3, and plasma IP-10 cytokine concentration on day 1 or 3. These analyses identified the expected correlations between TIFA and the CXCL10 pathway in our dataset and suggested that the main pathway activation was via the nuclear factor κB (NF-κB) complex (strongest positive correlations between TIFA and NFKB1 and NFKB2, respectively, which are the genes representative of this complex). In the differential gene expression analyses, the NFKB1, NFKB2, and CXCL10 genes were also among the differentially upregulated genes at the indicated time points compared with baseline.
Discussion
The recent and unprecedented outbreak of Ebola virus disease (EVD) in West Africa led to the evaluation of the VSV-based Ebola vaccine rVSV-ZEBOV in an open-label, dose escalation, single-center phase 1 trial at the UKE. The vaccine induced EBOV-GP-specific antibodies in all trial participants, documenting its immunogenicity (Agnandji et al., 2016). Despite the uncertainty about which immune responses actually serve as correlates of protection from Ebola virus disease, initial studies suggested that GP-specific antibodies play a crucial role in conferring protection following vaccination in NHPs and vaccinated guinea pigs (Jones et al., 2005, Bukreyev et al., 2007, Wong et al., 2012, Warfield et al., 2007). Using a systems vaccinology approach to identify unique early innate immune signatures of emergency vaccines fills critical knowledge gaps and will facilitate the strategic design of future immunotherapeutic interventions.
In this study, we applied high-throughput technologies coupled with methods for integrative data analyses as powerful tools to investigate a large spectrum of innate cell surface markers, cytokines, and gene expression to determine whether early innate immune responses can serve as correlates of antibody induction in response to the rVSV-ZEBOV vaccine.
Longitudinal assessment of early innate immune responses showed a strong and early activation of innate immune responses as early as day 1 after vaccination. IP-10, MIP-1β, and MCP-1 were significantly induced by day 1 after vaccination, with dose-dependent peak levels of MCP-1 and IP-10. Increase in IP-10 levels after vaccination has also been reported in previous studies investigating immune responses to the yellow fever vaccine (Querec et al., 2009) and the inactivated trivalent inactivated influenza vaccine (TIV) (Nakaya et al., 2011). However, these studies did not include an analysis of any immune changes as early as day 1 and reported peak levels of cytokine levels on day 3 following vaccination. It therefore remains unclear whether the true peak was missed or is indeed reached at a later time point in these studies because dynamics of cytokine expression may depend on the vaccine or vector being used. In line with previous results of the aforementioned vaccine studies, we also observed a strong increase in the frequency of CD16+ inflammatory monocytes and CD86+ DCs and monocytes. We found peak expression to be reached as early as day 3 in our studies compared with day 7, as reported for the yellow fever vaccine (Querec et al., 2009), indicating that dynamics in surface marker expression on innate immune cells may indeed depend on the specific vaccine being tested. Changes in frequency or expression of further activating markers on antigen-presenting cells, as revealed by our study, have not been reported before. Particularly, changes in frequency and phenotype of NK cells following vaccination with rVSV-ZEBOV in humans have not been described in any previous vaccine study. Our data thus provide insights into the full picture of early vaccine-induced key mediators involved in the innate immune response to vaccination. NK cells have previously been suggested as critical players in the mediation of early protection against Ebola infection in NHPs; Marzi et al. (2015) showed that vaccination with rVSV-ZEBOV protected macaques against a lethal challenge with the West African EBOV-Makona strain. Intriguingly, complete and partial protection was achieved with a single dose given as late as 7 or 3 days before challenge, respectively, even before an adaptive antibody response had been developed (Marzi et al., 2015). Thus, Marzi et al. (2015) implicated a role for NK cells in conferring this early-induced protection after vaccination because the cytokine signature induced by the vaccine was highly suggestive of NK cell activation, eventually resulting in NK cell-mediated killing of virus-infected cells. Their findings suggest that vaccination-induced activation of NK cells could contribute to control of EBOV replication before specific antibody responses have developed. Furthermore, NK cells have also been implicated in survival of EBOV infections, showing a decisive role for NK cells during lethal Ebola virus infection (Feldmann et al., 2007, Warfield et al., 2004). In the present study, MFI of CXCR6 on CD56 dim NK cells and frequency of CD56bright NK cells were identified as positive correlates of the GP-specific antibody response, supporting the role of NK cells in shaping subsequent adaptive immunity. CXCR6, a member of the seven-transmembrane domain G protein-coupled chemokine receptor (CKR) family was shown to act as a chemokine-trafficking molecule and is indispensable for persistence of NK cell memory of haptens and viruses in animal models (Shimaoka et al., 2000, Paust and von Andrian, 2011, Paust et al., 2010). Future studies should explore whether these markers display a functional role in vaccine-induced generation of antibody responses.
Although IP-10 on day 3, CXCR6 on day 1, and the frequency of CD56bright NK cells on day 3 showed a positive correlation with antibody responses, antigen-presenting cells (inflammatory monocytes and mDCs) expressing the activating marker CD86 showed a negative association. CD86 is a costimulatory molecule that provides key signals required for T cell activation (Fanslow et al., 1994, Lu et al., 1996, Sansom et al., 2003). A negative effect of vaccine-induced inflammatory monocytes on T cell proliferation and antibody production has been reported previously in mice (Mitchell et al., 2012). Here, vaccination-induced inflammation, although necessary for effective immunity, also generated strong counter-regulatory immune responses that were mediated primarily by inflammatory monocytes through suppression of T cell responses. It was demonstrated that suppression of T cell help eventually led to reduced antibody titers in vaccinated mice, implicating a potential role for inhibition of monocyte-mediated inhibitory responses as an effective strategy for enhancing vaccine immunity. Because DCs share many features with monocytes as antigen-presenting cells, a counter-regulatory effect on the adaptive immune responses elicited by these cells may also be arguable but has yet to be demonstrated. Taken together, these data suggest that activated (inflammatory) monocytes have a negative effect on the generation of GP-specific antibody responses, reflecting a counter-regulatory, suppressive effect of these antigen-presenting cells on the development of adaptive immune responses.
The only soluble positive correlate of the GP-specific antibody response on day 28, IP-10, was statistically independent from the other down-selected innate immune markers. IP-10 is one of the most potent cytokines secreted from monocytes and DCs (Dufour et al., 2002). It is secreted from cells stimulated with type I and II IFNs and is a strong chemoattractant for activated T cells. IP-10 can generate and amplify antitumor immunity through recruitment of antigen-specific T cells to antigen-presenting DCs in draining lymph nodes (Christensen et al., 2006). Interestingly, studies have shown that, when linked to a model tumor antigen, IP-10 can increase tumor antigen-specific T cell immune responses in mice because of both enhanced antigen presentation and chemoattraction, thus enhancing vaccine potency (Kang et al., 2011). It has also been demonstrated that, in the setting of DC-based tumor vaccines, modification of the vaccine through addition of IP-10 generated more tumor antigen-specific CD8+ T cells and stronger anti-tumor effects in vaccinated mice compared with the control group (Kang et al., 2009, Kang et al., 2011).
Furthermore, next-generation RNA sequencing revealed dose-dependent differential gene expression on day 1 or 3 after vaccination with CXCL10, the gene encoding for IP-10, among the 10 genes with the largest fold changes. The gene signature identified through RNA sequencing correlated with the later antibody responses and included TIFA on day 1, which is related to the IP-10 pathway. This analysis was performed in an unbiased way, not influenced by the results from markers identified through cytokine/chemokine and flow cytometry analyses.
Here we show an innate signature that correlates with the antibody response to an Ebola vaccine that not only contains transcriptional data but, indeed, a soluble factor, IP-10, in addition to surface markers found on monocytes, DCs, and NK cells, identified through flow cytometry. Our results regarding the involvement of IP-10 in the early signature were consistent when analyzing gene expression levels instead of soluble and phenotypic markers. The transcriptional profiling analysis obtained through RNA sequencing (RNA-seq) in this Ebola vaccine trial now allows for a comprehensive systems vaccinology approach studying the only Ebola candidate vaccine, rVSV-ZEBOV, anticipated for licensure this year. In-depth characterization of immune responses as presented here, with early and frequent sampling, is usually also limited to and only feasible in a relatively small number of samples and participants. External validation datasets were not available, and the small sample size inherent to a phase I trial did not allow for splitting our own data into a test and validation set. However, we did perform statistical cross-validation and bootstrapping, which is a standard approach to assess the predictive capacity of a model in the context of a small sample size.
In conclusion, a systems vaccinology approach to comprehensively analyze high-dimensional innate immune markers allowed for the identification of two unique innate immune signatures as correlates of antibody induction following vaccination with the viral vector vaccine rVSV-ZEBOV. Our findings support efforts to further investigate the role of IP-10 to enhance vaccine immunogenicity. Together with studies confirming the immune correlates of protection from Ebola virus disease, this could ultimately lead to future studies testing IP-10 as an adjuvant for prophylactic vaccines.
Experimental Procedures
Flow Cytometry Analysis
PBMCs from days 0, 1, 3, 7, and 14 were obtained after Ficoll-Hypaque density gradient centrifugation of whole blood. At the same time, plasma was collected from each participant for further cytokine/chemokine analysis. PBMC samples were frozen in liquid nitrogen, thawed, stained, and acquired on an LSR Fortessa flow cytometer. For analysis of monocytes and distinction of DCs, samples were stained with CD56 (HCD56, catalog number 318316), CD3 (UCHT1, catalog number 300424), C19-Alexa 700 (HIB19, catalog number 302226), CD16-allophycocyanin (APC)-Cy7 (3G8, catalog number 302018), CD14-BV711 (M5E2, catalog number 301838), CD303 peridinin-chlorophyll proteins (PerCP)/Cy5.5 (201A, catalog number 354210), CD11c-APC (3.9, catalog number 301614), human leukocyte antigen (HLA)-antigen D-related (DR)-BV785 (L243, catalog number 307642), CD83-BV421 (HB15e, catalog number 305324), CD86-phycoerythrin (PE) Dazzle (IT2.2, catalog number 305434), CD40-PE (5C3, catalog number 334308), CD1c-fluorescein isothiocyanate (FITC) (L161, catalog number 331518), CD141-PE/Cy7 (M80, catalog number 344110), and CCR7-BV605 (G043H7, catalog number 353224). For characterization of NK cells, samples were stained with two panels: panel 1, CD3 (UCHT1)/CD19 (HIB19)/CD14 (HCD14)-Alexa 700, CD56 BV605 (HCD56, catalog number 318334), CD16-APC-Cy7 (3G8), NKG2A-FITC (Miltenyi Biotec, REA110), NKG2D-PerCP/Cy5.5 (1D11, catalog number 320818), Cd161-BV421 (HP-3G10, catalog number 339914), CD57-PE Dazzle (HNK-1, catalog number 359620), CD69-PE-Cy7 (FN50, catalog number 310912), anti-KIR2DE-PE (Miltenyi, clone NKVFS1, order number 130-092-688), KIR 3DL1/DL2-PE (Miltenyi, clone 5.133, order number 130-095-205), DNAM-1-APC (11A8, catalog number 338312), and CD38-BV711 (HIT2, catalog number 303528); panel 2, CD3/CD19/CD14-Alexa 700, CD56 BV605, CD16-APC-Cy7, 2B4-APC (C1.7, catalog number 329512), NKp30-PE (P30-15, catalog number 325208), CXCR6-BV421 (K041E5, catalog number 356014), NKG2C-AF488 (R&D Systems, clone 134591, order number FAB138G-100), and NKp46-PE-Cy7 (9E2, catalog number 331916).
If not stated otherwise, antibodies were purchased from BioLegend, and clones are stated within parenthesis. Dead cells were identified and then excluded from analysis by staining samples with LIVE/DEAD Zombie Aqua Dye (BioLegend). Data were analyzed using Flow Jo v.10. For the gating strategy of NK cells, DCs, and monocytes, see Figure S14. The investigator was not blinded to dose group or time point.
Cytokine and Chemokine Multiplex Analysis
Plasma samples from the 20 vaccinees investigated here were collected on days 0, 1, 3, 7, and 14 after vaccination and stored at −80°C prior to analysis. The assay was performed with an 11-Bioplex from Bio-Rad consisting of IFN-γ, IL-2, IL-6, IL-10, TNF-α, IL-12, MCP-1, MIP-1β, IL-1RA, and IP-10, with addition of IFN-α and TNF-β to make it a 13-plex assay. Samples were read in duplicates according to the manufacturer’s protocol on a Bio-Plex Luminex-200 (Bio-Rad) and analyzed using Bio-Plex Manager software.
RNA Extraction and Next-Generation RNA Sequencing
Whole blood from participants was directly collected into Paxgene RNA tubes (PreAnalytiX, QIAGEN) on days 0, 1, 3, and 7 after vaccination. All blood collection tubes were inverted for mixing immediately after collection and stored at room temperature before storage at −80°C, as indicated in the manufacturer’s protocol. RNA isolation of thawed samples was performed according to the manufacturer’s directions (PAXgene Blood RNA Kit Handbook, version 2, 2015) using the PAXgene blood RNA kit (PreAnalytiX, QIAGEN), including an optional DNase digestion step. Extracted RNA from all samples was stored at −80°C.
From total RNA, mRNA was extracted using the NEBNext Poly(A) mRNA magnetic isolation module (New England Biolabs), and RNA-seq libraries were generated using the NEBNext Ultra RNA Library Prep Kit for Illumina (NEB) according to the manufacturer’s recommendations. The size and quality of the libraries were visualized on a BioAnalyzer high-sensitivity chip (Agilent Technologies), and concentrations were determined with the Qubit 2.0 fluorometer (Life Technologies). Diluted libraries were multiplex-sequenced on the Illumina HiSeq 2500 instrument (single read, 50-bp run). Samples with RNA integrity number (RIN) < 8, with insufficient library concentration, or with a sequencing depth ≤ 5 million reads were excluded from the analyses. Among the included samples, the median sequencing depth was 45 million reads (interquartile range, 40–52 million).
Quality control of the RNA-seq raw data were performed with the FASTQC visualization software. Reads were aligned to the human reference assembly (GRCh38.p7) using STAR (v2.4.2a). The option “–quantMode GeneCounts” was applied to estimate the reads per gene simultaneously and generate count data. All reads mapping to an exon were attributed to a given gene, and counts were done at the gene level (because isoforms and splice variants were not a focus of this study). Multimapper was excluded from the count. Gene annotation was obtained from Ensembl (release 79, http://www.ensembl.org).
Statistics
The sample size of this phase I, non-randomized, open-label, dose escalation study with n = 10 trial participants per dose group was designed to assess major safety risks as the primary endpoint, the results of which have been published previously (Agnandji et al., 2016). The present ancillary study used all samples from all trial participants in the two reported dose groups. For assessment of the early correlates of antibody responses, we pooled both dose groups because our objective was to assess whether an early innate immune signature would be a correlate of the later antibody response regardless of the dose level received and because the sample size was too small to allow for stratified analyses. Moreover, the individual distributions of IP-10 levels and antibody levels indicate that, although a dose effect is visible, response levels overlap between groups.
All statistical tests were two-sided. Wilcoxon signed-rank test results were corrected for test multiplicity using the adaptive FDR method (Benjamini and Hochberg, 2000).
For integrative statistical analyses, sPLS (Lê Cao et al., 2008, Boulesteix and Strimmer, 2007, Liquet et al., 2012, Liquet et al., 2016) gathers a dimension-reduction approach together with a variable selection and a regression method. It is thus suited for the analysis of high-dimensional datasets, with highly correlated explanatory variables (such as innate immune response variables), and can leverage multivariate outcomes at once (namely EBOV-Kikwit-specific GP antibody level on day 28, and EBOV-Gueckedou-specific GP antibody levels on days 28, 56, 84, and 180) while taking into account the within-subject correlation. The final sPLS model was selected through cross-validated mean squared error of prediction (MSEP() and proportion of explained variance, whereas final multivariable linear regression models were selected using cross-validated RSR as well as a goodness-of-fit criterion (adjusted coefficient of determination, R2). All variables were centered and reduced for sPLS analyses, whereas original variables were used in the multivariable linear model (for interpretation in their biological measurement units). Missing values were imputed (among the four cell populations finally selected by sPLS, this only concerns CXCR6 for one participant).
The analyses of differential gene expression after vaccination included all available RNA-seq data (56 samples from 18 participants) and used the voom/limma pipeline (Law et al., 2014). We tested the null hypothesis of log2 fold change = 0 (compared with day 0) for each gene. Multiplicity-adjusted p < 0.05 using FDR control (Benjamini and Hochberg, 1995) was considered statistically significant.
For the integrative analyses assessing early gene expression correlates of later antibody responses, we used the normalized gene expression levels on days 1, 3, and 7 as predictor variables, and all genes with a mean raw count > 5 (18,301 per time point) were included in these analyses. Participants with intermittently missing RNA-seq samples (i.e., at most 2 of the 3 time points missing) were included in the analyses, the missing RNA-seq data being imputed using the matrix completion package softImpute (Mazumder et al., 2010). sPLS models were then used to down-selected the predictor genes correlating with the multivariate antibody response measurements, similar to the cytokine and cell population integrative analyses. The robustness of the selection was assessed through 1,000-fold bootstrap.
Statistical analyses were performed with R software, version 3.2.2 (The R Foundation, Vienna, Austria). Pathway analyses were performed with Ingenuity Pathways Analysis software, version v31813283 (QIAGEN). Additional details regarding experimental procedures are shown in the Supplemental Experimental Procedures.
Institutional Permission
All trial participants gave informed consent, and the clinical trial protocol received ethics approval (Ethik-Kommission Ärztekammer Hamburg and WHO Ethics Committee) and regulatory clearance through the competent authority (Paul Ehrlich Institute). Written informed consent was received from participants prior to inclusion in the study (ClinicalTrials.gov NCT02283099). The two groups of trial participants included 13 male and 7 female participants aged between 18 and 55 years.
Author Contributions
The work presented here was carried out in collaboration between all authors. M.M.A., M.A., and R.T. made substantial contributions to conception and design and interpretation of data and participated in critically revising the manuscript for important intellectual content. A.R., L.R., and H.L. made substantial contributions to conception and design and analysis and interpretation of data. A.R. and L.R. drafted the manuscript. A.R. also participated in acquisition of data. G.M., B.P.H., C.D., R.K., H.C.S., M.E.Z., V.K., S.B., and M.E. made substantial contributions to conception and design and acquisition of data and participated in critically revising the manuscript for important intellectual content. A.W.L. and the VEBCON Consortium made substantial contributions to conception and design and participated in critically revising the manuscript for important intellectual content. All authors read and gave final approval of the version to be submitted and any revised version.
Consortium
The members of VEBCON are Selidji Todagbe Agnandji, Sanjeev Krishna, Peter G. Kremsner, Jessica S. Brosnahan, Philip Bejon, Patricia Njuguna, Marylyn M. Addo, Stephan Becker, Verena Krähling, Claire-Anne Siegrist, Angela Huttner, Marie-Paule Kieny, Vasee Moorthy, Patricia Fast, Barbara Savarese, and Olivier Lapujade.
Acknowledgments
We thank all volunteers for participation in the trial. We thank Henri Bonnabau (SISTM, INSERM U1219/Inria, University of Bordeaux) for help with data management. We also thank Stephanie Jost (Harvard Medical School Center for Virology and Vaccine Research Beth Israel Deaconess Medical Center, Boston) for critically reading the manuscript and giving helpful comments. This work was funded by the German Center for Infection Research (DZIF), the Universitätsklinikum Hamburg-Eppendorf (legal sponsor), Wellcome Trust, the German Ministry for Education and Research (BMBF) through the Ebokon program and the German Ministry of Health (BMG). A.R. was supported by DZIF through a MD/Ph.D. stipend and through the Clinician Scientist Program of the Faculty of Medicine, University Medical Center Hamburg-Eppendorf (Hamburg, Germany). L.R. and R.T. are also involved in the EU-IMI-2-funded EBOVAC2 project assessing Ebola candidate vaccines from Johnson and Johnson and Bavarian Nordic and in the PREVAC project (funded by NIH and INSERM) assessing Ebola candidate vaccines from Merck, Johnson and Johnson, and Bavarian Nordic.
Published: August 29, 2017
Footnotes
Supplemental Information includes Supplemental Experimental Procedures, six figures, and four tables and can be found with this article online at http://dx.doi.org/10.1016/j.celrep.2017.08.023.
Contributor Information
Anne Rechtien, Email: anne.rechtien@leibniz-hpi.de.
Marylyn Addo, Email: m.addo@uke.de.
VEBCON Consortium:
Selidji Todagbe Agnandji, Sanjeev Krishna, Peter G. Kremsner, Jessica S. Brosnahan, Philip Bejon, Patricia Njuguna, Marylyn M. Addo, Stephan Becker, Verena Krähling, Claire-Anne Siegrist, Angela Huttner, Marie-Paule Kieny, Vasee Moorthy, Patricia Fast, Barbara Savarese, and Olivier Lapujade
Accession Numbers
The accession number for the RNA-seq data reported in this paper is NCBI GEO: GSE97590.
Supplemental Information
References
- Agnandji S.T., Huttner A., Zinser M.E., Njuguna P., Dahlke C., Fernandes J.F., Yerly S., Dayer J.A., Kraehling V., Kasonta R. Phase 1 Trials of rVSV Ebola Vaccine in Africa and Europe. N. Engl. J. Med. 2016;374:1647–1660. doi: 10.1056/NEJMoa1502924. [DOI] [PMC free article] [PubMed] [Google Scholar]
- Barouch D.H., Liu J., Peter L., Abbink P., Iampietro M.J., Cheung A., Alter G., Chung A., Dugast A.S., Frahm N. Characterization of humoral and cellular immune responses elicited by a recombinant adenovirus serotype 26 HIV-1 Env vaccine in healthy adults (IPCAVD 001) J. Infect. Dis. 2013;207:248–256. doi: 10.1093/infdis/jis671. [DOI] [PMC free article] [PubMed] [Google Scholar]
- Benjamini Y., Hochberg Y. Controlling the false discovery rate: a practical and powerful approach to multiple testing. J. R. Stat. Soc. B. 1995;57:289–300. [Google Scholar]
- Benjamini Y., Hochberg Y. On the adaptive control of the false discovery fate in multiple testing with independent statistics. J. Educ. Behav. Stat. 2000;25:60–83. [Google Scholar]
- Betancourt D., de Queiroz N.M., Xia T., Ahn J., Barber G.N. Cutting Edge: Innate Immune Augmenting Vesicular Stomatitis Virus Expressing Zika Virus Proteins Confers Protective Immunity. J. Immunol. 2017;198:3023–3028. doi: 10.4049/jimmunol.1602180. [DOI] [PubMed] [Google Scholar]
- Boulesteix A.L., Strimmer K. Partial least squares: a versatile tool for the analysis of high-dimensional genomic data. Brief. Bioinform. 2007;8:32–44. doi: 10.1093/bib/bbl016. [DOI] [PubMed] [Google Scholar]
- Bukreyev A., Rollin P.E., Tate M.K., Yang L., Zaki S.R., Shieh W.J., Murphy B.R., Collins P.L., Sanchez A. Successful topical respiratory tract immunization of primates against Ebola virus. J. Virol. 2007;81:6379–6388. doi: 10.1128/JVI.00105-07. [DOI] [PMC free article] [PubMed] [Google Scholar]
- Christensen J.E., de Lemos C., Moos T., Christensen J.P., Thomsen A.R. CXCL10 is the key ligand for CXCR3 on CD8+ effector T cells involved in immune surveillance of the lymphocytic choriomeningitis virus-infected central nervous system. J. Immunol. 2006;176:4235–4243. doi: 10.4049/jimmunol.176.7.4235. [DOI] [PubMed] [Google Scholar]
- Dufour J.H., Dziejman M., Liu M.T., Leung J.H., Lane T.E., Luster A.D. IFN-gamma-inducible protein 10 (IP-10; CXCL10)-deficient mice reveal a role for IP-10 in effector T cell generation and trafficking. J. Immunol. 2002;168:3195–3204. doi: 10.4049/jimmunol.168.7.3195. [DOI] [PubMed] [Google Scholar]
- Fanslow W.C., Clifford K.N., Seaman M., Alderson M.R., Spriggs M.K., Armitage R.J., Ramsdell F. Recombinant CD40 ligand exerts potent biologic effects on T cells. J. Immunol. 1994;152:4262–4269. [PubMed] [Google Scholar]
- Feldmann H., Jones S.M., Daddario-DiCaprio K.M., Geisbert J.B., Ströher U., Grolla A., Bray M., Fritz E.A., Fernando L., Feldmann F. Effective post-exposure treatment of Ebola infection. PLoS Pathog. 2007;3:e2. doi: 10.1371/journal.ppat.0030002. [DOI] [PMC free article] [PubMed] [Google Scholar]
- Furman D., Jojic V., Kidd B., Shen-Orr S., Price J., Jarrell J., Tse T., Huang H., Lund P., Maecker H.T. Apoptosis and other immune biomarkers predict influenza vaccine responsiveness. Mol. Syst. Biol. 2013;9:659. doi: 10.1038/msb.2013.15. [DOI] [PMC free article] [PubMed] [Google Scholar]
- Gaucher D., Therrien R., Kettaf N., Angermann B.R., Boucher G., Filali-Mouhim A., Moser J.M., Mehta R.S., Drake D.R., 3rd, Castro E. Yellow fever vaccine induces integrated multilineage and polyfunctional immune responses. J. Exp. Med. 2008;205:3119–3131. doi: 10.1084/jem.20082292. [DOI] [PMC free article] [PubMed] [Google Scholar]
- Geisbert T.W., Daddario-Dicaprio K.M., Lewis M.G., Geisbert J.B., Grolla A., Leung A., Paragas J., Matthias L., Smith M.A., Jones S.M. Vesicular stomatitis virus-based ebola vaccine is well-tolerated and protects immunocompromised nonhuman primates. PLoS Pathog. 2008;4:e1000225. doi: 10.1371/journal.ppat.1000225. [DOI] [PMC free article] [PubMed] [Google Scholar]
- Geisbert T.W., Geisbert J.B., Leung A., Daddario-DiCaprio K.M., Hensley L.E., Grolla A., Feldmann H. Single-injection vaccine protects nonhuman primates against infection with marburg virus and three species of ebola virus. J. Virol. 2009;83:7296–7304. doi: 10.1128/JVI.00561-09. [DOI] [PMC free article] [PubMed] [Google Scholar]
- Henao-Restrepo A.M., Camacho A., Longini I.M., Watson C.H., Edmunds W.J., Egger M., Carroll M.W., Dean N.E., Diatta I., Doumbia M. Efficacy and effectiveness of an rVSV-vectored vaccine in preventing Ebola virus disease: final results from the Guinea ring vaccination, open-label, cluster-randomised trial (Ebola Ça Suffit!) Lancet. 2017;389:505–518. doi: 10.1016/S0140-6736(16)32621-6. [DOI] [PMC free article] [PubMed] [Google Scholar]
- Jones S.M., Feldmann H., Ströher U., Geisbert J.B., Fernando L., Grolla A., Klenk H.D., Sullivan N.J., Volchkov V.E., Fritz E.A. Live attenuated recombinant vaccine protects nonhuman primates against Ebola and Marburg viruses. Nat. Med. 2005;11:786–790. doi: 10.1038/nm1258. [DOI] [PubMed] [Google Scholar]
- Kang T.H., Bae H.C., Kim S.H., Seo S.H., Son S.W., Choi E.Y., Seong S.Y., Kim T.W. Modification of dendritic cells with interferon-gamma-inducible protein-10 gene to enhance vaccine potency. J. Gene Med. 2009;11:889–898. doi: 10.1002/jgm.1371. [DOI] [PubMed] [Google Scholar]
- Kang T.H., Kim K.W., Bae H.C., Seong S.Y., Kim T.W. Enhancement of DNA vaccine potency by antigen linkage to IFN-γ-inducible protein-10. Int. J. Cancer. 2011;128:702–714. doi: 10.1002/ijc.25391. [DOI] [PubMed] [Google Scholar]
- Law C.W., Chen Y., Shi W., Smyth G.K. voom: Precision weights unlock linear model analysis tools for RNA-seq read counts. Genome Biol. 2014;15:R29. doi: 10.1186/gb-2014-15-2-r29. [DOI] [PMC free article] [PubMed] [Google Scholar]
- Lê Cao K.A., Rossouw D., Robert-Granié C., Besse P. A sparse PLS for variable selection when integrating omics data. Stat. Appl. Genet. Mol. Biol. 2008;7:35. doi: 10.2202/1544-6115.1390. [DOI] [PubMed] [Google Scholar]
- Li S., Rouphael N., Duraisingham S., Romero-Steiner S., Presnell S., Davis C., Schmidt D.S., Johnson S.E., Milton A., Rajam G. Molecular signatures of antibody responses derived from a systems biology study of five human vaccines. Nat. Immunol. 2014;15:195–204. doi: 10.1038/ni.2789. [DOI] [PMC free article] [PubMed] [Google Scholar]
- Liquet B., Lê Cao K.A., Hocini H., Thiébaut R. A novel approach for biomarker selection and the integration of repeated measures experiments from two assays. BMC Bioinformatics. 2012;13:325. doi: 10.1186/1471-2105-13-325. [DOI] [PMC free article] [PubMed] [Google Scholar]
- Liquet B., de Micheaux P.L., Hejblum B.P., Thiébaut R. Group and sparse group partial least square approaches applied in genomics context. Bioinformatics. 2016;32:35–42. doi: 10.1093/bioinformatics/btv535. [DOI] [PubMed] [Google Scholar]
- Lu P., Urban J.F., Zhou X.D., Chen S.J., Madden K., Moorman M., Nguyen H., Morris S.C., Finkelman F.D., Gause W.C. CD40-mediated stimulation contributes to lymphocyte proliferation, antibody production, eosinophilia, and mastocytosis during an in vivo type 2 response, but is not required for T cell IL-4 production. J. Immunol. 1996;156:3327–3333. [PubMed] [Google Scholar]
- Marzi A., Robertson S.J., Haddock E., Feldmann F., Hanley P.W., Scott D.P., Strong J.E., Kobinger G., Best S.M., Feldmann H. EBOLA VACCINE. VSV-EBOV rapidly protects macaques against infection with the 2014/15 Ebola virus outbreak strain. Science. 2015;349:739–742. doi: 10.1126/science.aab3920. [DOI] [PMC free article] [PubMed] [Google Scholar]
- Mazumder R., Hastie T., Tibshirani R. Spectral Regularization Algorithms for Learning Large Incomplete Matrices. J. Mach. Learn. Res. 2010;11:2287–2322. [PMC free article] [PubMed] [Google Scholar]
- Mitchell L.A., Henderson A.J., Dow S.W. Suppression of vaccine immunity by inflammatory monocytes. J. Immunol. 2012;189:5612–5621. doi: 10.4049/jimmunol.1202151. [DOI] [PMC free article] [PubMed] [Google Scholar]
- Nakaya H.I., Wrammert J., Lee E.K., Racioppi L., Marie-Kunze S., Haining W.N., Means A.R., Kasturi S.P., Khan N., Li G.M. Systems biology of vaccination for seasonal influenza in humans. Nat. Immunol. 2011;12:786–795. doi: 10.1038/ni.2067. [DOI] [PMC free article] [PubMed] [Google Scholar]
- Paust S., von Andrian U.H. Natural killer cell memory. Nat. Immunol. 2011;12:500–508. doi: 10.1038/ni.2032. [DOI] [PubMed] [Google Scholar]
- Paust S., Gill H.S., Wang B.Z., Flynn M.P., Moseman E.A., Senman B., Szczepanik M., Telenti A., Askenase P.W., Compans R.W., von Andrian U.H. Critical role for the chemokine receptor CXCR6 in NK cell-mediated antigen-specific memory of haptens and viruses. Nat. Immunol. 2010;11:1127–1135. doi: 10.1038/ni.1953. [DOI] [PMC free article] [PubMed] [Google Scholar]
- Pulendran B., Li S., Nakaya H.I. Systems vaccinology. Immunity. 2010;33:516–529. doi: 10.1016/j.immuni.2010.10.006. [DOI] [PMC free article] [PubMed] [Google Scholar]
- Qiu X., Fernando L., Alimonti J.B., Melito P.L., Feldmann F., Dick D., Ströher U., Feldmann H., Jones S.M. Mucosal immunization of cynomolgus macaques with the VSVDeltaG/ZEBOVGP vaccine stimulates strong ebola GP-specific immune responses. PLoS ONE. 2009;4:e5547. doi: 10.1371/journal.pone.0005547. [DOI] [PMC free article] [PubMed] [Google Scholar]
- Querec T.D., Akondy R.S., Lee E.K., Cao W., Nakaya H.I., Teuwen D., Pirani A., Gernert K., Deng J., Marzolf B. Systems biology approach predicts immunogenicity of the yellow fever vaccine in humans. Nat. Immunol. 2009;10:116–125. doi: 10.1038/ni.1688. [DOI] [PMC free article] [PubMed] [Google Scholar]
- Sansom D.M., Manzotti C.N., Zheng Y. What’s the difference between CD80 and CD86? Trends Immunol. 2003;24:314–319. doi: 10.1016/s1471-4906(03)00111-x. [DOI] [PubMed] [Google Scholar]
- Shimaoka T., Kume N., Minami M., Hayashida K., Kataoka H., Kita T., Yonehara S. Molecular cloning of a novel scavenger receptor for oxidized low density lipoprotein, SR-PSOX, on macrophages. J. Biol. Chem. 2000;275:40663–40666. doi: 10.1074/jbc.C000761200. [DOI] [PubMed] [Google Scholar]
- Teigler J.E., Iampietro M.J., Barouch D.H. Vaccination with adenovirus serotypes 35, 26, and 48 elicits higher levels of innate cytokine responses than adenovirus serotype 5 in rhesus monkeys. J. Virol. 2012;86:9590–9598. doi: 10.1128/JVI.00740-12. [DOI] [PMC free article] [PubMed] [Google Scholar]
- Warfield K.L., Perkins J.G., Swenson D.L., Deal E.M., Bosio C.M., Aman M.J., Yokoyama W.M., Young H.A., Bavari S. Role of natural killer cells in innate protection against lethal ebola virus infection. J. Exp. Med. 2004;200:169–179. doi: 10.1084/jem.20032141. [DOI] [PMC free article] [PubMed] [Google Scholar]
- Warfield K.L., Swenson D.L., Olinger G.G., Kalina W.V., Aman M.J., Bavari S. Ebola virus-like particle-based vaccine protects nonhuman primates against lethal Ebola virus challenge. J. Infect. Dis. 2007;196(Suppl 2):S430–S437. doi: 10.1086/520583. [DOI] [PubMed] [Google Scholar]
- Wong G., Richardson J.S., Pillet S., Patel A., Qiu X., Alimonti J., Hogan J., Zhang Y., Takada A., Feldmann H., Kobinger G.P. Immune parameters correlate with protection against ebola virus infection in rodents and nonhuman primates. Sci. Transl. Med. 2012;4:158ra146. doi: 10.1126/scitranslmed.3004582. [DOI] [PMC free article] [PubMed] [Google Scholar]
Associated Data
This section collects any data citations, data availability statements, or supplementary materials included in this article.