Abstract
Purpose
No direct comparisons between extreme hypofractionation and conventional fractionation have been reported in randomized trials for the treatment of localized prostate cancer. The goal of this study is to use a propensity score matched (PSM) analysis with the National Cancer Database (NCDB) for the comparison of stereotactic body radiation therapy (SBRT) and intensity modulated radiation therapy (IMRT) for organ confined prostate cancer.
Methods
Men with localized prostate cancer treated with radiation dose ≥72 Gy for IMRT and ≥35 Gy for SBRT to the prostate only were abstracted from the NCDB. Men treated with previous surgery, brachytherapy, or proton therapy were excluded. Matching was performed to eliminate confounding variables via PSM. Simple 1–1 nearest neighbor matching resulted in a matched sample of 5,430 (2,715 in each group). Subset analyses of men with prostate-specific antigen (PSA) > 10, GS = 7, and GS > 7 yielded matched samples of 1,020, 2,194, and 247, respectively.
Results
No difference in survival was noted between IMRT and SBRT at 8 years (p = 0.65). Subset analyses of higher risk men with PSA > 10 or GS = 7 histology or GS > 7 histology revealed no difference in survival between IMRT and SBRT (p = 0.58, p = 0.68, and p = 0.62, respectively). Variables significant for survival for the matched group included: age (p < 0.0001), primary payor (p = 0.0001), Charlson/Deyo Score (p = 0.0002), PSA (p = 0.0013), Gleason score (p < 0.0001), and use of hormone therapy (p = 0.02).
Conclusion
Utilizing the NCDB, there is no difference in survival at 8 years comparing IMRT to SBRT in the treatment of localized prostate cancer. Subset analysis confirmed no difference in survival even for intermediate- and high-risk patients based on Gleason Score and PSA.
Keywords: stereotactic body radiation therapy, intensity modulated radiation therapy, prostate cancer, National Cancer Database, overall survival
Summary
The use of extreme hypofractionation using stereotactic body radiation therapy (SBRT) for localized prostate cancer remains controversial. There are no current randomized controlled trials comparing SBRT for localized prostate cancer with the current standard, intensity modulated radiation therapy (IMRT). Using the National Cancer Database with propensity score matching, we demonstrate no survival difference between SBRT and IMRT, including subset analysis of intermediate- and high-risk patients.
Introduction
Intensity modulated radiation therapy (IMRT) is a standard radiation modality used in the treatment of organ confined prostate cancer. Ten-year actuarial data (median follow-up of 8 years) is available for high-dose IMRT up to 81 Gy which demonstrates high efficacy in preventing biochemical failure with acceptable side effects (1). Stereotactic body radiation therapy (SBRT) has been accepted as an “appropriate alternative for select patients with low to intermediate-risk disease” as per the ASTRO policy update of April 2013 and is also supported by the National Comprehensive Cancer Network (NCCN). SBRT publications have validated freedom from biochemical failure (FFBF) with up to 9-year actuarial data (median follow-up of 7 years) and side effect rates comparable with IMRT (2–4).
The combination of prostate cancer’s low a/b ratio, known benefit of dose-escalation, and efficacy/safety of high-dose rate brachytherapy led to single institutional, multi-institutional, and randomized clinical trials of SBRT for the treatment of prostate cancer (5, 6). Randomized data are lacking comparing the outcome of treatment for SBRT compared with IMRT for localized prostate cancer. The primary goal of this study is to compare survival between SBRT and IMRT for men with organ confined prostate cancer utilizing the National Cancer Database (NCDB).
Materials and Methods
The NCDB is jointly sponsored by the American College of Surgeons and the American Cancer Society. It is a clinical oncology database sourced from hospital registry data collected in more than 1,500 commission on cancer-accredited facilities. NCDB data are used to analyze and track patients with malignant neoplastic diseases, their treatments, and outcomes. Data represent approximately 70% of newly diagnosed cancer cases nationwide and 30 million historical records. The NCDB includes prostate cancer patients treated from 2004 to 2013 providing information on demographics, risk factors specific to prostate cancer, staging information, treatment, and survival data. Patients are de-identified and the database is then sent to individual researchers for analysis after application and acceptance for individual projects.
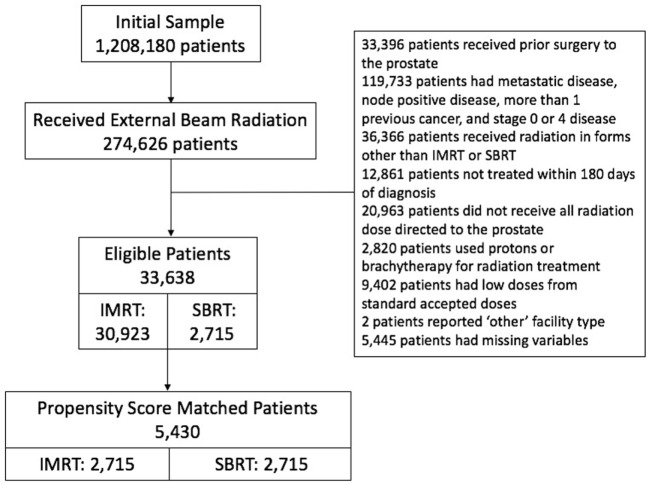
We initially identified 274,626 patients who received external beam radiation of some form. We excluded those patients who received prior surgery to the prostate. We excluded all but those patients who were listed as invasive adenocarcinoma of the prostate. We excluded those patients with metastatic disease, node positive disease, more than one previous cancer, and stages 0 and 4 disease. Of those, we excluded patients who received radiation in forms other than IMRT or SBRT. We included all patients diagnosed between 2004 and 2013 and treated within 180 days of diagnosis to rule out patients on active surveillance. We included only men that received all radiation dose directed to the prostate, therefore men were excluded if the pelvis was included in the initial treatment volume. Men were excluded if protons or brachytherapy was used for radiation treatment. We then reviewed total radiation dose and excluded low doses that were clearly outliers from standard accepted doses during that time interval, range 35–50 Gy for SBRT and 72–86.4 Gy for IMRT. Patients with missing variables were then excluded, leaving 33,638 patients (Figure 1-CONSORT diagram).
Figure 1.
CONSORT diagram.
Patients were then matched using propensity score matched (PSM) between treatment groups (IMRT or SBRT). The primary endpoint was overall survival (OS).
Demographic variables evaluable from the NCDB and matched by PSM include year of diagnosis, age, race, insurance status, residence location, median household income, patient comorbidity via the Charlson–Deyo comorbidity score, facility type, and treatment facility volume (divided into tertiles). Tumor and treatment specific factors evaluable from the NCDB include prostate-specific antigen (PSA), T stage, and Gleason score as well as use of androgen deprivation therapy. Radiation treatment dose was also stratified into low, medium, and high categories to be sure varying dose levels were evenly distributed between treatment groups. IMRT doses were defined as 7,200–7,559 cGy for low, 7,560–7,799 cGy for medium, and 7,800–8,640 cGy high. SBRT doses were defined as 3,500–3,624 cGy for low, 3,625–3,750 cGy for medium, and 3,751–5,000 cGy for high. All other doses below or above these defined categories were excluded.
Age was stratified into six groups (<55, 55–59, 60–64, 65–69, 70–74, 75–90 years). Race was characterized as either African–American, white, others, and unknown. Insurance status was outlined by the NCDB into six categories (Medicaid, Medicare, not insured, insurance status unknown, other governmental insurance, private insurance). The NCDB labeled residence location as metropolitan, rural, or urban using published files by the US Department of Agriculture Economic Research Service. Median household income was divided into quartiles <38K, 38–47,999, 48–62,999, +63, and unknown using average county level data from patient zip codes. Patient co-morbidities were coded as Charlson–Deyo comorbidity scores 0, 1, ≥2 (7). Type of cancer facility included academic/research programs, community cancer programs, comprehensive community cancer programs, integrated network cancer programs, and other. The NCDB used the American Joint Committee on Cancer Staging Atlas, sixth, and seventh edition for staging as appropriate for year of diagnosis.
Treatment groups were compared on demographic and clinical characteristics using χ2 test statistics. Propensity score 1–1 nearest neighbor matching without replacement was used to match treatment groups. Absolute standard mean differences (ASMDs) were used as a balance statistic for individual covariates, where an ASMD below 0.20 is desirable for all variables. Patients in the IMRT group were well matched with patients in the SBRT group on the following characteristics: age, race, residence, insurance status, median household income, Charlson–Deyo comorbidity scores, treatment facility type, year of diagnosis, tumor stage, PSA, and Gleason score. Scores calculated were blinded from researchers with respect to patient outcomes. OS was calculated from date of diagnosis to date of death or last follow-up. OS was estimated using Kaplan–Meier methodology, forming the basis of survival curves, and univariate comparisons were accomplished using log-rank test statistics. Propensity score matching was conducted using the MatchIt package in R version 3.30. All other statistical analyses were performed using SAS version 9.4 (SAS Inc., Cary, NC, USA).
This study was approved and carried out in accordance with the recommendations of the NCDB which provided a de-identified file for investigator use. The NCDB is not responsible for the analytical methodology or conclusions of the investigator.
Results
Patient Matching
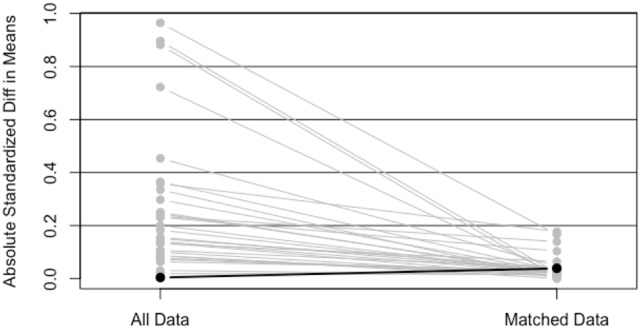
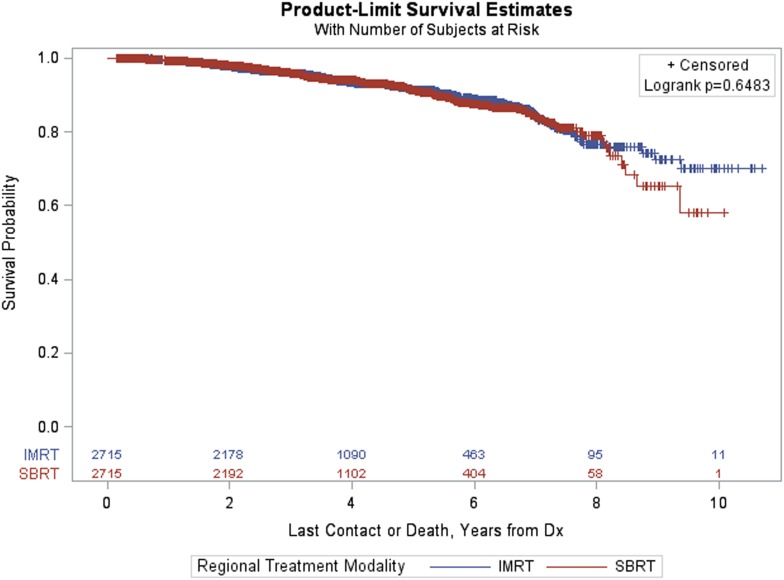
Simple 1–1 nearest neighbor matching resulted in a matched sample of 5,430 with 2,715 in each group. Since these groups were well matched on the basis of ASMDs below 0.2, comparisons between treatment groups (IMRT, SBRT) could be made using a Kaplan–Meier curve, and a log-rank test statistic (Figure 2). The p-value corresponding to the log-rank test was above 0.05 (p = 0.6483), indicating that no significant differences between treatment groups were observed after matching.
Figure 2.
Plot of absolute standard mean differences (ASMDs) for original data and after 1–1 nearest neighbor PS matching.
Patient Characteristics
A total of 5,430 men were included in the analysis after applying inclusion criteria, exclusion criteria, and performing PSM. There were 2,715 patients (50%) treated with SBRT and 2,715 patients (50%) treated with IMRT. Survival was evaluable through 8 years on the basis of an adequate number of patients at risk. Patient and treatment characteristics by treatment group are provided in Table 1.
Table 1.
Population characteristics of matched sample by treatment group.
| Characteristic | All patients N = 5,430 N (%) | IMRT N = 2,715 N (%) | SBRT N = 2,715 N (%) | p-Values |
|---|---|---|---|---|
| Age | 0.4032 | |||
| <55 | 275 (5.1%) | 123 (4.5%) | 152 (5.6%) | |
| 55–59 | 518 (9.5%) | 260 (9.6%) | 258 (9.5%) | |
| 60–64 | 1,411 (25.9%) | 438 (16.1%) | 454 (16.7%) | |
| 65–69 | 1,276 (23.5%) | 715 (26.3%) | 696 (25.6%) | |
| 70–74 | 1,058 (19.5%) | 658 (24.2%) | 618 (22.8%) | |
| 75–90 | 1,058 (19.5%) | 521 (19.2%) | 537 (19.8%) | |
| Race | 0.4803 | |||
| Black | 597 (11.0%) | 281 (10.4%) | 316 (11.6%) | |
| Other | 79 (1.5%) | 38 (1.4%) | 41 (1.5%) | |
| Unknown | 40 (0.7%) | 20 (0.7%) | 20 (0.7%) | |
| White | 4,714 (86.8%) | 2,376 (87.5%) | 2,338 (86.1%) | |
| Insurance status | 0.9208 | |||
| Insurance status unknown | 59 (1.1%) | 31 (1.1%) | 28 (1.0%) | |
| Medicaid | 50 (0.9%) | 24 (0.9%) | 26 (1.0%) | |
| Medicare | 3,289 (60.6%) | 1,653 (60.9%) | 1,636 (60.3%) | |
| Not insured | 56 (1.0%) | 30 (1.1%) | 26 (1.0%) | |
| Other government | 52 (1.0%) | 23 (0.9%) | 29 (1.1%) | |
| Private insurance | 1,924 (35.4%) | 954 (35.1%) | 971 (35.7%) | |
| Patient residence | 0.5233 | |||
| Metropolitan | 4,894 (90.1%) | 2,442 (89.9%) | 2,452 (90.3%) | |
| Rural | 48 (0.9%) | 21 (0.8%) | 27 (1.0%) | |
| Urban | 488 (9.0%) | 252 (9.3%) | 236 (8.7%) | |
| Median household income (US$) | 0.0746 | |||
| <38,000 | 451 (8.3%) | 214 (7.9%) | 237 (8.7%) | |
| 38,000–47,999 | 773 (14.2%) | 394 (14.5%) | 379 (14.0%) | |
| 48,000–62,999 | 1,223 (22.5%) | 647 (23.8%) | 576 (21.2%) | |
| 63,000+ | 2,983 (54.9%) | 1,460 (53.8%) | 1,523 (56.1%) | |
| Charlson–Deyo comorbidity score | 0.0155 | |||
| 0 | 4,783 (88.1%) | 2,417 (89.0%) | 2,366 (87.2%) | |
| 1 | 555 (10.2%) | 247 (9.1%) | 308 (11.3%) | |
| 2 | 92 (1.7%) | 51 (1.9%) | 41 (1.5%) | |
| Facility type | 0.0026 | |||
| Academic/research program | 2,660 (49.0%) | 1,269 (46.7%) | 1,391 (51.2%) | |
| Community cancer program | 55 (1.0%) | 27 (1.0%) | 28 (1.0%) | |
| Comprehensive community program | 2,291 (42.2%) | 1,214 (44.7%) | 1,077 (39.7%) | |
| Integrated network cancer program | 424 (7.8%) | 205 (7.6%) | 219 (8.1%) | |
| Year of diagnosis | 0.5820 | |||
| 2004–2009 | 2,266 (41.7%) | 1,123 (41.4%) | 1,143 (42.1%) | |
| 2010–2013 | 3,164 (58.3%) | 1,592 (58.6%) | 1,572 (57.9%) | |
| Tumor clinical stage | 0.8034 | |||
| Other | 52 (1.0%) | 24 (0.9%) | 28 (1.0%) | |
| T1 | 4,333 (79.8%) | 2,180 (80.3%) | 2,153 (79.3%) | |
| T2 | 1,027 (18.9%) | 502 (18.5%) | 525 (19.3%) | |
| T3 | 18 (0.3%) | 9 (0.3%) | 9 (0.3%) | |
| Prostate-specific antigen | 0.2692 | |||
| <10 | 4,455 (82.0%) | 268 (9.9%) | 289 (10.6%) | |
| 10–20 | 557 (10.3%) | 2,250 (82.9%) | 2,205 (81.2%) | |
| >20 | 418 (7.7%) | 197 (7.3%) | 221 (8.1%) | |
| Gleason score | 0.0182 | |||
| 5 | 32 (0.6%) | 13 (0.5%) | 19 (0.7%) | |
| 6 | 3,020 (55.6%) | 1,558 (57.4%) | 1,462 (53.9%) | |
| 7 | 2,087 (38.4%) | 990 (36.5%) | 1,097 (40.4%) | |
| 8 | 214 (3.9%) | 107 (3.9%) | 107 (3.9%) | |
| 9 | 73 (1.3%) | 45 (1.7%) | 28 (1.0%) | |
| 10 | 4 (0.1%) | 2 (0.1%) | 2 (0.1%) | |
| Hormone therapy | 0.4834 | |||
| No | 4,925 (90.7%) | 2,455 (90.4%) | 2,470 (91.0%) | |
| Yes | 505 (9.3%) | 260 (9.6%) | 245 (9.0%) | |
| Dose level | <0.0001 | |||
| Low | 1,076 (19.8%) | 436 (16.1%) | 640 (23.6%) | |
| Intermediate | 3,903 (71.9%) | 2,039 (75.1%) | 1,864 (68.7%) | |
| High | 451 (8.3%) | 240 (8.8%) | 211 (7.8%) |
No significant differences were observed in the distributions for age, race, insurance status, patient residence, median household income, year of diagnosis, clinical tumor stage, PSA, or hormone therapy between the matched treatment groups on the basis of p < 0.05. Significant differences in matched groups existed on the following variables: Charlson–Deyo score (p = 0.0155), facility type (p = 0.0026), Gleason score (p = 0.0182), and dose category (p < 0.0001).
OS for Matched Patients
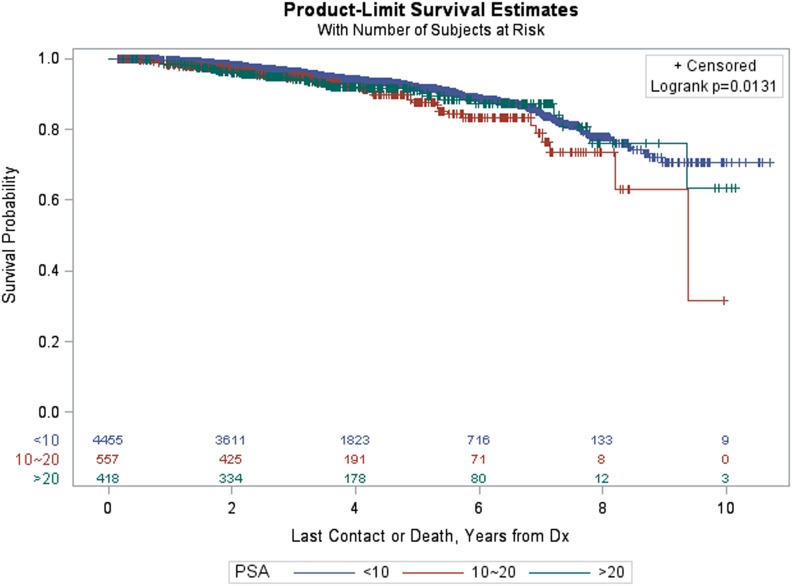
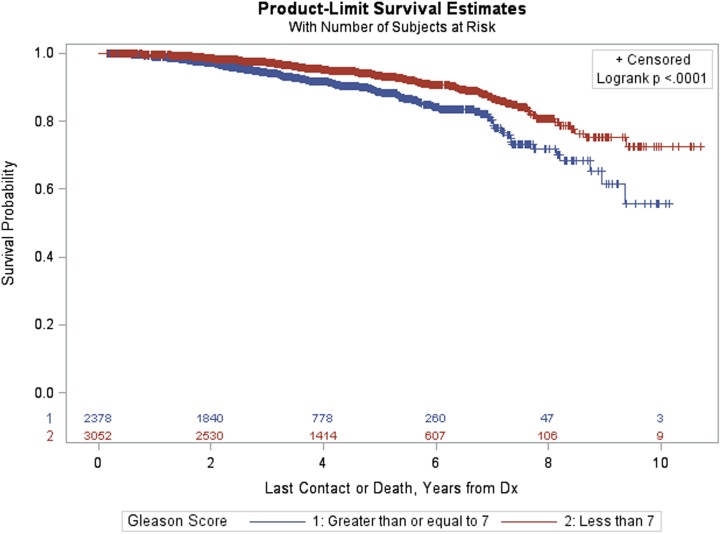
Figure 3 provides Kaplan–Meier OS estimates by treatment group. No statistically significant overall differences are observed (p = 0.6483), and the estimated OS at 8 years for IMRT and SBRT patients was 77.23 and 79.38%, respectively. The estimated OS at 8 years for other patient variables, both within the matched and pre-matched groups, are provided in Table 2. Age (p < 0.0001), insurance status (p = 0.0002), patient residence (p = 0.0145), median household income (p = 0.0059), Charlson–Deyo comorbidity score (p < 0.0001), PSA (p = 0.0131, Figure 4), and GS (p < 0.0001, Figure 5) demonstrated statistically significant differences in OS on univariate analysis (UVA) for the matched group. All other factors on UVA did not demonstrate statistically significant differences.
Figure 3.
Kaplan–Meier estimates by treatment group in propensity score matched sample.
Table 2.
Estimated KM overall survival at 8 years for all variables.
| Variable | Matched sample (N = 5,430) |
Whole sample (N = 33,638) |
||
|---|---|---|---|---|
| % survived at 8 years | Log-rank p-value | % survived at 8 years | Log-rank p-value | |
| Treatment | 0.6483 | 0.0056 | ||
| IMRT | 77.23 | 75.50 | ||
| SBRT | 79.38 | 79.38 | ||
| Age | <0.0001 | <0.0001 | ||
| <55 | 98.60 | 87.42 | ||
| 55–59 | 79.63 | 85.85 | ||
| 60–64 | 93.47 | 84.44 | ||
| 65–69 | 81.85 | 80.26 | ||
| 70–74 | 78.35 | 76.24 | ||
| 75–90 | 59.77 | 63.73 | ||
| Race | 0.2813 | 0.0003 | ||
| Black | 83.99 | 75.96 | ||
| Other | 71.87 | 79.84 | ||
| Unknown | 100.00 | 84.05 | ||
| White | 77.60 | 75.38 | ||
| Insurance status | 0.0002 | <0.0001 | ||
| Insurance status unknown | 78.28 | 77.01 | ||
| Medicaid | 69.54 | |||
| Medicare | 74.41 | 72.21 | ||
| Not insured | 86.60 | 76.88 | ||
| Other government | 89.84 | 77.71 | ||
| Private insurance | 84.80 | 83.35 | ||
| Patient residence | 0.0145 | 0.0599 | ||
| Metropolitan | 79.45 | 76.14 | ||
| Rural | 61.00 | 69.61 | ||
| Urban | 63.89 | 73.41 | ||
| Median household income (US$) | 0.0059 | <0.0001 | ||
| <38,000 | 78.13 | 72.58 | ||
| 38,000–47,999 | 63.15 | 73.25 | ||
| 48,000–62,999 | 81.35 | 75.64 | ||
| 63,000+ | 80.88 | 78.48 | ||
| Charlson–Deyo comorbidity score | <0.0001 | <0.0001 | ||
| 0 | 79.32 | 77.22 | ||
| 1 | 73.73 | 64.39 | ||
| 2 | 33.20 | 53.74 | ||
| Facility type | 0.9955 | <0.0001 | ||
| Academic/research program | 75.94 | 77.74 | ||
| Community cancer program | 67.70 | 72.41 | ||
| Comprehensive community program | 80.36 | 74.75 | ||
| Integrated network cancer program | 75.57 | 77.35 | ||
| Year of diagnosis | 0.0210 | 0.0118 | ||
| 2004–2009 | 78.69 | 75.86 | ||
| 2010–2013 | ||||
| Tumor clinical stage | 0.0826 | <0.0001 | ||
| Other | 90.44 | 76.45 | ||
| T1 | 78.69 | 77.15 | ||
| T2 | 74.57 | 73.28 | ||
| T3 | 80.82 | 65.30 | ||
| Prostate-specific antigen | 0.0131 | <0.0001 | ||
| <10 | 78.65 | 77.69 | ||
| 10–20 | 72.72 | 69.27 | ||
| >20 | 77.61 | 70.62 | ||
| Gleason score | <0.0001 | <0.0001 | ||
| <7 | 81.35 | 80.65 | ||
| ≥7 | 71.96 | 70.85 | ||
| Hormone therapy | 0.0020 | <0.0001 | ||
| No | 78.49 | 78.19 | ||
| Yes | 73.05 | 70.97 | ||
| Dose level | 0.5403 | 0.1488 | ||
| Low | 76.93 | 75.77 | ||
| Intermediate | 77.86 | 75.15 | ||
| High | 86.18 | 77.22 | ||
Figure 4.
Kaplan–Meier estimates by prostate-specific antigen in propensity score matched sample.
Figure 5.
Kaplan–Meier estimates by Gleason score in propensity score matched sample.
OS by Subpopulation
In order to further characterize the effect of treatment modality among higher risk prostate cancer patients, three additional PSM analyses (1–1 nearest neighbor matching without replacement) were carried out within patients having a pretreatment PSA > 10 or GS > 7 or GS = 7.
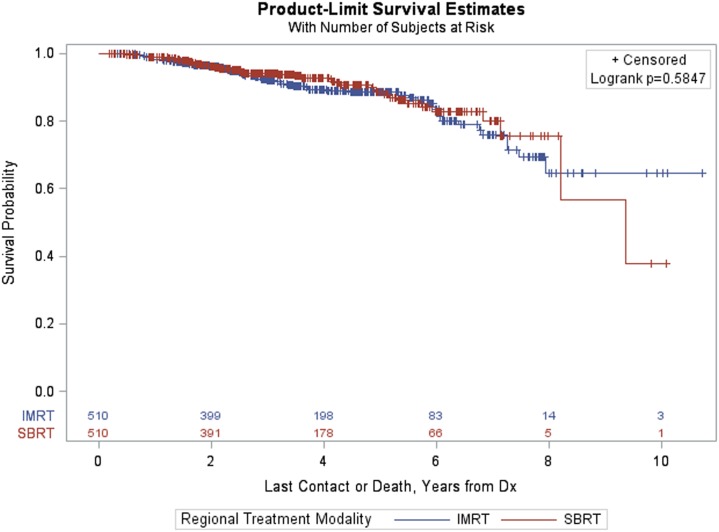
The PSM analysis of patients with PSA > 10 resulted in a matched sample of 1,020 (510 in each group). The groups were well matched on the basis of ASMD values below 0.20, and thus differences between treatment groups (IMRT vs SBRT) could be carried out using a Kaplan–Meier curve and a log-rank test (Figure 6). The p-value corresponding to the log-rank test was again above 0.05 (p = 0.5847), indicating that there were no statistically significant differences between treatment groups after matching.
Figure 6.
Kaplan–Meier estimates by treatment group in propensity score matched sample of prostate-specific antigen > 10 patients.
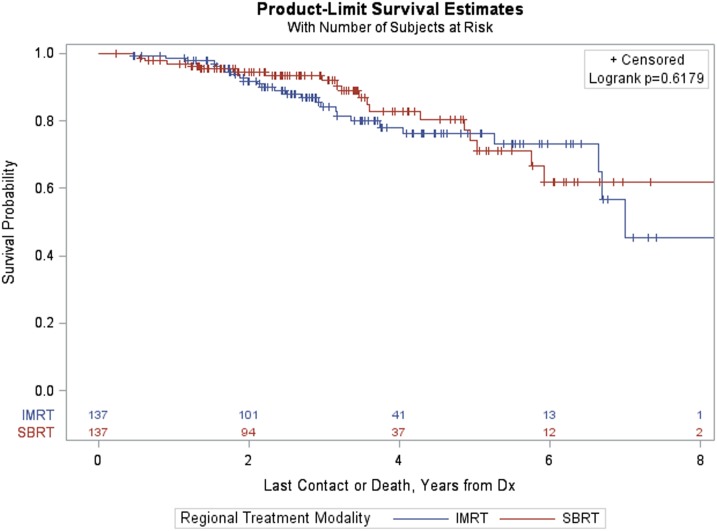
Among patients with GS > 7, PSM resulted in a matched sample of 274 (137 in each group). Again, the groups were well matched and differences between treatment groups (IMRT vs SBRT) resulted in a non-significant log-rank p-value (p = 0.6179, Figure 7).
Figure 7.
Kaplan–Meier estimates by treatment group in propensity score matched sample of GS > 7 patients.
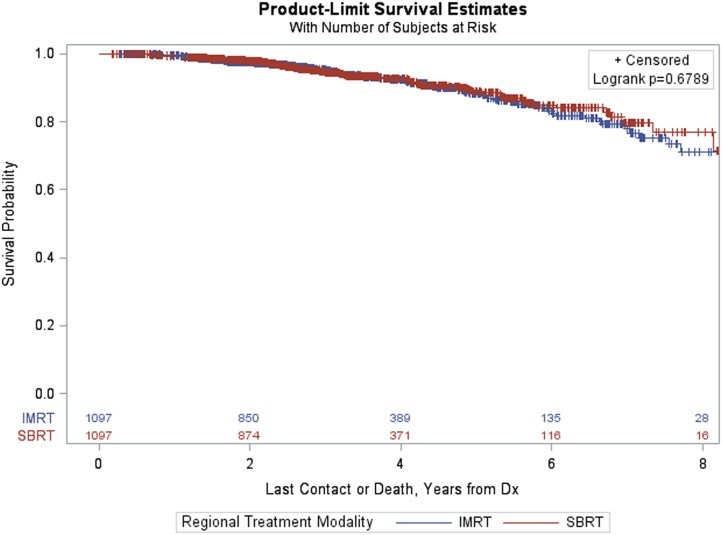
Finally, the PSM analysis of patients with GS = 7 resulted in a matched sample of 2,194 (1,097 in each group). The groups were well matched and differences between treatment groups (IMRT vs SBRT) resulted in a non-significant log-rank p-value (p = 0.6789, Figure 8).
Figure 8.
Kaplan–Meier estimates by treatment group in propensity score matched sample of GS = 7 patients.
Discussion
No significant difference in survival between SBRT and IMRT for localized prostate cancer was found utilizing the NCDB with PSM matching at 8 years. In addition, we found no significant difference in OS between the two treatment modalities in matching high-risk subpopulations of GS = 7 or GS > 7 or PSA > 10. As expected, differences in OS by patient and clinical characteristics were observed among men with older age, higher comorbidity score, higher GS, and higher PSA.
Patient demographics and treatment characteristics in both treatment groups showed some statistically significant differences that were not controlled by PSM. These differences include two variables that significantly impacted survival in this study: Charlson–Deyo comorbidity score and GS. When comparing comorbidity scores, although not necessarily clinically significant, there are an increased proportion of “healthy” patients (comorbidity score = 0) in the IMRT group vs the SBRT group (89.0 vs 87.2%, respectively). In addition, the SBRT group has a higher proportion of patients with comorbidity score = 1 (11.3 vs 9.1%, respectively). These results could potentially add bias against the SBRT treatment group, which appears to have worse comorbidity scores. The differences seen in GS distribution could also potentially bias against SBRT, with a greater proportion of GS = 7 (40.4 vs 36.5%) and a lower proportion of GS = 6 (53.9% vs 57.4%).
The strength of the current study is the large number of patients allowing for 8-year survival estimates by known risk factors for prostate cancer as well as other demographic and treatment factors not normally evaluated in single institutional or randomized trials. This database is homogeneous with regard to treatment technique with only men treated to the prostate with IMRT or SBRT analyzed. The database is homogeneous with regard to dose with stratification by low-, intermediate-, and high- dose groups for matching. Patients with no follow- up or outliers with regard to dose were excluded.
A weakness of this study is that survival is the only outcome available—specifically, there is no biochemical or toxicity information. With the 2017 NCCN risk stratification, however, survival is the most important outcome parameter with treatment recommended only if at least 10-year survival is expected based on medical status. The NCDB potentially includes selection bias since only accredited hospitals input data which could represent patients receiving higher quality care. As such this analysis may not be a true population-based study which limit’s the study generalizability (8, 9).
Intensity modulated radiation therapy continues to be a standard radiotherapeutic technique for the definitive treatment of localized prostate cancer using a conventionally fractionated approach with 1.8–2.0 Gy fractions 5 days per week over 8–9 weeks. A decade of data supports this fractionation scheme for localized prostate cancer, with excellent biochemical control, OS, and acceptable toxicity. Dose-escalation trials revealed improved biochemical freedom from relapse (BFFR) in certain trials but no difference in survival as updated in a 2015 systematic review (1, 10–14).
Moderate hypofractionated radiotherapy for prostate cancer has been studied in six phase III randomized trials with varied number of fractions (19–30) and doses (52.5–72 Gy). Two of the trials were carried out before dose-escalation was known and therefore delivered insufficient dose (15, 16). Three of the trials showed no significant difference reported in BFFR, OS, or toxicity compared with conventional fractionation for prostate cancer with median follow-up from 51 to 90 months (17–19). The recent 5-year data published from the non-inferiority HYPRO trial of intermediate- and high-risk patients concluded that dose-escalated moderate hypofractionation was not superior with comparable relapse-free survival but higher toxicity profiles compared with standard fractionation (20, 21).
Single institutions, pooled institutions, and registries have shown similar efficacy and toxicity of SBRT compared with IMRT in low and select intermediate-risk prostate cancer (22–25). The study with longest follow-up was published in abstract form for mostly low- and intermediate-risk prostate cancer patients with 9-year FFBF of 95% low-risk, 89% intermediate-risk, and 66% high-risk groups. Extreme hypofractionation was tolerated well with 1.9% RTOG grade 3 urinary toxicity but no grade 3 GI toxicity (4).
Several trials will address the remaining questions regarding biochemical, toxicity, and survival outcomes for extreme hypofractionation. RTOG 0938, an equivalency study of low-risk prostate cancer, randomized extreme hypofractionation 36.25 Gy in 5 fractions to moderate hypofractionation of 51.6 Gy in 12 fractions. The study was closed February 2014 with 255 patients accrued with quality of life at 1 year the primary outcome. It was recently published that both the 5 fraction and 12 fraction regimens were well tolerated (26). A recent dose-escalation trial for prostate cancer treated with SBRT has also shown acceptable toxicities up to 47.5 Gy over 2.5 weeks (27). Three randomized trials await completion comparing conventional fractionation or moderate hypofractionation to extreme hypofractionation (28–30).
The Technology Assessment produced by the Agency for Healthcare Research and Quality, “Comparative Evaluation of radiation treatments for clinically localized prostate cancer: an update,” analyzed 60 high-quality studies including 9 RCTs, and determined that there is insufficient evidence to support either SBRT vs IMRT, noting that there was no high-quality study comparing SBRT to any other radiation modality. The Institute of Medicine has also included prostate cancer comparative effectiveness research in the “top quartile” group for priority (31). This NCDB PSM analysis for clinically localized prostate cancer compares these two radiation treatment modalities with a large sample size and provides evidence to suggest no difference in OS through 8 years.
Conclusion
In a PSM analysis of the NCDB, no difference in OS was observed when comparing IMRT to SBRT in the treatment of localized prostate cancer. Subset analyses of intermediate- and high-risk patients (Gleason score = 7 or >7 or PSA > 10) confirmed no observed difference in OS by treatment within these populations. We await randomized data to confirm these survival findings.
Ethics Statement
Ethics statements were placed in the body of Section “Materials and Methods” in the manuscript.
Author Contributions
All authors contributed to the conception and design, analysis, interpretation of data, drafting of the abstract, and its revision for important intellectual comment.
Conflict of Interest Statement
RL is a partial stockholder of Philadelphia Cyberknife. All authors have read and approved the manuscript. We have no financial disclosures. We are not using any copyrighted information, patient photographs, identifiers, or other protected health information in this paper. No text, text boxes, figures, or tables in this article have been previously published or owned by another party.
Footnotes
Funding. We kindly thank the Radiosurgical Research Institute for providing us the necessary funding through a Research Grant for statistical support.
References
- 1.Alicikus ZA, Yamada Y, Zhang Z, Pei X, Hunt M, Kollmeier M, et al. Ten-year outcomes of high-dose, intensity-modulated radiotherapy for localized prostate cancer. Cancer (2011) 117:1429–37. 10.1002/cncr.25467 [DOI] [PubMed] [Google Scholar]
- 2.King CR, Collins S, Fuller D, Wang PC, Kupelian P, Steinberg M, et al. Health-related quality of life after stereotactic body radiation therapy for localized prostate cancer: results from a multi-institutional consortium of prospective trials. Int J Radiat Oncol Biol Phys (2013) 87:939–45. 10.1016/j.ijrobp.2013.08.019 [DOI] [PubMed] [Google Scholar]
- 3.Katz AJ, Kang J. Stereotactic body radiotherapy as treatment for organ confined low and intermediate risk prostate carcinoma, an eight year study. Radiat Oncol (2014) 4:1–6. 10.1186/1748-717X-9-1 [DOI] [PMC free article] [PubMed] [Google Scholar]
- 4.Katz AJ, Kang J. Stereotactic body radiation therapy for low-, intermediate- and high-risk prostate cancer: disease control and quality of life at 9 years. J Clin Oncol (2016) 34(Suppl 2S):20. 10.1200/jco.2016.34.2_suppl.2026578619 [DOI] [Google Scholar]
- 5.King CR, Freeman D, Kaplan I, Fuller D, Bolzicco G, Collins S, et al. Stereotactic body radiotherapy for localized prostate cancer: pooled analysis from a multi-institutional consortium of prospective phase II trials. Radiother Oncol (2013) 109:217–21. 10.1016/j.radonc.2013.08.030 [DOI] [PubMed] [Google Scholar]
- 6.Rtog. Radiation Therapy Oncology Group (RTOG) Protocol #0938: A Randomized Phase II Trial of Hypofractionated Radiotherapy for Favorable Risk Prostate Cancer-RTOG CCOP Study, Closed. (2014).
- 7.Deyo RA, Cherkin DC, Ciol MA. Adapting a clinical comorbidity index for use with ICD-9-CM administrative databases. J Clin Epidemiol (1992) 45:613–9. 10.1016/0895-4356(92)90133-8 [DOI] [PubMed] [Google Scholar]
- 8.Jagsi R, Bekelman JE, Chen A, Chen RC, Hoffman K, Tina Shih YC, et al. Considerations for observational research using large data sets in radiation oncology. Int J Radiat Oncol Biol Phys (2014) 90:11–24. 10.1016/j.ijrobp.2014.05.013 [DOI] [PMC free article] [PubMed] [Google Scholar]
- 9.Bilimoria KY, Bentrem DJ, Stewart AK, Winchester DP, Ko CY. Comparison of commission on cancer-approved and -nonapproved hospitals in the United States: implications for studies that use the national cancer data base. J Clin Oncol (2009) 27:4177–81. 10.1200/JCO.2008.21.7018 [DOI] [PubMed] [Google Scholar]
- 10.Al-Mamgani A, van Putten WL, Heemsbergen WD, van Leenders GJ, Slot A, Dielwart MF, et al. Update of Dutch multicenter dose-escalation trial of radiotherapy for localized prostate cancer. Int J Radiat Oncol Biol Phys (2008) 72:980–8. 10.1016/j.ijrobp.2008.02.073 [DOI] [PubMed] [Google Scholar]
- 11.Zietman AL, Bae K, Slater JD, Shipley WU, Efstathiou JA, Coen JJ, et al. Randomized trial comparing conventional-dose with high-dose conformal radiation therapy in early-stage adenocarcinoma of the prostate: long-term results from proton radiation oncology group/American College of Radiology 95–09. J Clin Oncol (2010) 28:1106–11. 10.1200/JCO.2009.25.8475 [DOI] [PMC free article] [PubMed] [Google Scholar]
- 12.Martinez AA, Gonzalez J, Ye H, Ghilezan M, Shetty S, Kernen K, et al. Dose escalation improves cancer-related events at 10 years for intermediate- and high-risk prostate cancer patients treated with hypofractionated high-dose-rate boost and external beam radiotherapy. Int J Radiat Oncol Biol Phys (2011) 79:363–70. 10.1016/j.ijrobp.2009.10.035 [DOI] [PubMed] [Google Scholar]
- 13.Kuban DA, Tucker SL, Dong L, Starkschall G, Huang EH, Cheung MR, et al. Long-term results of the M. D. Anderson randomized dose-escalation trial for prostate cancer. Int J Radiat Oncol Biol Phys (2008) 70:67–74. 10.1016/j.ijrobp.2007.06.054 [DOI] [PubMed] [Google Scholar]
- 14.Wolff RF, Ryder S, Bossi A, Briganti A, Crook J, Henry A, et al. A systematic review of randomised controlled trials of radiotherapy for localised prostate cancer. J Cancer (2015). 51:2345–67. 10.1016/j.ejca.2015.07.019 [DOI] [PubMed] [Google Scholar]
- 15.Lukka H, Hayter C, Warde P, Morris J, Julian J, Gospodarowicz M, et al. A randomized trial comparing two fractionation schedules for patients with localized prostate cancer. Int J Radiat Oncol Biol Phys (2003) 57:S126. 10.1016/S0360-3016(03)00827-7 [DOI] [PubMed] [Google Scholar]
- 16.Yeoh EE, Botten RJ, Butters J, Di Matteo AC, Holloway RH, Fowler J. Hypofractionated versus conventionally fractionated radiotherapy for prostate carcinoma: final results of phase III randomized trial. Int J Radiat Oncol Biol Phys (2011) 81:1271–8. 10.1016/j.ijrobp.2010.07.1984 [DOI] [PubMed] [Google Scholar]
- 17.Pollack A, Walker G, Horwitz EM, Price R, Feigenberg S, Konski AA, et al. Randomized trial of hypofractionated external-beam radiotherapy for prostate cancer. J Clin Oncol (2013) 31:3860–8. 10.1200/JCO.2013.51.1972 [DOI] [PMC free article] [PubMed] [Google Scholar]
- 18.Arcangeli S, Strigari L, Gomellini S, Saracino B, Petrongari MG, Pinnarò P, et al. Updated results and patterns of failure in a randomized hypofractionation trial for high-risk prostate cancer. Int J Radiat Oncol Biol Phys (2012) 84:1172–8. 10.1016/j.ijrobp.2012.02.049 [DOI] [PubMed] [Google Scholar]
- 19.Dearnaley D, Syndikus I, Mossop H, Birtle A, Bloomfield D, Cruickshank J, et al. 8LBA 5 year outcomes of a phase III randomised trial of conventional or hypofractionated high dose intensity modulated radiotherapy for prostate cancer (CRUK/06/016): report from the CHHiP trial investigators group. Eur J Cancer (2015) 51:S712. 10.1016/S0959-8049(16)31932-3 [DOI] [Google Scholar]
- 20.Incrocci L, Wortel RC, Alemayehu WG, Aluwini S, Schimmel E, Krol S, et al. Hypofractionated versus conventionally fractionated radiotherapy for patients with localised prostate cancer (HYPRO): final efficacy results from a randomised, multicentre, open-label, phase 3 trial. Lancet (2016) 17(8):1061–9. 10.1016/S1470-2045(16)30070-5 [DOI] [PubMed] [Google Scholar]
- 21.Aluwini S, Pos F, Shimmel E, Krol K, van der Toorn P, de Jager H, et al. Hypofractionated versus conventionally fractionated radiotherapy for patients with prostate cancer (HYPRO): late toxicity results from a randomised, non-inferiority, phase 3 trial. Lancet Oncol (2016) 17(4):464–74. 10.1016/S1470-2045(15)00567-7 [DOI] [PubMed] [Google Scholar]
- 22.Katz AJ, Kang J. Quality of life and toxicity after SBRT for organ-confined prostate cancer, a 7-year study. Front Oncol (2014) 4:301. 10.3389/fonc.2014.00301 [DOI] [PMC free article] [PubMed] [Google Scholar]
- 23.Freeman D, Dickerson G, Perman M. Multi-institutional registry for prostate cancer radiosurgery: a prospective observational clinical trial. Front Oncol (2015) 4:369. 10.3389/fonc.2014.00369 [DOI] [PMC free article] [PubMed] [Google Scholar]
- 24.King CR, Brooks JD, Gill H, Presti JC. Long-term outcomes from a prospective trial of stereotactic body radiotherapy for low-risk prostate cancer. Int J Radiat Oncol Biol Phys (2012) 82:877–82. 10.1016/j.ijrobp.2010.11.054 [DOI] [PubMed] [Google Scholar]
- 25.Davis JN, Medbery C, Sharma S, Danish A, Mahadevan A. The RSSearchTM registry: patterns of care and outcomes research on patients treated with stereotactic radiosurgery and stereotactic body radiotherapy. Radiat Oncol (2013) 8:275. 10.1186/1748-717X-8-275 [DOI] [PMC free article] [PubMed] [Google Scholar]
- 26.Lukka H, Stephanie P, Bruner D, Bahary JP, Lawton CAF, Efstathiou JA, et al. Patient-reported outcomes in NRG oncology/RTOG 0938, a randomized phase 2 study evaluating 2 ultrahypofractionated regimens (UHRs) for prostate cancer. Int J Radiat Oncol Biol Phys (2016) 94:2. 10.1016/j.ijrobp.2015.10.046 [DOI] [Google Scholar]
- 27.Kim DWN, Straka C, Cho LC, Timmerman RD. Stereotactic body radiation therapy for prostate cancer: review of experience of a multicenter phase I/II dose-escalation study. Front Oncol (2014) 4:319. 10.3389/fonc.2014.00319 [DOI] [PMC free article] [PubMed] [Google Scholar]
- 28.University of Miami. Radiation Hypofractionation Via Extended Versus Accelerated Therapy (HEAT) For Prostate Cancer (HEAT). NLM Identifier: NCT01794403. (2017). Available from: https://clinicaltrials.gov/ct2/show/NCT01794403
- 29.Royal Marsden NHS Foundation Trust. Prostate Advances in Comparative Evidence (PACE). NLM Identifier: NCT01584258. (2017). Available from: https://clinicaltrials.gov/ct2/show/NCT01584258
- 30.Widmark A. Phase III Study of HYPOfractionated RadioTherapy of Intermediate Risk Localised Prostate Cancer. (2009). 10.1186/ISRCTN45905321 [DOI] [Google Scholar]
- 31.Cassel C, Dickersin K, Garber A, Gatsonis C, Gottlieb G, Guest J, et al. Initial National Priorities for Comparative Effectiveness Research. (2009). Available from: http://nationalacademies.org/hmd/reports/2009/comparativeeffectivenessresearchpriorities.aspx


