Abstract
HIV testing is the foundation for consolidated HIV treatment and prevention. In this study, we aim to discover the most relevant variables for predicting HIV testing uptake among substance users in substance use disorder treatment programs by applying random forest (RF), a robust multivariate statistical learning method. We also provide a descriptive introduction to this method for those who are unfamiliar with it. We used data from the National Institute on Drug Abuse Clinical Trials Network HIV testing and counseling study (CTN-0032). A total of 1281 HIV-negative or status unknown participants from 12 US community-based substance use disorder treatment programs were included and were randomized into three HIV testing and counseling treatment groups. The a priori primary outcome was self-reported receipt of HIV test results. Classification accuracy of RF was compared to logistic regression, a standard statistical approach for binary outcomes. Variable importance measures for the RF model were used to select the most relevant variables. RF based models produced much higher classification accuracy than those based on logistic regression. Treatment group is the most important predictor among all covariates, with a variable importance index of 12.9%. RF variable importance revealed that several types of condomless sex behaviors, condom use self-efficacy and attitudes towards condom use, and level of depression are the most important predictors of receipt of HIV testing results. There is a nonlinear negative relationship between count of condomless sex acts and the receipt of HIV testing. In conclusion, RF seems promising in discovering important factors related to HIV testing uptake among large numbers of predictors and should be encouraged in future HIV prevention and treatment research and intervention program evaluations.
Keywords: Multivariate analysis, Supervised learning, Random forest, HIV testing, Substance use, Sexual risk behaviors
Introduction
HIV infection in the United States remains a public health challenge; it is estimated that more than 1.2 million people were living with HIV infection, including 156,300 (12.8%) undiagnosed. and about 50,000 people were newly infected with HIV in the United States in 2012 [1, 2]. Persons who are unaware of their infection are estimated to account for nearly half of all sexual transmissions in the US, and lack of testing is considered one of the main reasons that HIV incidence in the US has remained at 50,000 annually over the last decade [3, 4]. In 2006, the Centers for Disease Control and Prevention (CDC) recommended that health care providers, including substance use disorder treatment programs, provide universal HIV screening for all patients ages 13–64 years and repeated annual or more frequent screening of high-risk patients [5]. More recently, CDC and World Health Organization (WHO) have called for expanding HIV testing in settings where high-risk persons receive health services, including substance abuse treatment programs [6]. Previous studies have shown elevated HIV prevalence in substance use treatment programs compared to the general population [7, 8]. People with substance use disorders or who misuse substances, including injection drug users, people who have sex while intoxicated or after drinking alcohol, and people who trade sex for drugs, are at high risk for HIV infection [9–11]. Yet, data indicate that less than 30% of substance use disorder treatment programs provide onsite HIV testing [12, 13], despite the importance of HIV testing, as the first step of the HIV care continuum.
Between January and May 2009, the National Drug Abuse Treatment Clinical Trials Network (CTN) conducted the HIV Rapid Testing and Counseling Study (CTN 0032) with the aims to examine the efficacy of rapid HIV testing and risk-reduction counseling in increasing the receipt of results and reducing HIV risk behaviors among substance use disorder treatment programs patients [14]. The study found that the on-site rapid testing participants received more HIV test results than off-site testing referral participants, while no additional benefit was identified from brief HIV risk reduction counseling at the time of on-site testing. However, the question remains as to what other factors affect HIV testing and receipt of results and whether these factors might have affected the intervention. We introduce and utilize a non-parametric machine learning method, random forest (RF), which may be unfamiliar to some in HIV behavioral research, to predict receipt of HIV testing results in a secondary data analysis of the CTN 0032 study. We evaluated (1) RF performance relative to logistic regression (LR), a more conventional statistical approach and (2) using RF to identify which factors best predict the receipt of HIV testing results among patients from substance use treatment programs and (3) whether there were subgroups with differential treatment response through examination of interactions with treatment.
Methods
Parent Study
The parent study, CTN-00032, has been reported previously [14]. In CTN-0032, before being offered HIV testing, participants were stratified by site, gender, and ethnicity and randomized to one of three conditions: (1) on-site rapid HIV testing with 30 min risk-reduction counseling based on the intervention from the RESPECT-2 study [15], (2) on-site rapid HIV testing with information about HIV only, and (3) referral for off-site HIV testing as a control. All eligible participants were receiving or seeking substance use disorder treatment services at the participating sites. Participant inclusion criteria were (1) ≥18 years old, (2) reported negative or unknown HIV status, (3) had not been tested and received results for HIV testing within the last 12 months, and (4) be able and willing to provide informed consent. All study procedures were reviewed, approved and overseen by multiple institutional review boards. In the parent study there were two co-primary outcomes, receipt of an HIV test result and the number of unprotected sex episodes. In the current study we examine the receipt of HIV test results.
Main Outcome and Measures
HIV Testing
Audio computer-assisted self-interviews (ACASIs) were used at baseline and 6-month follow up to obtain participants’ socio-demographics and risk behaviors. The a priori defined primary outcome was self-reported receipt of HIV test result, which was binary (yes or no) at the 6-month assessment visit.
Treatment group
Treatment group was included as a predictor of receiving their HIV test result (referral for off-site HIV testing, onsite rapid HIV testing with 30 min risk-reduction counseling, and on-site rapid HIV testing with information only).
Socio-Demographic
Socio-demographic factors included gender, race/ethnicity (non-Hispanic Whites, non-Hispanic African Americans, Hispanics and Others), age (in years), education (less than high school, high school, college or more), marital status (married, unmarried but living with partner, widowed, divorced/separated, single), income (<$10,001, $10,001–$40,000, >$40,000), incarceration history (never, jailed before but not in last 6 months, jailed in last 6 months), and housing status (stable housed, unstable housed, homeless, others).
Substance Use
Substance use behaviors included injection drug use (IDU) (never IDU, used IDU but not in the last 6 months, and IDU in the last 6 months), substantial level of drug use severity [Drug Abuse Screening Test-10 (DAST10) score ≥6] [16, 17], and frequency of individual drugs used. Particular types of drug use were assessed by asking participants the number of times they have used or injected any of the following substances in the past 6 months: club drugs (GHB, ketamine, and ecstasy), cocaine (powder, crack and IDU), amphetamines, opioids, stimulants opioids, marijuana, tranquilizers/barbiturates and other drugs. All drug use questions were recoded to dichotomized variables indicating (1) ever used or not; (2) weekly use or less; and (3) IDU of any drug or not. In addition, frequency and amount of alcohol use in the last sixth months were also reported and categorized into problematic drinking and binge drinking. The measures used in the current study are consistent with standards utilized by the National Institute on Alcohol Abuse and Alcoholism (NIAAA) [18]. Problematic drinking was defined as greater than 14 standard drinks for men and greater than 7 standard drinks for women per week. Binge drinking was defined as when men consume five or more drinks, and when women consume four or more drinks, in about 2 h, more than once every 2 weeks.
Sexual Behavior
For sexual risk behaviors, we adapted questions used in prior studies that correlate with HIV seroconversion and were well-accepted by participants [19]. Particularly, before accessing detailed sexual behaviors, sexual activity was asked first as “in the past 6 months, have you had anal or vaginal sex with males only, females only, both males and females, or no anal or vaginal sex in past 6 months.” For participants who were sexually active, questions about risky sex behaviors included number of partners with whom they engaged in condomless sex acts and the count of condomless sex acts. Additionally, whether the sexual partner was a primary partner or non-primary partner, sites of penetration, whether protection was used, substance use before engaging in sexual intercourse and partners’ HIV status were assessed. We defined condomless sex acts as vaginal or anal sexual intercourse without condom use from start to finish. For participants that were not sexually active in the prior 6 months, the detailed questions about sexual activities were coded as zero because these activities did not occur. We included both count and dichotomized variables for each different type of sex risk behavior.
Condom Use Self-Efficacy
Condom use self-efficacy was assessed by the 15-item condom use self-efficacy scale (CUSES) [20, 21] to measure self-efficacy for the mechanics of putting a condom on oneself or the partner, use of a condom with a partner’s approval, ability to persuade a partner to use a condom, and ability to use condoms while under the influence, using 5-point Likert scales where higher scores indicate stronger perception of condom use efficacy (1 = strongly disagree, 2 = disagree, 3 = undecided, 4 = agree, 5 = strongly agree). This scale assesses an individuals’ perception of their own ability to use condoms, with a higher score indicating greater self-efficacy (Cronbach’s alpha = 0.78–0.82). Condom use self-efficacy was asked of all individuals, regardless of the reported level of sexual activity.
Attitudes Towards Condom Use
Attitudes towards condom use was assessed by a 13-item attitudes subscale of the Sexual Risks Scale [22] to screen participants’ attitudes toward whether condom use is a hassle or is problematic (Cronbach’s alpha = 0.88). Responses are on a 5-point Likert scale, where 1 = strongly disagree, 2 = disagree, 3 = undecided, 4 = agree, 5 = strongly agree.
Depression
Depression was measured with the 16-item self-reported Quick Inventory of Depressive Symptomatology (QIDS-SR-16) scale, yielding scores from 0 to 27 [23]. The QIDS-SR-16 covers the symptom domains of major depressive disorder, for the time frame of the past week: mood; concentration; suicidal ideation; anhedonia; loss of energy; insomnia; appetite change; psychomotor agitation/retardation; as well as self-esteem and has good internal consistency and predictive validity and is sensitive to symptom changes (Cronbach’s alpha = 0.86).
Analysis
The data were formatted for analyses using the randomForestSRC package version 1.6.1 [24–26] in R version 3.13. RF is a type of ensemble learning method in which a large number of decision tree models are built and their results are aggregated. A decision tree can be constructed by considering every value of every variable (or feature) and then checking across all values for the single cut-point which will split the sample into two groups that are the most homogenous and in a regression context will explain the most variability in the outcome. The first time this is done, two branches of the tree are created (representing each of the two groups found). Cases with feature values greater than the cut-point go down the right branch of the tree and those less than or equal go down the left branch. This procedure is repeated, creating additional branches at each step (note that all features are considered at each step so that previously evaluated features may enter the tree at multiple places). Prediction is then the average of the outcome in the final (or terminal) node that an individual ends up (for continuous outcomes) or predicted probabilities in the terminal node (for categorical outcomes). This procedure involves extensive multiple testing of each variable, so it frequently leads to over fitting the data and poor prediction performance.
Breiman [24] first introduced RF as an improvement from a single tree model. RF-classification uses the strategy of bootstrap to draw a sample from the data. In any bootstrapped sample with replacement, approximately 40% of the original data will not be drawn into the bootstrapped sample. Data selected into the bootstrap sample are noted as in-bag data, while the non-selected data are noted as out-of-bag (OOB) data. A classification tree is then built using the in-bag data. RF also randomly chooses a subset of the available predictors to examine (called x-variables in standard statistics and features in machine learning) each time it evaluates which variable to add to the next level of the tree. This procedure is called random feature selection. These procedures are repeated a number of times to grow a collection of the classification trees, i.e. a RF. The final prediction is created by averaging the predictions from all of the trees in the forest. The prediction is the average y in the last (or terminal) nodes across the trees in the forest or average predicted probabilities. Random feature selection reduces the correlation between trees and averaging across the trees in the forest reduces the variance of the prediction. These two strategies are essential in RF to stabilize its prediction performance compared to a classification tree [27]. Prediction can be based on in-bag or OOB data. The assessment of how well the forest predicts is normally based on the OOB subsample (i.e., an individual’s prediction and associated error of prediction is only calculated across the trees for which that individual was OOB), providing a true cross-validation so that the estimated RF should predict just as well on new data from similar individuals.
The randomForestSRC package [26] is a unified treatment of Breiman’s RF for survival, regression and classification problems. RF is a powerful machine learning method for classification and regression, and has several advantages compared to traditional statistical methods, including being highly adaptive at interactions, robust to outliers and noise, invariant to monotonic transformations, applicable to mixes of continuous and categorical variables, and free of model assumptions. In addition, it examines nonlinear effects and higher order interaction effects without specifying these effects a priori. RF’s facility with interactions should allow it to uncover any simple subgroups with significantly different response to treatment. These would be indicated by an interaction with treatment assignment.
Machine learning approaches have been characterized as “black-box” methods for prediction. Indeed, the complexity of the forest with many hundreds of trees makes it difficult to examine by visual inspection. However, methods have been developed to allow for determining which variables are most important (variable selection) and for understanding how particular variables affect prediction. RF provides a rapidly computable internal measure of variable importance (VIMP) that can be used for ranking variables and for variable selection, which is especially useful for high-dimensional as well as low-dimensional data. VIMP refers to the extent of increase in prediction error when that variable is permuted. In order to calculate a variable’s importance, the given variable is randomly permuted in the OOB data, and the permuted OOB data are dropped down the trees in the forest (i.e., all the decision-rules of the forest are applied to the OOB data to get a new OOB prediction error). This new OOB prediction error is then compared to previous OOB prediction error from the un-permuted OOB data. This difference is the VIMP of the variable. The larger the VIMP of a variable, the more predictive the variable. It therefore indicates a more important variable compared to others [24]. Furthermore, partial dependency plots [28] can be produced to graphically show how a predictor relates to the probability of receipt of HIV testing result after adjusting for all other factors.
We also examined the interactions through RF. Joint VIMP [29], extended from VIMP, is used for this purpose. To calculate the joint VIMP, two candidate predictors are simultaneously and independently permuted rather than a single predictor in VIMP. The joint VIMP then equals to the difference between the OOB prediction errors from permuted OOB data and from un-permuted OOB data. A large absolute value of difference between the joint VIMP and the additive VIMP (sum of individual VIMP for these two candidate predictors) indicates a potentially significant interaction. An intuitive explanation is that if the two variables were independent, the joint VIMP would be equal to the additive VIMP; while substantial difference suggests a potential interaction. Due to the numerous properties listed above, the RF approach has become widely used for classification and prediction of individual response in medical research such as genetics [30] and cancer [31, 32].
All study procedures were carried out on an intent-to-treat basis with all randomized patients. A total of 119 covariates were included in the model including treatment arms, sociodemographic factors, substance use and sexual risk behaviors, condom use self-efficacy, attitudes towards condom use, and depression factors. The data had two characteristics: collinearity and high dimensionality (many potential predictors). It is well known that collinearity causes poor estimation or even non-convergence in LR. Given the amount of predictors in the data, potential interactions between predictors were not easily detected using LR, we felt that RF was better suited for this data analysis.
The analysis was done in two steps. In the first step, to further illustrate why we prefer the RF approach, we evaluated the performance of RF and LR to discriminate observations with and without receipt of an HIV test result. We selected LR because it is a conventional statistical method that models conditional probabilities. The merits of using RF were noted above. To conduct the comparison of RF and LR, assumptions of missing data and multicollinearity were checked. Pairwise correlations for the covariates were calculated.
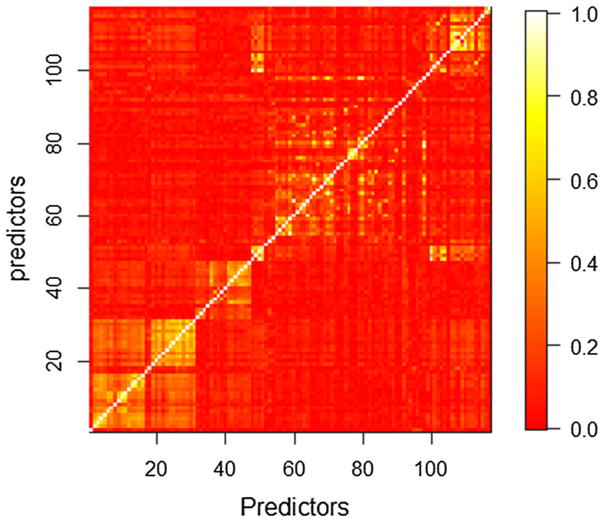
Pairwise correlations for the covariates were examined and summarized in Fig. 1, from which it can be seen that some predictors were highly correlated. The condition number, which reflected the degree of collinearity in the design matrix, equaled 8.34 × 10⁹. To make LR converge and estimate normally, four covariates including “count of condomless sex”, “count of condomless anal sex”, “ever injection use in the last 6 months” and “ever injection use before” were removed due to high collinearity in the design matrix. After the removal of these four covariates, the condition number decreased from 8.34 × 10⁹ to 3794.52. The modified data had missing data on 370 of 1281 participants (28.9%; only five of the predictor variables had more than 2% missing data). We excluded those participants because we did not want to confound the comparison with the impact of missing data imputation methods. The remaining data contained 911 participants with 113 covariates. In the first stage comparison we used exactly the same filtered data for both RF and LR throughout the comparison.
Fig. 1.
Heat map of the absolute correlation matrix for design matrix, each pixel indicates the amount of correlation between two predictors defined by its coordinates in the matrix. The bar plot on the right side indicates the absolute value of correlation for each specific color
In the second step, we analyzed the full data set using RF to address our question on predictors of receipt of HIV test results. Since RF is nonparametric and any multicollinearity in the design matrix will not affect its prediction accuracy, all covariates were included in the model. Missing data for observations were imputed using a nonparametric imputation method built in RF [33], assuming that data were missing at random, a convenient and necessary assumption for imputation. We used the default settings for parameters in the algorithm: a nonrandom split rule was used, node size was set to 1, and number of variables randomly selected as candidates at each node split was 15 [26]. Number of trees used to build the algorithm was set to 500, rather than 1000 in the default setting, for computation efficiency. OOB prediction error was reported. VIMP, joint VIMP and partial dependency plots were examined to understand which predictors are important and their relationship to the outcome. Because of space limitations, partial dependence plots were produced only for the eight most important predictors in the present paper.
Results
Classification Accuracy Between Logistic regression and Random Forest
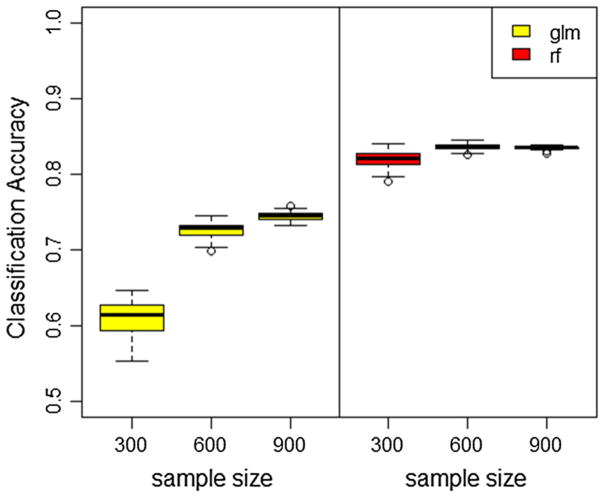
Ten-fold cross-validation was applied to estimate the classification accuracy of both the RF and LR models. The procedure was repeated 50 times. Effect of sample size on both algorithms’ performance was examined. Three cases when sample size equals to 300, 600, and 911 were compared and results were summarized in Fig. 2. RF outperformed LR in terms of classification accuracy in all three scenarios. When sample size is 911, LR has a mean accuracy rate of 75.6% with standard deviation 0.7%, while the mean accuracy rate of RF is 83.5% with standard deviation 0.2% in 50 simulations. This better result of RF can be explained by its lack of model assumptions, adaptive approach to interactions and high order interactions and ability to detect important variables in the model while eliminating the effects of non-relevant ones.
Fig. 2.
Boxplot of classification accuracy estimated using tenfold cross-validation of random forest (right) and logistic regression (left) for various sample sizes
Out-of-Bag Prediction Error of Random Forest
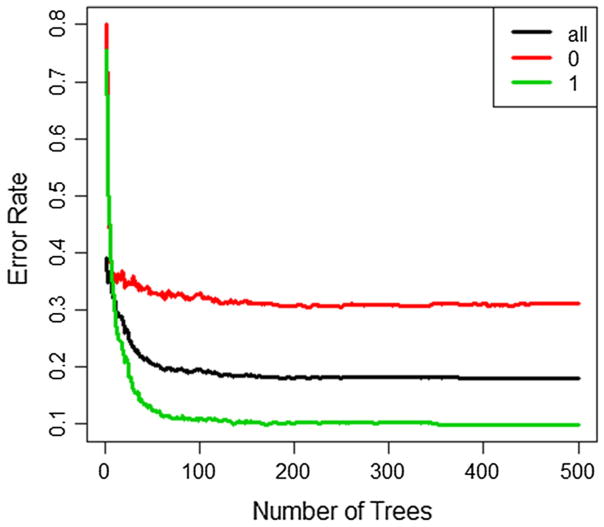
In the second step, full data analysis using RF, the overall OOB prediction error rate was 18.03% with an OOB prediction error rate of 31.94% for predicting participants without receipt of HIV test results and 10.64% for those with receipt of HIV test results. The prediction error rates were stable after growing around 200 trees (Fig. 3). Therefore, although we only used 500 trees in RF for computational efficiency, it does not affect the results.
Fig. 3.
Out of bag prediction errors across number of trees used in random forest for all observations (black), non-HIV-tested group (red) and HIV-tested group (green) (Color figure online)
Variable Importance and Joint Variable Importance of Random Forest
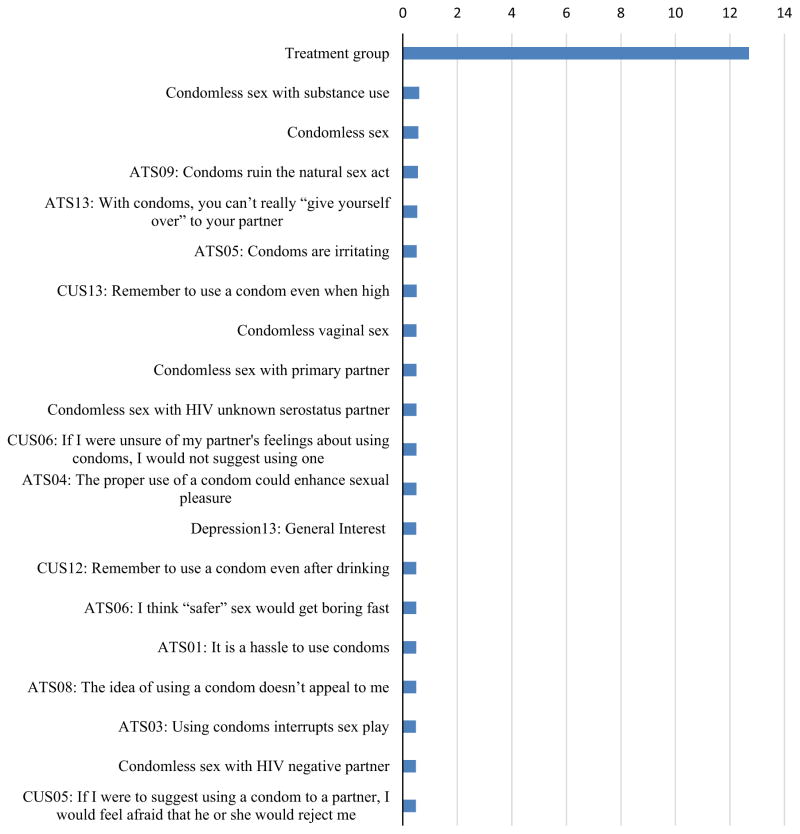
Figure 4 shows the top 20 most important variables according to the VIMP criterion from RF. Treatment group is the most important predictor among all covariates. The VIMP index for treatment group is 12.9%, which indicates that prediction error rate will increase by 12.9% if treatment group is randomly permuted in the model.
Fig. 4.
Variable importance index. The importance index criteria shows decreases in classification accuracy when the values of a given variable have been randomly permuted given all other predictors remain unchanged in the model. ATS attitude toward safer sex, CUS condom use self-efficacy scale
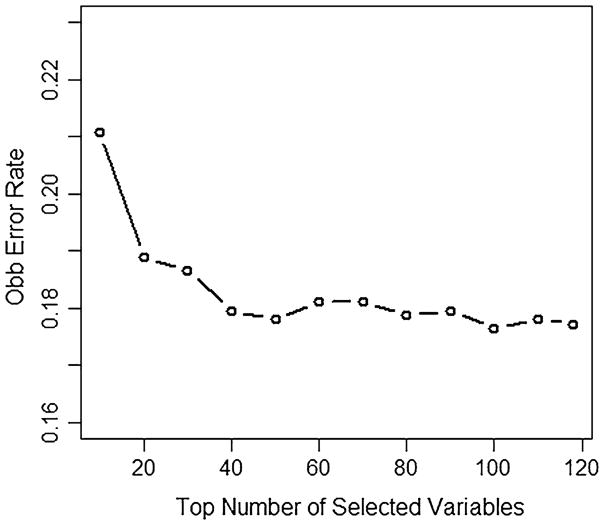
The other 19 most important variables represent several different categories of predictors, including sexual behavior, attitude toward safer sex, condom use self-efficacy, and depression. These results indicate that these factors are more likely to be associated with HIV testing and receipt of results, compared to the other 99 predictors. They are ranked ahead of other predictors, including substance use, and socio-demographics and are associated with the biggest reduction in prediction error. Although, the VIMP index is smaller for these predictors, the selection of VIMP should not be by chance, since the prediction error rate decreases steeply for the top 20 variables (Fig. 5) and continues to decrease for the top 40 variables where it then tends to stabilize. The OOB prediction error rate is 18.9% by using only the first 20 most important covariates, which is just 0.8% more than that using all 119 covariates.
Fig. 5.
Out of bag prediction errors across top numbers of important variables
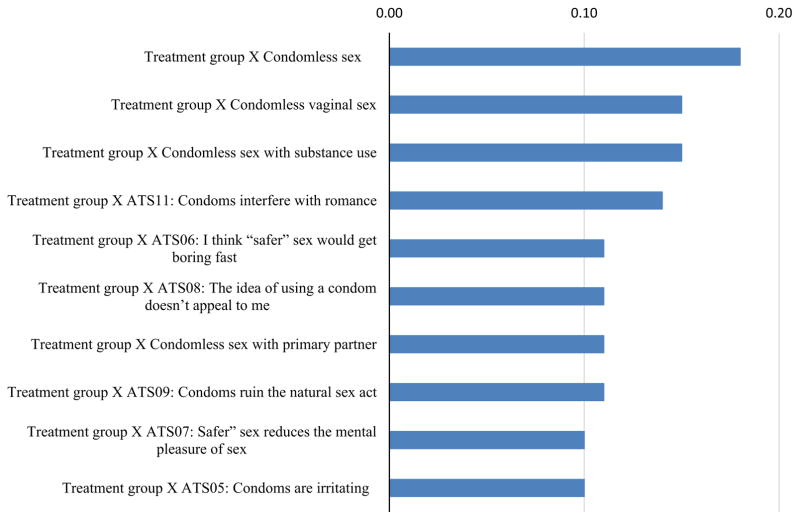
Table 1 and Fig. 6 show the top ten most important interactions between treatment group and all other factors, calculated from taking the absolute value of difference between their joint VIMP and additive VIMP of RF. Among the top ten interactions, four interactions are from different types of condomless sex behaviors, including condomless sex, vaginal sex, condomless sex with substance use, and condomless sex with primary partner, six of the interactions are from attitude toward safer sex. It should be noted, however, that VIMP scores for all interactions are a fraction of a percentage which implies that any subgroup differences in treatment effects are unimportant.
Table 1.
Top ten interactions between treatment groups and other factors (%)
| Interactions | Joint VIMP | Additive VIMP | Interaction VIMPa |
|---|---|---|---|
| Treatment group × condomless sex | 11.84 | 12.01 | 0.18 |
| Treatment group × condomless vaginal sex | 11.82 | 11.97 | 0.15 |
| Treatment group × condomless sex with substance use | 11.84 | 11.99 | 0.15 |
| Treatment group × ATS11: condoms interfere with romance | 11.79 | 11.93 | 0.14 |
| Treatment group × ATS06: “safer” sex get boring fast | 11.82 | 11.93 | 0.11 |
| Treatment group × ATS08: idea of condom use not appealing | 11.79 | 11.9 | 0.11 |
| Treatment group × condomless sex with primary partner | 11.76 | 11.87 | 0.11 |
| Treatment group × ATS09: condoms ruin the natural sex | 11.89 | 12 | 0.11 |
| Treatment group × ATS07: “safer” sex reduce mental pleasure | 11.77 | 11.87 | 0.1 |
| Treatment group × ATS05: condoms are irritating | 11.83 | 11.93 | 0.1 |
ATS attitude toward safer sex
Interaction VIMP = absolute value of difference between the joint VIMP and the additive VIMP
Fig. 6.
Top ten interactions between treatment groups and other factors (%). ATS Attitude toward safer sex
Partial Dependency Plot of Random Forest
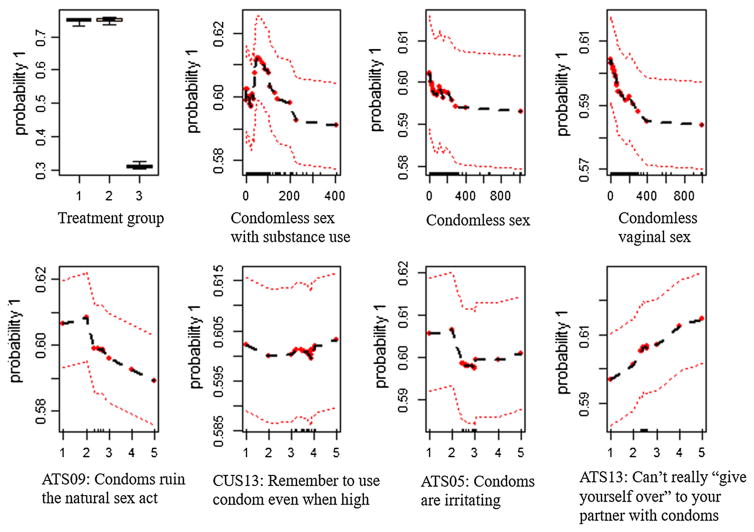
The partial dependency plots (Fig. 7) show how the top eight most important predictors related to the probability of receipt of HIV test result after adjusting for the other predictors. Participants in the two on-site rapid testing arms (on-site rapid HIV testing with brief risk-reduction counseling and on-site rapid HIV testing with information on HIV only) have a much higher probability (~80%) to receive HIV test results than off-site testing referral participants (~30%) (Fig. 7, panel “Treatment Group”); however, there is little difference between the two onsite rapid testing arms. The relationship between counts of condomless sex with substance use and probability of receiving HIV test results is mixed (Fig. 7, panel “Condomless sex with substance use”). The relationship is positive for counts from 0 to 60, and negative for counts from 60 to 200, and null for counts greater than 200. The relationships between counts of condomless sex, counts of condomless vaginal sex (Fig. 7, panels “Condomless sex”, “Condomless vaginal sex”) and probability of receiving HIV test results are negative and nonlinear. There are mixed relationships between attitude toward safer sex (Fig. 7, panels “ATS05: Condoms are irritating”, “ATS09: Condoms ruin the natural sex act”, and “ATS13: Can’t really “give yourself over” to your partner with condoms”) and probability of receiving HIV test results. As for ATS09, the relationship is null from 1 to 2 and then gradually decreased from 2 to 5; for ATS05, the relationship is also null from 1 to 2, then decreased from 2 to 3, and null from 3 to 5. Interestingly, there is a constant positive linear relationship for ATS13. The relationship between condom use self-efficacy scale 13 (CUS13) and probability to receive an HIV test result is null.
Fig. 7.
Probability of receiving HIV test in relation to a variable after adjusting for all other variables. ATS attitude toward safer sex, CUS condom use self-efficacy scale
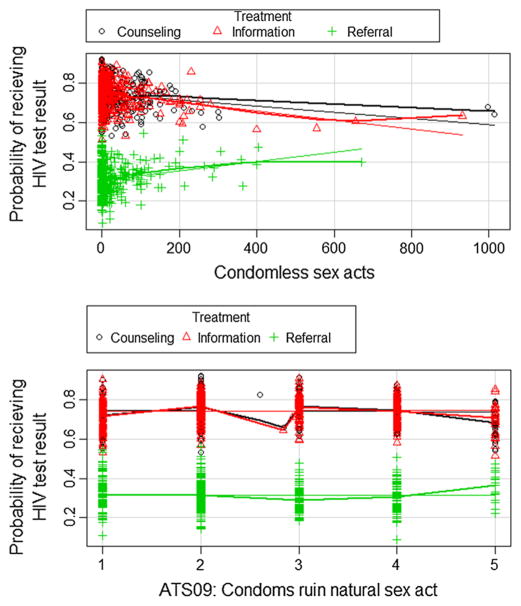
Marginal plots of the interactions can also be made in a similar fashion to the partial dependency plots. Figure 8 shows two examples. For condomless sex acts, there is a slight upward trajectory of the probability of receiving a test result as the count of sex acts increases for participants randomized to the referral treatment arm and a slight decline for the two rapid-testing arms. All of the interactions of treatment with the sexual risk variables followed this pattern. Similarly, all the Attitudes toward safe sex variables looked like the second panel of Fig. 8.
Fig. 8.
Marginal plots of the interactions
Discussion
This study presents a non-parametric multivariate analysis identifying factors that predict the receipt of HIV test results among participants from substance use disorder treatment programs. The use of RF, a robust statistical learning method, allowed us to examine the impact of 119 potential predictors to create a predictive model which should remain highly predictive in future similar samples. In addition, RF showed higher prediction accuracy and clearly outperformed the classical logistic regression method with current data. To our knowledge, little work has been conducted in behavioral HIV prevention and intervention research using a machine learning or, in particular, a RF approach.
Our results suggest that treatment group is the most important predictor among all covariates to predict the receipt of HIV test results, with a 12.9% VIMP index. The partial dependency plot further indicates that participants in the two on-site testing arms showed high probability in receiving HIV test results compared to participants in the off-site referral arm. In addition, there are no clear differences between the two on-site arms which suggest no additional beneficial effect of brief risk-reduction counseling on increasing receipt of HIV test results. These results are consistent with the original Metsch et al. CTN 0032 primary outcome paper [14].
Features of RF have allowed us to further examine other factors which may play important roles in uptake of HIV testing. The large number of covariates investigated in the model, represented different domains including socio-demographic factors, various types of substance use behaviors, sexual risk behaviors, condom use (condom use self-efficacy and attitudes towards condom use) and depression. Sexual risk behavior and condom use were represented by both binary and count measures, as suggested by previous authors [34–36].
Among the top 20 variables (based on VIMP), 18 are related to condom use and sexual behavior (6 count measures of condomless sex acts; 12 condom use scales). Among the top three most important predictors, there are overall non-linear negative relationships between count of condomless sex acts and the receipt of HIV testing results. Participants who reported more condomless sex acts were less likely to receive their HIV test results compared to those who were not sexually active or using condoms. Within the context of offering rapid testing, this indicates that those potentially at higher risk are not accepting the offer. However, more psychological constructs such as the condom use scales, yield mixed results. Participants who agree that condoms “ruin the natural sex acts” were less likely to receive their HIV test results, while those who agree with “with condoms, you can’t really “give yourself over” to your partner.” were more likely to receive their HIV test results.
Results from the current study also provide empirical support that count measures of sexual behaviors should be encouraged over dichotomized measures in the future studies. All 6 measures of sexual behaviors in the top 20 VIMPs were from count measures, rather than dichotomized variables. Schroder et al. [36] suggest that count data are more relevant to intervention studies. Count data of sexual behavior not only yield important and non-redundant information around multiple dimensions of sexual behaviors and can be used to measure intervention impact in reducing the absolute number of participants’ high-risk encounters. None of the socio-demographic or substance use behaviors appeared in the top 20 VIMP, which suggested that these factors were not the most important in predicting receipt of HIV test results.
The research presented and methods used here have several strengths. First, RF can handle arbitrarily large numbers of predictors and predictors with relatively high levels of multicollinearity whereas logistic regression frequently has difficulty with many predictors and multicolinearity as it did in our comparison. A frequently used solution when using logistic regression is to examine bivariate relationships between the outcome and each predictor and then include only significant results in a multivariate model. This approach, unless accompanied by a stringent control for multiple testing is misleading and leads to models that over-fit the data and are very likely not to be replicated on new samples. Because RF assesses predictive performance on OOB individuals (people who were not in the bootstrap sample) they are much more likely to give a good prediction in future samples. Relatedly, the RF approach also had greater classification accuracy than did the LR in our comparison. Second, the RF approach will include any important (potentially complex) interactions into the construction of the forest. Thus important interactions are included in the prediction, whereas in LR these interactions must be created and included in the regression. Subgroup analyses are usually controversial due to type I errors and lack of replication when an exhaustive list of interactions are tested using LR. However, RF as an alternative approach automatically includes any important interactions and these can be explored using the joint VIMP. Third, the data are from a randomized clinical trial with relatively large sample size and complementary information for participants’ risk behaviors.
Despite these strengths, this study and methods used also have limitations that should be noted. RF cannot produce hypothesis testing results, i.e. relative risks, odds ratios, or p-values like in classical regression methods and is thus better for model exploration. Second, RF has been considered by some as a black-box prediction method—the complexity of the forest obscures which variables or features are driving the prediction from simple inspection. This means that additional efforts need to be made to understand what factors are important for prediction. For example, VIMP can be used as an alternative to relative risk/odds ratios to examine importance of a predictor in the model. Also partial dependency plots can be produced to show exactly how a predictor is related to the probability of receipt of their HIV testing result. Furthermore, the VIMP and plotting approaches can be extended to interactions. However, this becomes cumbersome and difficult for higher order interactions. A final limitation to the current study is we have compared logistic regression to just one of many potential additional alternative approaches, for example machine learning methods such as support vector machines, neural networks and Bayesian networks.
Conclusions
In conclusion, a novel application of a comprehensive multivariate analysis was conducted for the data from a randomized HIV rapid testing and counseling study, using a powerful statistical learning method, RF. Results from this study have confirmed our previous findings that offering HIV rapid testing on site in substance use treatment centers substantially increased receipt of HIV test results, but there is no beneficial effect of brief risk-reduction counseling among two on-site testing arms. In addition to treatment arm, our study additionally suggested that higher levels of condomless sexual activity was associated with lower levels of HIV testing, indicating that merely offering an HIV test may not get all at risk tested. Finally, we found little evidence of any subgroup effects on treatment because there were no large treatment assignment interactions with other predictor variables. RF, although it has been used in previous HIV research studies [37–39], is relatively unknown to most behavioral HIV researchers. The approach implemented herein provides an alternative to classical statistical regression modeling, and seems ideal to manage complex high dimensional data sets, examine highly-correlated predictors yielding reliable results even in an exploratory analysis. Its expanded use in behavioral HIV research should yield new insights. In particular, in an intervention setting, RF could be used to provide information for targeting interventions if important interactions with treatment are found.
Acknowledgments
We acknowledge the site principal investigators: David Avila, Michael DeBernardi, Lillian Donnard, Antoine Douaihy, Louise Haynes, Ray Muszynski, Patricia E. Penn, Ned Snead, Kevin Stewart, Robert C. Werstlein, and Katharina Wiest. Site principal investigators’ contributions to the work reported in this article included directing all aspects of the proposed study at their site(s), having overall responsibility for achieving the specific aims of the study, maintaining the proposed study schedule and budget, supervising the project staff, and ensuring quality control over all aspects of this study. We also acknowledge the following site staff: Walitta Abdullah, Elizabeth Alonso, Anika Alvanzo, Anna Amberg, Holly Angel, Rebekka M. Arias, Natasha Arocho, Carolyn Baron-Myak, Sarah Battle, Melissa Beddingfield, Dan Blazer, Stacy Botex, Sarah Bowles, Audrey Brooks, Elizabeth Buttrey, Betty Caldwell, Lynn Calvin, Maria Campanella, Sarah Carney, Angela Casey-Willingham, Jack Chally, Roberta Chavez, Nicholas Cohen, Zoe Cummings, Elisa Cupelli, Dennis Daley, Meredith Davis, Kay Debski, Andrea Dedier, Ashley Dibble, Bruce Dillard, Debbie Drosdick, Monica Eiden, Matthew Elmore, Sarah Essex, Laura Feldberg, Elizabeth Ferris, John Gary, Daniel Gerwien, Marisa Gholson, Melissa Gordon, Lauren Griebel, Laurel Hall, Stephanie Hart, Joshua Hefferen, Beverly Holmes, Christine Horne, Alice Huang, Aleks Jankowska, Beth Jeffries, Kristen Jehl, Eve Jelstrom, Andrew Johnson, Jacob Johnson, Shanna Johnson, Emily Kinsling-Law, Amy Knapp, Eric Kohler, Beatrice Koon, Emily Kraus, Lynn Kunkel, Robert Kushner, Diane Lape, Theresa Latham, Larry Lee, Carol Luna-Anderson, Sue McDavit, Michael McKinney, Cindy Merly, Melody Mickens, Jenni Mulholland, Roger Owen, Barbara Paschke, Wayne Pennachi, Sharon Pickrel, Kimberly Pressley, John Reynolds, Gillian Rossman, Lauretta Safford, Christine Sanchez, Lynn Sanchez, Dorothy Sandstrom, Carmel Scharenbroich, Robert Schwartz, Nicolangelo Scibelli, Michael Shopshire, Jessica Sides, Eugene Somoza, Maxine Stitzer, Joseph Sullivan, Krishna Suwal, Danielle Terrell, Lauren Thomas, Rena Treacher, Dominic Usher, Angel Valencia, Tammy Van Linter, Rosa Verdeja, Joanne Weidemann, Brandi Welles, Lindsay Worth, and Pamela Yus. Site staff contributions to the work reported in this article included conducting recruitment and enrollment activities, performing assessment interviews, conducting study interventions, performing quality assurance monitoring activities, performing data entry, and completing other day-to-day study activities that led to the collection of the study data. The statements in this publication, article are solely the responsibility of the authors and do not necessarily represent the views of the Patient-Centered Outcomes Research Institute (PCORI), its Board of Governors or Methodology Committee or the National Institutes of Health. We would also like to acknowledge Viviana E. Horigian for her help to provide the Spanish version abstracts.
Funding Funding for the data used in this study and analysis was provided by the National Drug Abuse Treatment Clinical Trials Network under the following cooperative agreements, awards, and contracts: U10DA013720, U10DA13720-09S, U10DA020036, U10DA15815, U10DA13034, U10DA013038, U10DA013732, U10DA13036, U10DA13727, U10DA015833, HHSN271200522081C, and HHSN271200522071C; Funding for this secondary analysis was provided by the National Institute on Drug Abuse Grant: R21 DA038641; Patient-Centered Outcomes Research Institute: PCORI ME-1403-12907.
Footnotes
Compliance with Ethical Standards
Conflicts of interest The authors declare that they have no conflict of interest.
Ethical approval All procedures performed in studies involving human participants were in accordance with the ethical standards of the institutional and/or national research committee and with the 1964 Helsinki declaration and its later amendments or comparable ethical standards.
Informed consent Informed consent was obtained from all individual participants included in the study.
References
- 1.Centers for Disease Control and Prevention (CDC) [Accessed 1 Nov 2016];HIV surveillance report 2013. 2015 :25. http://www.cdc.gov/hiv/library/reports/surveillance/
- 2.Hall HI, An Q, Tang T, et al. Prevalence of diagnosed and undiagnosed HIV infection—United States, 2008–2012. MMWR Morb Mortal Wkly Rep. 2015;26:657–62. [PMC free article] [PubMed] [Google Scholar]
- 3.Centers for Disease Control and Prevention (CDC) Estimated HIV incidence among adults and adolescents in the United States, 2007–2010. HIV surveillance supplemental report 2012. 2012;17(4) http://www.cdc.gov/hiv/topics/surveillance/resources/reports/#supplemental. [Google Scholar]
- 4.Hall HI, Holtgrave DR, Maulsby C. HIV transmission rates from persons living with HIV who are aware and unaware of their infection. AIDS. 2012;26(7):893–6. doi: 10.1097/QAD.0b013e328351f73f. [DOI] [PubMed] [Google Scholar]
- 5.Branson BM, Handsfield HH, Lampe MA, et al. Revised recommendations for HIV testing of adults, adolescents, and pregnant women in health-care settings. MMWR. Recommendations and reports: morbidity and mortality weekly report. Recommendations and reports/Centers for Disease Control. 2006;55(RR-14):1–17. quiz CE11-14. [PubMed] [Google Scholar]
- 6.Centers for Disease Control and Prevention (CDC) Integrated prevention services for HIV infection, viral hepatitis, sexually transmitted diseases, and tuberculosis for persons who use drugs illicitly: summary guidance from CDC and the US Department of Health and Human Services. MMWR. Recommendations and reports: morbidity and mortality weekly report. Recommendations and reports/Centers for Disease Control. 2012;61(RR-5):1. [PubMed] [Google Scholar]
- 7.Centers for Disease Control and Prevention (CDC) [Accessed 11 Aug 2016];HIV and substance use in the United States. 2015 http://www.cdc.gov/hiv/riskbehaviors/substanceuese.html.
- 8.Hess K, Hu X, Lansky A, Mermin J, Hall I. [Accessed 10 Sept 2016];Estimating the lifetime risk of a diagnosis of HIV infection in the United States. 2016 doi: 10.1016/j.annepidem.2017.02.003. http://www.croiconference.org/sessions/estimating-lifetime-risk-diagnosis-hiv-infection-united-states. [DOI] [PMC free article] [PubMed]
- 9.King KM, Nguyen HV, Kosterman R, Bailey JA, Hawkins JD. Co-occurrence of sexual risk behaviors and substance use across emerging adulthood: evidence for state- and trait-level associations. Addiction. 2012;107(7):1288–96. doi: 10.1111/j.1360-0443.2012.03792.x. [DOI] [PMC free article] [PubMed] [Google Scholar]
- 10.Raj A, Saitz R, Cheng DM, Winter M, Samet JH. Associations between alcohol, heroin, and cocaine use and high risk sexual behaviors among detoxification patients. Am J Drug Alcohol Abuse. 2007;33(1):169–78. doi: 10.1080/00952990601091176. [DOI] [PubMed] [Google Scholar]
- 11.Rosengard C, Anderson BJ, Stein MD. Correlates of condom use and reasons for condom non-use among drug users. Am J Drug Alcohol Abuse. 2006;32(4):637–44. doi: 10.1080/00952990600919047. [DOI] [PubMed] [Google Scholar]
- 12.D’Aunno T, Pollack HA, Jiang L, Metsch LR, Friedmann PD. HIV testing in the nation’s opioid treatment programs, 2005–2011: the role of state regulations. Health Serv Res. 2014;49(1):230–48. doi: 10.1111/1475-6773.12094. [DOI] [PMC free article] [PubMed] [Google Scholar]
- 13.Substance abuse and mental health services Administration, Center for Behavioral Health Statistics and Quality. The N-SSATS report: HIV services offered by substance abuse treatment facilities. Rockville, M.D: Substance Abuse and Mental Health Services Administration; 2010. [Google Scholar]
- 14.Metsch LR, Feaster DJ, Gooden L, et al. Implementing rapid HIV testing with or without risk-reduction counseling in drug treatment centers: results of a randomized trial. Am J Public Health. 2012;102(6):1160–7. doi: 10.2105/AJPH.2011.300460. [DOI] [PMC free article] [PubMed] [Google Scholar]
- 15.Metcalf CA, Douglas JM, Jr, Malotte CK, et al. Relative efficacy of prevention counseling with rapid and standard HIV testing: a randomized, controlled trial (RESPECT-2) Sex Transm Dis. 2005;32(2):130–8. doi: 10.1097/01.olq.0000151421.97004.c0. [DOI] [PubMed] [Google Scholar]
- 16.Skinner HA. Assessment of substance abuse: drug abuse screening test. 2. Durham: Macmillan Reference USA; 2001. [Google Scholar]
- 17.Skinner HA. The drug abuse screening test. Addict Behav. 1982;7(4):363–71. doi: 10.1016/0306-4603(82)90005-3. [DOI] [PubMed] [Google Scholar]
- 18.NIAAA. Helping patients who drink too much: a clinician’s guide. Maryland, Bethesda: 2005. [Google Scholar]
- 19.Koblin BA, Husnik MJ, Colfax G, et al. Risk factors for HIV infection among men who have sex with men. Aids. 2006;20(5):731–9. doi: 10.1097/01.aids.0000216374.61442.55. [DOI] [PubMed] [Google Scholar]
- 20.Metsch LR, McCoy CB, McCoy HV, et al. HIV-related risk behaviors and seropositivity among homeless drug-abusing women in Miami, Florida. J Psychoact Drugs. 1995;27(4):435–46. doi: 10.1080/02791072.1995.10471707. [DOI] [PubMed] [Google Scholar]
- 21.Brafford LJ, Beck KH. Development and validation of a condom self-efficacy scale for college students. J Am Coll Health. 1991;39(5):219–25. doi: 10.1080/07448481.1991.9936238. [DOI] [PubMed] [Google Scholar]
- 22.DeHart DD, Birkimer JC. Trying to practice safer sex: development of the sexual risks scale. J Sex Res. 1997;34(1):11–25. [Google Scholar]
- 23.Rush AJ, Trivedi MH, Ibrahim HM, et al. The 16-item quick inventory of depressive symptomatology (QIDS), clinician rating (QIDS-C), and self-report (QIDS-SR): a psychometric evaluation in patients with chronic major depression. Biol Psychiatry. 2003;54(5):573–83. doi: 10.1016/s0006-3223(02)01866-8. [DOI] [PubMed] [Google Scholar]
- 24.Breiman L. Random forests. Mach Learn. 2001;45(1):5–32. [Google Scholar]
- 25.Ishwaran H, Kogalur UB, Blackstone EH, Lauer MS. Random survival forests. Ann Appl Stat. 2008;2:841–60. [Google Scholar]
- 26.Ishwaran H, Kogalur UB. Random forests for survival, regression and classification (RF-SRC) R package version 1.6.1. 2015 [Google Scholar]
- 27.Xu Ruo. Graduate Theses and Dissertations. 2013. Improvements to random forest methodology. Paper 13052. [Google Scholar]
- 28.Friedman JH. Greedy function approximation: a gradient boosting machine. Ann Stat. 2001;29:1189–232. [Google Scholar]
- 29.Ishwaran H. Variable importance in binary regression trees and forests. Electron J Stat. 2007;1:519–37. [Google Scholar]
- 30.Chen X, Ishwaran H. Random forests for genomic data analysis. Genomics. 2012;99(6):323–9. doi: 10.1016/j.ygeno.2012.04.003. [DOI] [PMC free article] [PubMed] [Google Scholar]
- 31.Shi M, He J. SNRFCB: sub-network based random forest classifier for predicting chemotherapy benefit on survival for cancer treatment. Mol BioSyst. 2016;12(4):1214–23. doi: 10.1039/c5mb00399g. [DOI] [PubMed] [Google Scholar]
- 32.Xiao LH, Chen PR, Gou ZP, et al. Prostate cancer prediction using the random forest algorithm that takes into account transrectal ultrasound findings, age, and serum levels of prostate-specific antigen. Asian J Androl. 2016 doi: 10.4103/1008-682X.186884. [DOI] [PMC free article] [PubMed] [Google Scholar]
- 33.Stekhoven DJ, Bühlmann P. MissForest—non-parametric missing value imputation for mixed-type data. Bioinformatics. 2012;28(1):112–8. doi: 10.1093/bioinformatics/btr597. [DOI] [PubMed] [Google Scholar]
- 34.Noar SM, Cole C, Carlyle K. Condom use measurement in 56 studies of sexual risk behavior: review and recommendations. Arch Sex Behav. 2006;35(3):327–45. doi: 10.1007/s10508-006-9028-4. [DOI] [PubMed] [Google Scholar]
- 35.Fonner VA, Kennedy CE, O’Reilly KR, Sweat MD. Systematic assessment of condom use measurement in evaluation of HIV prevention interventions: need for standardization of measures. AIDS Behav. 2014;18(12):2374–86. doi: 10.1007/s10461-013-0655-1. [DOI] [PMC free article] [PubMed] [Google Scholar]
- 36.Schroder KE, Carey MP, Vanable PA. Methodological challenges in research on sexual risk behavior: II. Accuracy of self-reports. Ann Behav Med. 2003;26(2):104–23. doi: 10.1207/s15324796abm2602_03. [DOI] [PMC free article] [PubMed] [Google Scholar]
- 37.Segal MR, Barbour JD, Grant RM. Relating HIV-1 sequence variation to replication capacity via trees and forests. Stat Appl Genet Mol Biol. 2004;3(1):1–18. doi: 10.2202/1544-6115.1031. [DOI] [PubMed] [Google Scholar]
- 38.Xu S, Huang X, Xu H, Zhang C. Improved prediction of coreceptor usage and phenotype of HIV-1 based on combined features of V3 loop sequence using random forest. J Microbiol. 2007;45(5):441–6. [PubMed] [Google Scholar]
- 39.Dybowski JN, Heider D, Hoffmann D. Prediction of co-receptor usage of HIV-1 from genotype. PLoS Comput Biol. 2010;6(4):e1000743. doi: 10.1371/journal.pcbi.1000743. [DOI] [PMC free article] [PubMed] [Google Scholar]


