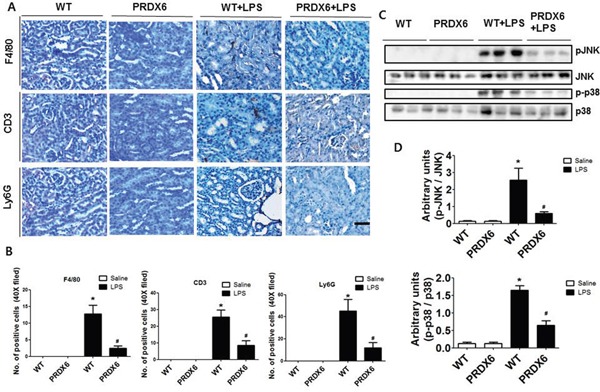
Figure 3. PRDX6 mice showed lower LPS-induced immune cells infiltration and activation of MAPK in the kidney than WT mice.

(A) Immunohistochemistry of infiltrated immune cells such as macrophages (F4/80), T cells (CD3) and neutrophils (Ly6G) in the kidney of LPS-injected WT and PRDX6 mice (Scale bars, 50μm). (B) Infiltrated macrophages (F4/80), T cells (CD3) and neutrophils (Ly6G) in the kidney of WT and PRDX6 mice. ± SEM, *P < 0.05. (n = 5), saline versus LPS injected WT mice, #P < 0.05. (n = 5), LPS injected WT versus PRDX6 mice. (C) Activation of JNK and p38 MAP kinase was determined in the total protein extracts of LPS-injected WT and PRDX6 mice kidney tissues by Western blotting and (D) quantified blot data. ± SEM, *P < 0.05. (n = 5), saline versus LPS injected WT mice, #P < 0.05. (n = 5), LPS injected WT versus PRDX6 mice.
