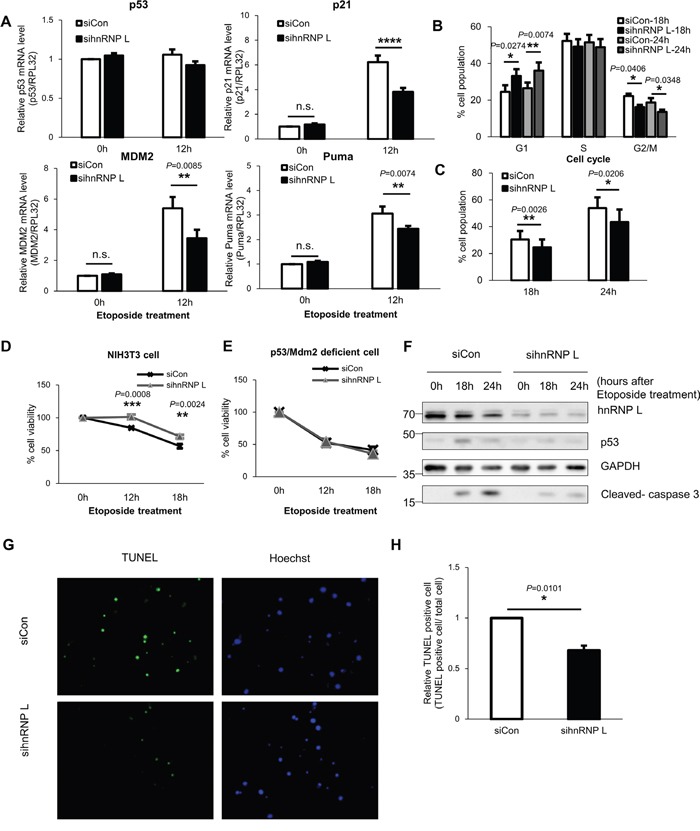
Figure 5. Reduction of hnRNP L downregulates p53 expression and relieves cell cycle arrest and DNA damage-induced apoptosis of NIH3T3 cells.

(A) mRNA levels of p53 target genes including p21, Mdm2 and Puma decrease in NIH3T3 cells transfected with hnRNP L siRNA and under etoposide treatment. At 24 h after transfection with control or hnRNP L siRNA, NIH3T3 cells were treated with or without 100 μM etoposide for 12 h. The levels of p21, MdmM2 and Puma mRNAs were analyzed by qRT-PCR and normalized to RPL32 mRNA levels. mRNA levels in control siRNA transfected and non-etoposide treated cells were set as 1. The bars represent the mean±SEM (n=5). (B, C) hnRNP L silencing lowers p53-mediated G2/M arrest and cell death. At 24 h after transfection with control or hnRNP L siRNA, NIH3T3 cells were treated with 50 μM etoposide for the indicated times and stained with DNA dye, propidium iodide (PI). The data were analyzed by flow cytometry. The bars represent the mean±SEM (n=4). (D) Reduction of hnRNP L increases cell viability. Control siRNA or hnRNP L siRNA transfected cells were exposed to 50 μM etoposide for the indicated times and the cell viability was assessed by MTT assay. The graph represents the mean±SEM (n=3). (E) In immortalized fibroblasts from p53/Mdm2 double-knockout mouse, hnRNP L does not affect cell viability. 50 μM etoposide was added to p53/Mdm2 double-knockout mouse fibroblasts transfected with siCon or sihnRNP L and MTT assay was conducted for measurement of cell viability. The graph represents the mean±SEM (n=3). (F) p53 expression is suppressed by knock-down of hnRNP L, which reduces activation and cleavage of caspase 3. Transfected cells were treated with 50 μM etoposide for the indicated times. Knock-down of hnRNP L was confirmed by WB. (G, H) Cell apoptosis was suppressed by hnRNP L knock-down. TUNEL assay was performed in cells transfected with control or hnRNP L siRNA and treated with 100 μM etoposide for 48 h. Nuclei were stained with Hoechst 33342. (G) Representative image from four independent experiments. (H) The diagram shows relative apoptotic cells measured by TUNEL assay. The bars represent the mean±SEM (n=4). More than 700 cells were analyzed in both group. The number of TUNEL-positive cells in control siRNA transfected cells was set as 1. Data information: In (A-E, H), *P<0.05, **P<0.01, ***P<0.001, ****P<0.0001 (Two-way ANOVA, Student's t-test).
