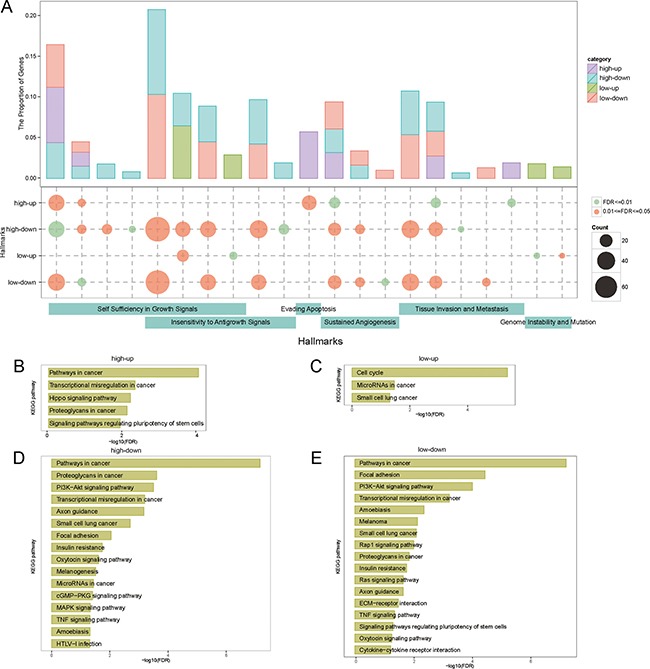
Figure 5. The function enrichment of mRNAs.

Each column represented a hallmark. (A) The distribution of hallmarks. The top panel was the proportion of genes: (genes enriched in hallmarks in ceRNA network). In the middle panel, the node size was the number of genes enriched in hallmarks. The bottom bar represented the classification of hallmarks. (B, C, D and E) The significant KEGG pathways.
