Significance
Neural oscillations have been shown to support a range of cognitive abilities. Here we demonstrate that delta activity (2–4 Hz) in the prefrontal cortex tracked the current task context and modulated sensory processing in a top-down manner. We show that frontal delta and parietooccipital alpha (8–12 Hz) oscillations are functionally coupled and jointly guide visual perception to integrate sensory evidence with current task demands. We observed strong moment-to-moment behavioral fluctuations, which cycled at the rate of the endogenous prefrontal oscillatory brain activity. Our findings suggest that neuronal oscillations provide the functional basis for context-dependent visual perception.
Keywords: top-down control, directional cross-frequency coupling, prefrontal cortex, alpha oscillations, phase–amplitude coupling
Abstract
Conscious visual perception is proposed to arise from the selective synchronization of functionally specialized but widely distributed cortical areas. It has been suggested that different frequency bands index distinct canonical computations. Here, we probed visual perception on a fine-grained temporal scale to study the oscillatory dynamics supporting prefrontal-dependent sensory processing. We tested whether a predictive context that was embedded in a rapid visual stream modulated the perception of a subsequent near-threshold target. The rapid stream was presented either rhythmically at 10 Hz, to entrain parietooccipital alpha oscillations, or arrhythmically. We identified a 2- to 4-Hz delta signature that modulated posterior alpha activity and behavior during predictive trials. Importantly, delta-mediated top-down control diminished the behavioral effects of bottom-up alpha entrainment. Simultaneous source-reconstructed EEG and cross-frequency directionality analyses revealed that this delta activity originated from prefrontal areas and modulated posterior alpha power. Taken together, this study presents converging behavioral and electrophysiological evidence for frontal delta-mediated top-down control of posterior alpha activity, selectively facilitating visual perception.
Visual perception is flexible, selective, and rapidly integrates sensory evidence with endogenous high-level expectations and predictions (1, 2). It has been suggested that rhythmic brain activity constitutes a key mechanism to coordinate information flow in the human cerebral cortex by transiently forming task-relevant large-scale networks (1). However, it is currently unclear how contextual information is dynamically integrated to support visual perception. Numerous studies have shown that visual perception critically depends on prestimulus alpha-band (8–12 Hz) activity (3–7). The gating-by-inhibition hypothesis postulates that alpha serves as a mechanism to route information to task-relevant cortical sites (8) but might also be under top-down control (6, 7). However, it is currently unclear which cortical regions and mechanisms mediate the directed top-down control of alpha oscillations (2). It has been suggested that slow-frequency activity in the delta range (<5 Hz) might reflect a mechanism for endogenous attentional selection and predictions (9, 10). In particular, endogenous low-frequency entrainment is thought to reflect a substrate of top-down processing (11–14). Importantly, endogenous entrainment does not require rhythmicity in the input stream but reflects an intrinsic mechanism to enable predictions (15). Several studies have demonstrated that visual perception cycles as a function of the alpha phase but only a few reports have demonstrated that multiple rhythms modulate behavior on a fine-grained temporal scale (5, 16–19).
At present, it is uncertain how different temporal scales interact to integrate information and support high-level visual perception. The concept of cross-frequency coupling (CFC), where the phase of a low-frequency oscillation modulates the amplitude of a faster oscillation, may constitute a key element for spatiotemporal organization in the human cortex (20) but has several methodological limitations that must be considered (21–23).
Our goal was to disentangle the role of alpha oscillations in contextual processing and anticipatory attention (24). We sought to identify a mechanism that could mediate long-range top-down control of posterior alpha activity (2, 25). We hypothesized that if the underlying functional architecture is rhythmic in nature, then multiple rhythms should modulate behavior and possibly arise from distinct cortical areas (2, 26).
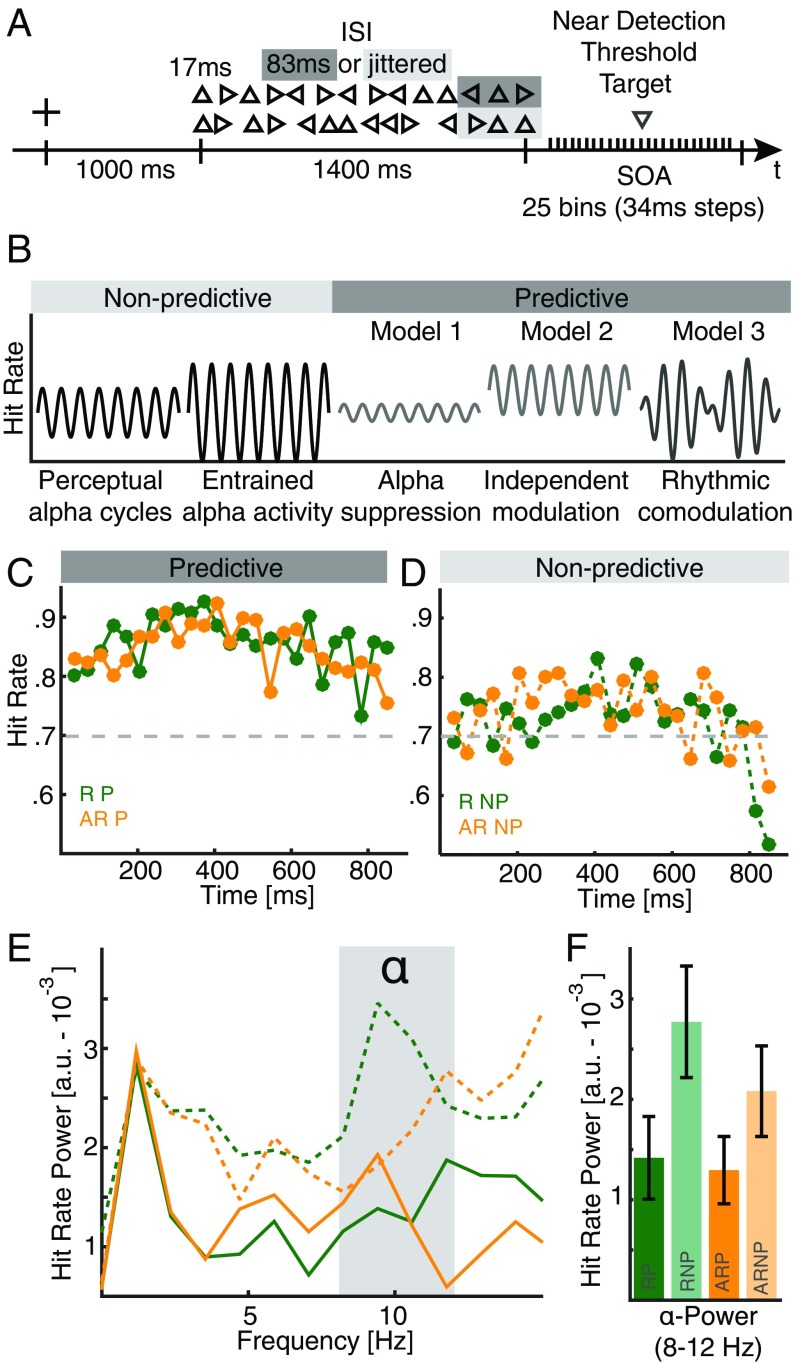
In a visual target detection task (Fig. 1A), we manipulated the bottom-up sensory evidence by titrating the target luminance to perceptual threshold as well as the degree of high-level top-down predictions (27). Previously, it had been demonstrated that patients with prefrontal cortex (PFC) lesions were unable to use a predictive visual sequence (clockwise left-, up-, rightward facing triangles) in this task to guide behavior, suggesting a key role of the PFC in using predictive information (27). Importantly, in the current study the visual stream was presented either arrhythmically or at 10 Hz to drive cortical alpha activity in a bottom-up manner, but the visual stream did not contain temporal information about the upcoming target. Crucially, we sampled the resulting behavior over a time course of 850 ms to study the temporal evolution of target detection performance. We predicted that the 10-Hz flicker entrains cortical alpha activity and enhances perceptual fluctuations in the alpha band. We expected that the predictive sequence modulates this rhythmic sampling and we considered three possible models (Fig. 1B): (model 1) a suppression of rhythmic sampling in the alpha range; (model 2) an alpha-independent enhancement; or (model 3) a rhythmic comodulation. If higher cognitive functions operate in a rhythmic mode, then perceptual alpha cycles should be modulated by a slower rhythm arising from distinct cortical areas, thus favoring model 3. An interaction of prediction and rhythmicity would indicate an active role of alpha oscillations for top-down control.
Fig. 1.
Behavioral task, hypotheses, and behavioral performance. (A) Schematic task design. Every trial consisted of 14 rapidly flashed triangles (rhythmically at 10 Hz or arrhythmically). After a variable onset delay (34–850 ms in 34-ms steps), a downward facing triangle was presented at perceptual threshold. Participants had to indicate whether they perceived the target. (B) Schematic task outcome. We predicted that visual detection performance would vary as a function of the alpha phase over time (arrhythmic nonpredictive) and that this effect could be enhanced through 10-Hz visual stimulation (rhythmic nonpredictive). For the top-down condition (arrhythmic predictive), we hypothesized three potential outcomes: (i) participants suppress perceptual alpha cycles (model 1), or (ii) they perform better, but still exhibit alpha cycles (alpha independent modulation; model 2), or (iii) top-down processing operates in a rhythmic mode, resulting in a comodulation by a second, slower rhythm (model 3). An interaction of rhythmicity and prediction would indicate a causal role of alpha oscillations for top-down control. (C) Grand-mean hit rate time courses for rhythmic (green) and arrhythmic (orange) predictive trials. The gray dashed line at 70% indicates the intended behavioral performance. (D) Grand-mean hit rates for nonpredictive trials. Same conventions as in C. (E) Hit rate power spectra for all four conditions. Note the strongest peak around 10 Hz is elicited by the nonpredictive rhythmic condition. (F) Average hit rate power in the canonical 8- to 12-Hz alpha range highlights a main effect of predictive context, with overall lower values in the alpha range.
Results
Participants (n = 18) were asked to detect a near-threshold target occurring after a stimulus train. The last three items of the stream could either carry the predictive sequence (clockwise rotating triangles) (27) or not (Fig. 1A). The stimulus train was presented at either 10 Hz or arrhythmically. We probed 25 bins in steps of 34 ms after the offset of the last item of the flicker sequence to study the temporal evolution of the hit rates.
Predictive Context Facilitates Behavioral Performance.
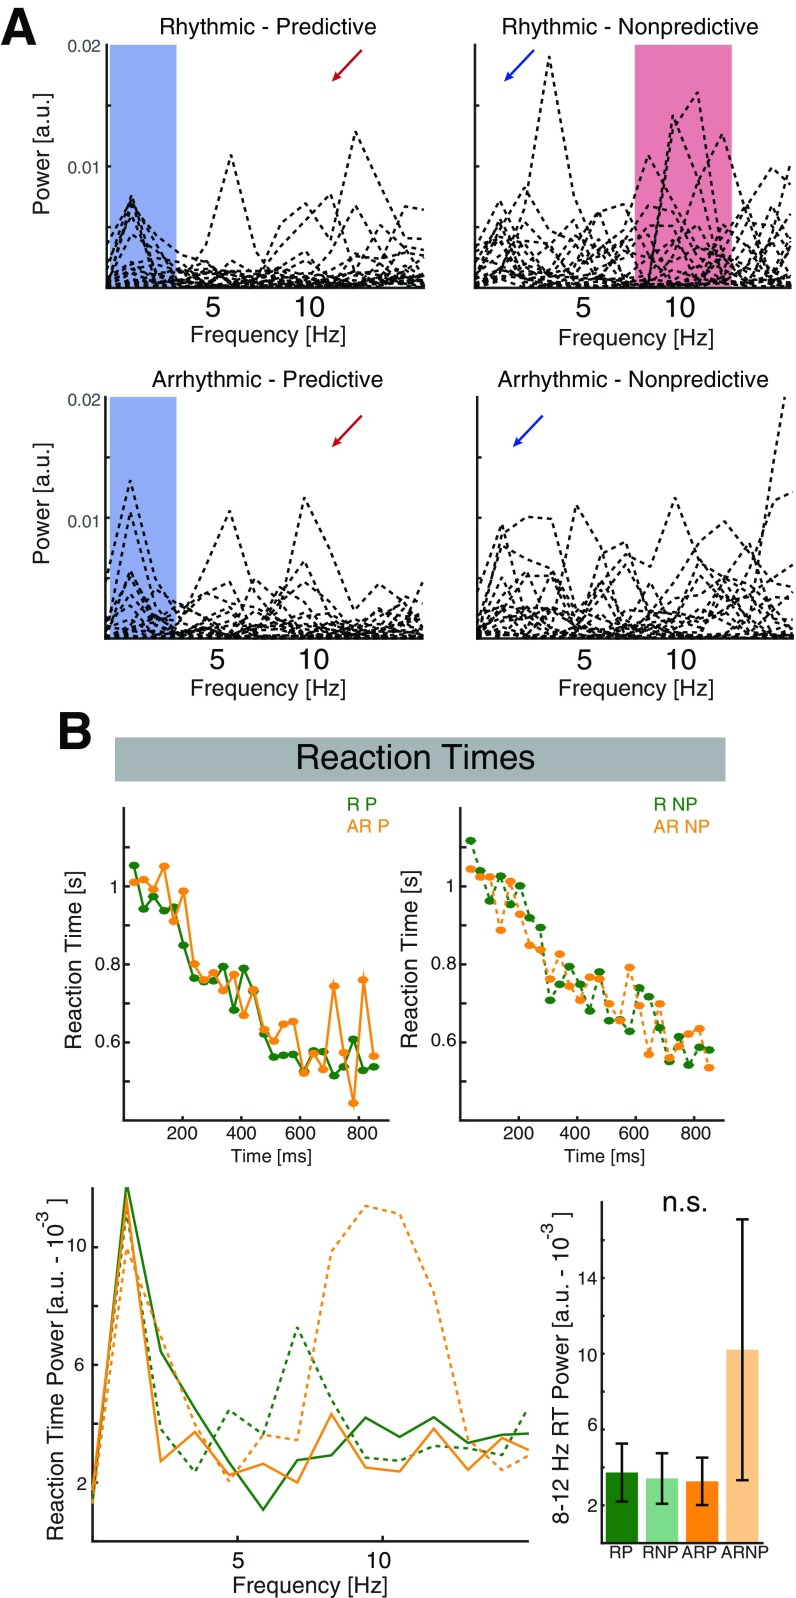
Behavioral performance across all sampled bins was assessed by means of two-way repeated measures ANOVAs with the factors context (predictive/nonpredictive) and rhythmicity (rhythmic/arrhythmic). We focused on hit rates and reaction times in line with previous reports (5, 18) to obtain behavioral time courses. We found a significant effect of context (F1,17 = 17.96, P = 0.0006, η2 = 0.4687), indicating higher hit rates for predictive than nonpredictive trials (Fig. 1 C and D). No effect for rhythmicity was observed (F1,17 = 0.09, P = 0.7674, η2 = 0.0003) and the interaction was not significant (F1,17 = 3.13, P = 0.0947, η2 = 0.0053). In addition, predictive context also facilitated reaction times (Fig. S1).
Fig. S1.
Individual hit rates spectra and reaction times. (A) Single subject spectrograms for all four conditions. The blue shaded area highlights the low-frequency range that exhibits an increased consistency during predictive contexts. The blue arrows (Right) highlight that this effect was less pronounced for the nonpredicted conditions. The red shaded area (Upper Right) highlights the increased consistency in the alpha range during rhythmic driving in absence of any top-down cues. Note, that more subjects exhibited a higher peak in the alpha band than during top-down guided visual processing (red arrows, Left). (B) Grand-average reaction time courses. Same conventions as in Fig. 1 C–F. Note the prominent hazard function, where reaction times become faster in later bins, given that the target has not been presented yet. When collapsed across time, we observed no significant effects of context (F1,17 = 4.26, P = 0.0547, η2 = 0.1369), rhythmicity (F1,17 = 0.93, P = 0.3480, η2 = 0.0122), or interaction (F1,17 = 4.41, P = 0.0510, η2 = 0.0168). After transforming the behavioral into frequency space by a fast Fourier transform (FFT), we assessed the power in the canonical 8- to 12-Hz alpha band. We did not find any differences between conditions (context: F1,17 = 1.02, P = 0.3275, η2 = 0.0212; rhythmicity: F1,17 = 1.08, P = 0.3135, η2 = 0.0193; interaction: F1,17 = 1.55, P = 0.2293, η2 = 0.0253).
Perceptual Alpha Cycles Are Modulated by Lower Frequencies During Top-Down Processing.
Spectral differences between conditions were analyzed by transforming the data into frequency space (Fig. 1E and Fig. S1A, for individual spectra). First, we compared the mean power in the canonical alpha band (8–12 Hz) between conditions by means of a two-way repeated measures (RM)-ANOVA (Fig. 1F). We found significantly lower values in the alpha range for the predictive context (F1,17 = 6.67, P = 0.0193, η2 = 0.1218), while neither rhythmicity nor the interaction had a significant influence (rhythmicity: F1,17 = 0.95, P = 0.3439, η2 = 0.0176; interaction: F1,17 = 0.64, P = 0.4333, η2 = 0.0086). These results indicate that predictive contexts decreased perceptual cycles in the alpha range. In contrast to previous studies (18), we did not find alpha-related modulations of reaction times (Fig. S1B). Notably, the overall highest power in the alpha range was observed for the 10-Hz flicker condition without predictive context, in accordance with the hypothesized outcome that sensory alpha entrainment should increase perceptual alpha cycles (26, 28) (Fig. 1 B and E).
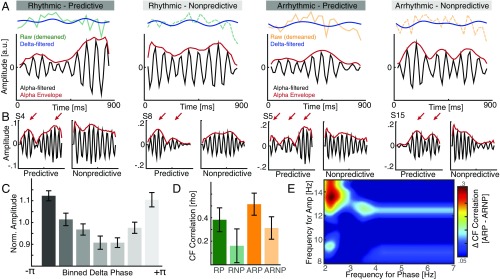
In a more data-driven approach, we compared the conditions by means of a cluster-based permutation test to estimate the exact spectral extent of the observed differences. We found that the power decrease spanned the high alpha range from 10 to 15 Hz (P = 0.0016, d = −0.9124), while a weaker effect was observed in the 2- to 4-Hz delta range (P = 0.0576, d = −0.7301). Subsequently, we aimed to investigate the temporal evolution of the observed spectral differences. Thus, we filtered the individual hit rate time courses in the 2- to 4-Hz and the 10- to 15-Hz ranges (Fig. 2A). The filtered time courses indicated that the alpha amplitude varied over time and was not constant (Fig. 2 A and B).
Fig. 2.
Comodulation of perceptual cycles during top-down processing. (A, Upper) Demeaned raw hit rates time courses superimposed with the low-pass filtered time course (blue). (Lower) Alpha filtered time course (black) and the corresponding envelope (red). Note that the alpha envelope is not constant over time but exhibits rhythmic modulations. We hypothesized that there might be a relationship between the slow and the faster component. (B) Inspection of single subject time courses for predictive and nonpredictive contexts indicated that this modulation might be pronounced for predicted contexts. (Left) Two examples from rhythmic stimulus presentations; (Right) two arrhythmic examples. (C) Grand average histogram of the nonuniform distribution of the normalized alpha amplitude relative to the delta phase. (D) Cross-frequency correlation analyses revealed a main effect for predicted contexts. However, the group results indicate that the strongest correlation was observed for arrhythmic sensory stimulation with predictive context. The lowest correlation was observed when no predictive cues were present and the sensory input was presented at 10 Hz. (E) Difference comodulogram for the arrhythmic condition (predictive−nonpredictive) indicates that the effect was most prominent between the 2- to 3-Hz phase and the high alpha amplitude.
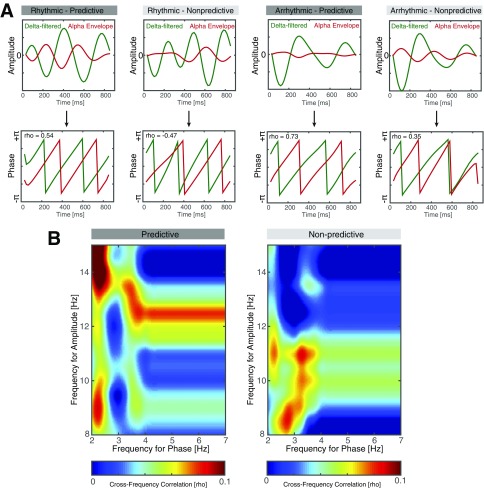
We then assessed (i) whether there is a systematic relationship between the slow fluctuations in the delta range and variations in the high alpha amplitude and (ii) whether this relationship is more pronounced for predictive versus nonpredictive contexts. We first analyzed the distribution of alpha amplitude relative to the delta phase across all conditions (Fig. 2C). We binned the delta phase into seven linearly spaced bins and found that the alpha amplitude varied as a function of the delta phase (one-way RM-ANOVA: F2.25, 38.21 = 8.21, P < 0.0001, η2 = 0.3256). To quantify conditional differences, we calculated the cross-frequency correlation between the delta phase and the instantaneous phase of the alpha envelope (Fig. S2A). We found stronger correlations for predictive contexts (Fig. 2D; F1,17 = 4.65, P = 0.0456, η2 = 0.0645), but no main effects of rhythmicity and no interaction effect (rhythmicity: F1,17 = 1.28, P = 0.2735, η2 = 0.0289; interaction: F1,17 = 0.01, P = 0.9311, η2 = 0.0001). A difference comodulogram indicates that this effect was most pronounced in the delta and high alpha range (Fig. 2E and Fig. S2B). These findings clearly point toward a rhythmic comodulation of perceptual alpha cycles consistent with model 3 (Fig. 1B). However, some aspects of the data also support model 1 (alpha suppression, Fig. 1 E and F), but we found no behavioral evidence supporting model 2.
Fig. S2.
Cross-frequency correlation analysis. (A) Cross-frequency correlation analysis for one single subject in all four conditions. (Upper row) Highlights superimposed delta-filtered time courses (green) along with the alpha envelope (red). Note the antagonistic relationship (delta trough coincides with the alpha peak), which is pronounced for the predictive conditions (panels 1 and 3). (Lower row) The same time courses after applying the Hilbert transform and extracting the instantaneous phase angle time series. Again, note that there was ≈180° phase difference for the predictive contexts and that this relationship was less stable for nonpredicted contexts (panels 2 and 4), which exhibited phase slips and a less consistent phase difference. Circular correlations between phase series were calculated using the CircStat toolbox. (B) Grand average behavioral correlograms for the predicted and unpredicted contexts. Nonlinear cross-frequency correlation analyses indicated that the underlying signals exhibited different characteristics with the most pronounced difference in the 2- to 4-Hz range to the 12- to 15-Hz range. In contrast to previous cross-frequency coupling reports which might have been confounded by power differences between conditions (higher power was reflected in increased CFC), we observed the opposite here. Power decrements in the behavioral time courses in the delta and alpha range lead to higher cross-frequency correlations. We note that this might not necessarily reflect true coupling, but rather captures nonlinear signal characteristics, which were informative for subsequent analyses of electrophysiological data.
Cortical Sources of Alpha and Delta Signatures.
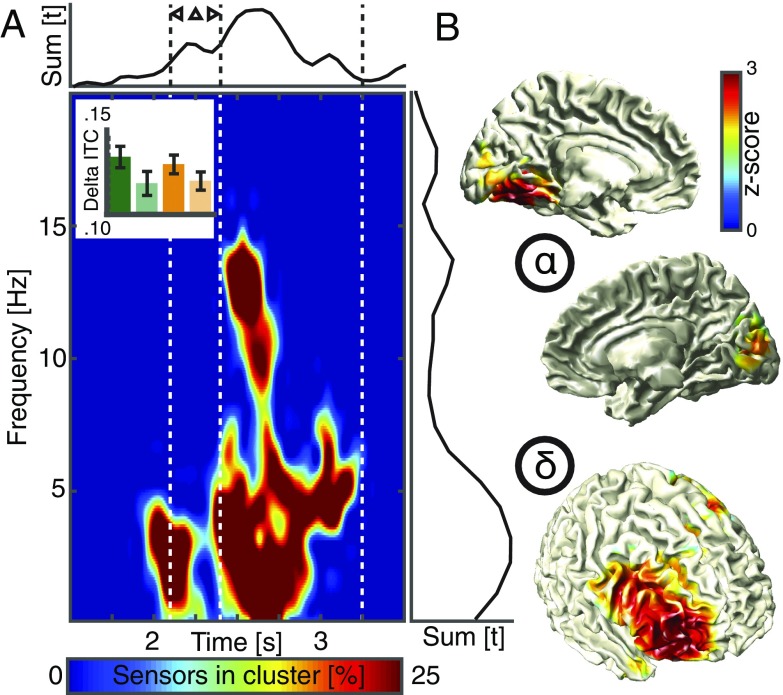
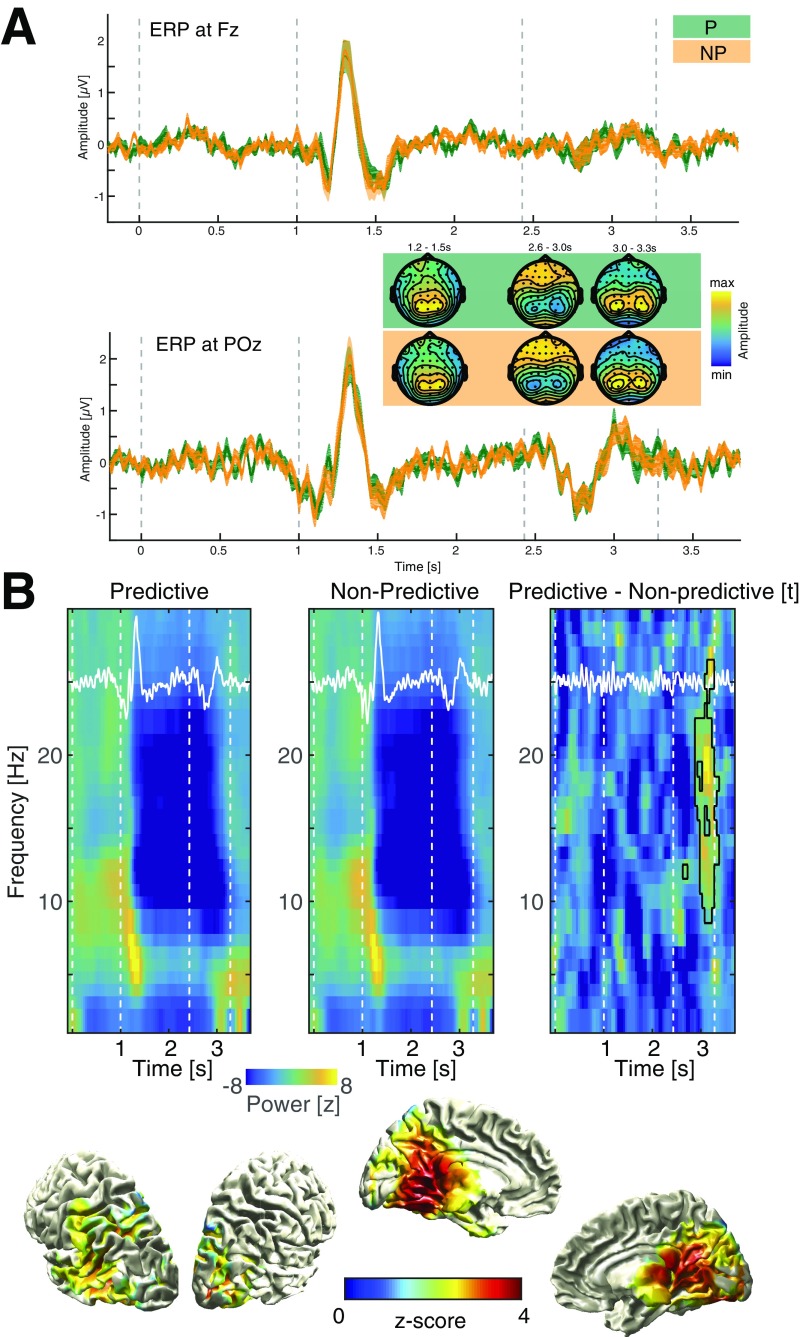
To quantify the EEG correlates of the behavioral effects, we used time–frequency analysis and first focused on phase-dependent metrics. Since we only observed a main effect of predictive context in the behavioral metrics, we pooled rhythmic and arrhythmic trials to assess the intertrial phase coherence between predictive and nonpredictive contexts (Fig. 3A and Fig. S3; Insets depicts all four conditions). A cluster-based permutation test revealed a large cluster spanning several channels and time–frequency pairs (Fig. 3A; P < 0.001). The significant cluster started to emerge around the onset of the predictive sequence and was present during the entire target period, with two spectral peaks at 3–4 Hz and around 8–14 Hz. The delta effect emerged from prefrontal areas centered around the right middle frontal gyrus, while the alpha source was found in ventromedial occipital areas, overlapping with regions that responded most strongly to the flicker stimulus (Fig. 3 B and C and Fig. S3 B–D). This phase effect was not accompanied by differences in the event-related potentials or spectral power (Fig. S4 A and B). Taken together, the electrophysiological findings do not support model 1 (alpha suppression), but support the idea that multiple, possibly interacting rhythms are present during top-down processing.
Fig. 3.
Spectral signatures and cortical sources. (A) A cluster-based permutation test comparing the intertrial coherence between predicted and nonpredicted contexts revealed a large cluster spanning several spatiotemporal scales. (Lower Left) The percentage of sensors that is part of the cluster at any given time and frequency point. (Upper Right) The sum of t values in the cluster across all significant time points (Right) or frequency points (Upper) across all sensors. The Inset depicts all four conditions (same conventions as in Figs. 1F and 2D) and highlights that only a main effect of prediction, but no interaction, was observed. (B) Statistical maps (masked at cluster-corrected P < 0.05) comparing the source reconstructed intertrial coherence values between predicted and nonpredicted contexts localized the low-frequency effect to the right middle frontal gyrus, while the effect in the alpha-band emerged from ventromedial parietoocciptal areas.
Fig. S3.
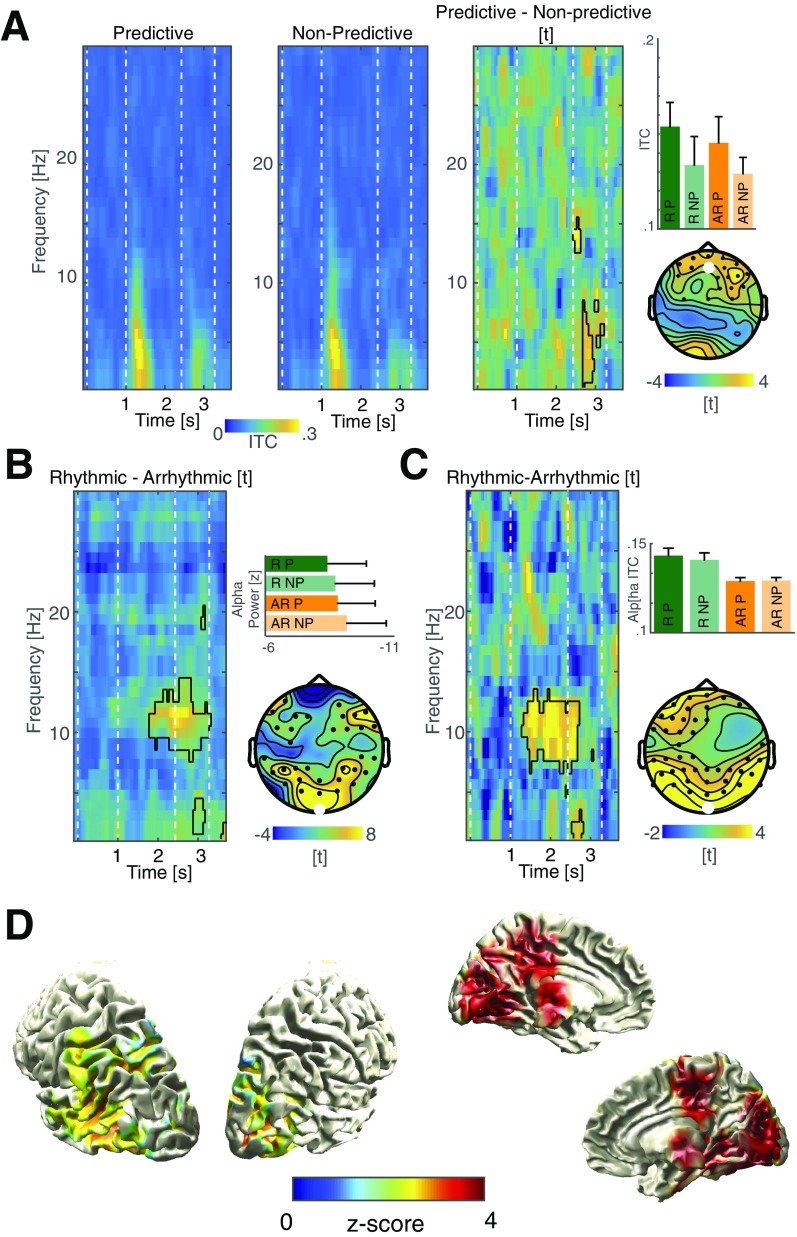
Spectral signatures of predictive contexts and rhythmic stimulus presentation. (A) Grand-average intertrial coherence spectrograms for the predictive and the nonpredictive conditions across the whole trial time and the 1- to 30-Hz range at electrode Fz (Left and Middle). The most prominent ITC effect was due to the onset event-related potential (ERP) of the flicker stimulus, while the difference in ITC was observed during the target period (black outlines superimposed on t map; Right). This effect had a frontal topography that was slightly lateralized to the right. This was consistent with the source-reconstructed effect in the right middle frontal gyrus (Fig. 3). This effect was present for both predictive conditions, independent of rhythmicity. (B) Statistical comparison between the power of rhythmic and arrhythmic conditions at electrode Oz (collapsed across different contexts). We observed an increase in alpha power (8–14 Hz) over posterior areas (cluster-based permutation test; P = 0.0020) that outlasted stimulation offset. The bars indicate the distribution of this effect across all four conditions. The topography displays the spatial extent of the observed effect (electrode Oz is highlighted white). (C) Statistical comparison between the intertrial coherence of the rhythmic and arrhythmic condition (collapsed across different contexts, same conventions as in B). We also found increased alpha-band (7–13 Hz) phase coherence during the rhythmic stimulus train mainly over parietooccipital EEG sensors (P = 0.0020; Fig. 4D). (D) Statistical comparison of the alpha ITC in source space between the rhythmic and arrhythmic conditions revealed that medial and lateral parietooccipital areas where most strongly entrained by the rhythmic flicker stimulus in the alpha band (masked at cluster-corrected P < 0.05). Note that the areas on the medial surface (Right) overlap with the regions that exhibited significant alpha modulations in response to the predictive context (Figs. 3B and 4A). Hence, we assume that the cortical alpha generators that were modulated during top-down visual processing are the same that became entrained by the rhythmic stimulus train.
Fig. S4.
Event-related potentials and power differences between conditions. (A) Grand-average event related potentials for the predictive (green) and the nonpredictive (orange) conditions at Fz (Upper) and POz (Lower). Insets depict topographies at three time points where prominent deflections are visible. Please note that all topographies were scaled to the minimum and maximum in the respective time frame. We assessed differences between ERPs by means of cluster-based permutation statistics as implemented in FieldTrip, but found no significant differences (smallest p for a positive cluster P = 0.1299; smallest p for a negative cluster P = 0.1618). (B) Grand-average power differences (baseline corrected by means of z score). The event-related potential (ERP) is rescaled and superimposed in white. Note the prominent power decrease in the alpha/beta range in response to the visual input. We observed a strong decrease in oscillatory power in the alpha/beta range during the presentation of the sequence, which did not differ between conditions. However, we found a positive cluster (P = 0.0040) spanning the alpha/beta range (9–26 Hz) in the second half of the target interval (after 2.75 s into the trial), indicating a diminished reduction in power during predictive trials (see also Fig. S3B). Notably, this effect appeared after the alpha ITC effect (Fig. 3), which was present earlier in the trial (2.4–2.7 s). The Lower row highlights the spatial distribution in source space of this broadband effect (dpss multitaper in fieldtrip; center frequency 18 Hz ± 8 Hz; 2.75–3.4 s, masked at cluster-corrected P < 0.05; two tailed).
Prefrontal-Dependent Modulation of Parietooccipital Alpha Activity.
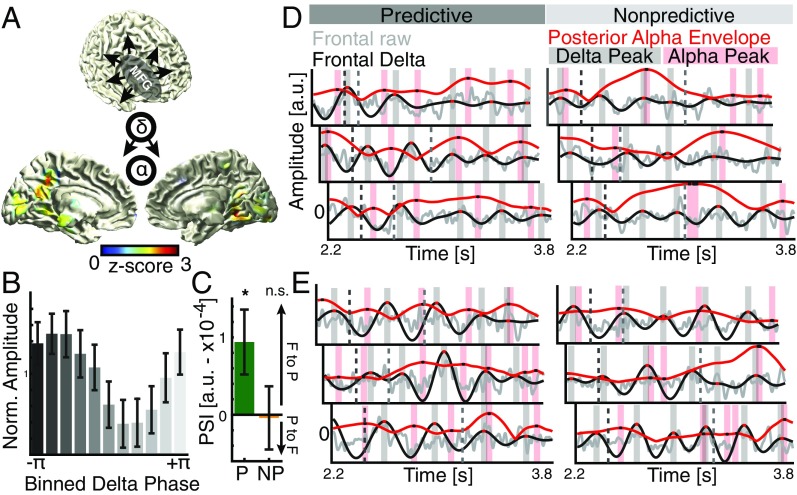
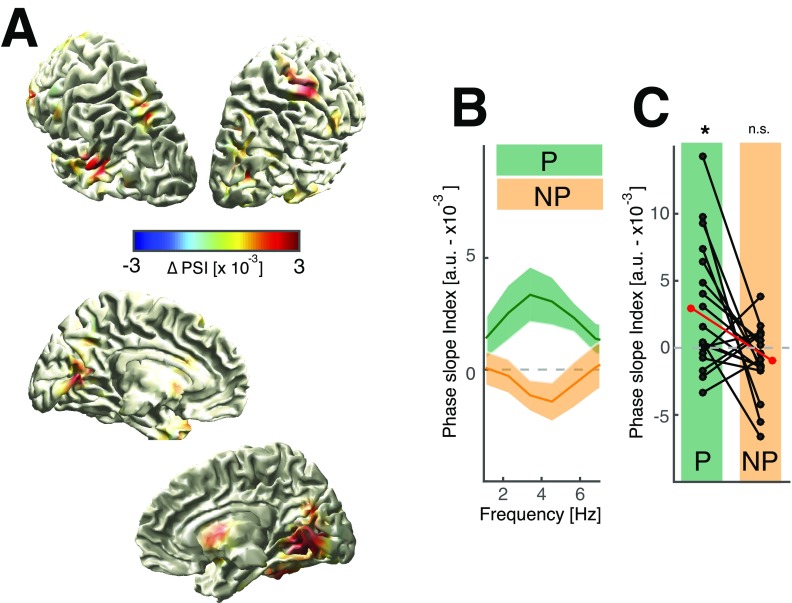
Therefore, we assessed how the frontal delta signature and the posterior alpha effect might be functionally related. First, we defined a seed region in the right middle frontal gyrus and calculated whole brain interareal phase-locking values between the frontal delta phase and the instantaneous phase of the alpha envelope separately for the predictive and the nonpredictive conditions (29). We found the strongest conditional difference over medial parietooccipital areas (Fig. 4A). Posterior alpha amplitudes were higher during the trough of the frontal delta (Fig. 4B). Next, we quantified the directionality of this effect, i.e., whether frontal delta leads or lags the posterior alpha envelope [phase slope index (PSI)] (30). We found an increased PSI for directional delta–alpha correlations for predictive (Fig. 4C and Fig. S5; t17 = 2.18, P = 0.0438, d = 0.7260), but not for nonpredictive trials (t17 = −0.10, P = 0.9236, d = −0.0324). This finding indicates that the frontal delta phase only predicted the posterior alpha amplitude during top-down processing using predictive information. Visual inspection of single trials indicated alpha envelope peaks coincide more regularly with delta troughs for predictive contexts but not for the nonpredictive condition (Fig. 4 D and E). This pattern mimicked the delta–alpha interaction as observed in behavioral time courses and strongly supports the idea that cognitive processing operates in a rhythmic mode in accordance with model 3 (Fig. 1B).
Fig. 4.
Interareal cross-frequency connectivity and directionality. (A) Whole brain cross-frequency correlations (delta–alpha phase-locking values) to a seed in the middle frontal gyrus comparing predicted and nonpredicted contexts (thresholded at P < 0.05; uncorrected paired t tests, one tailed). The strongest difference was observed over ventromedial parietooccipital areas. (B) Distribution of normalized alpha power in the 20% most significant voxels relative to the frontal delta phase. (C) Cross-frequency directionality analyses (PSI), indicating that the frontal delta phase predicts the instantaneous alpha amplitude only when top-down control was applied (Fig. S5). (D) Single trial examples from one subject. (Left) Predictive trials; (Right) nonpredictive trials. The dark dashed line indicates the offset of the predictive sequence; the gray dashed line indicates the target onset. Gray, raw signal in source space; black, delta filtered; red, rescaled alpha envelope. Red and black shaded areas and dots indicate the local peaks. Note the endogenous response to the predictive sequence (Left). On average, local alpha peaks (black dots on red trace) coincide with troughs of the delta rhythm (black trace) and vice versa (interleaved patterning of black and red after offset of the predictive sequence). This effect is most pronounced before target presentation (light gray dashed line). For nonpredictive trials (Right), there is no visible relationship between the delta signal and the alpha envelope. (E) Single trial examples from another participant. Same conventions as in D are shown.
Fig. S5.
Directional delta–alpha connectivity. (A) Spatial distribution of the phase slope difference (predictive − nonpredictive contexts) in source space (masked at 90th percentile). The PSI was calculated between the frontal delta effect in right middle frontal gyrus and the alpha envelope at every other voxel in source space. The strongest effect was observed in ventromedial occipital areas. (B) The spectral distribution of the PSI highlights that the effect was frequency specific and confined to the delta range. (C) The PSI indicates a frontal-to-posterior connectivity when above zero, while values below zero indicate no top-down effect in the 2- to 4-Hz range. The red dot indicates the group mean, while the black dots indicate single subjects. Given that we extracted the PSI at the location where the conditional difference was maximized, we only tested whether the PSI was significantly different from zero for both conditions separately to assess a true directional effect. We found that only the predictive context was associated with significantly higher PSI values (t17 = 2.62, P = 0.0179, d = 0.8737), while the nonpredictive context was not significantly different from zero (t17 = −1.57, P = 0.1340, d = −0.5245).
Correlated Delta–Alpha Signatures Mediate Top-Down Control.
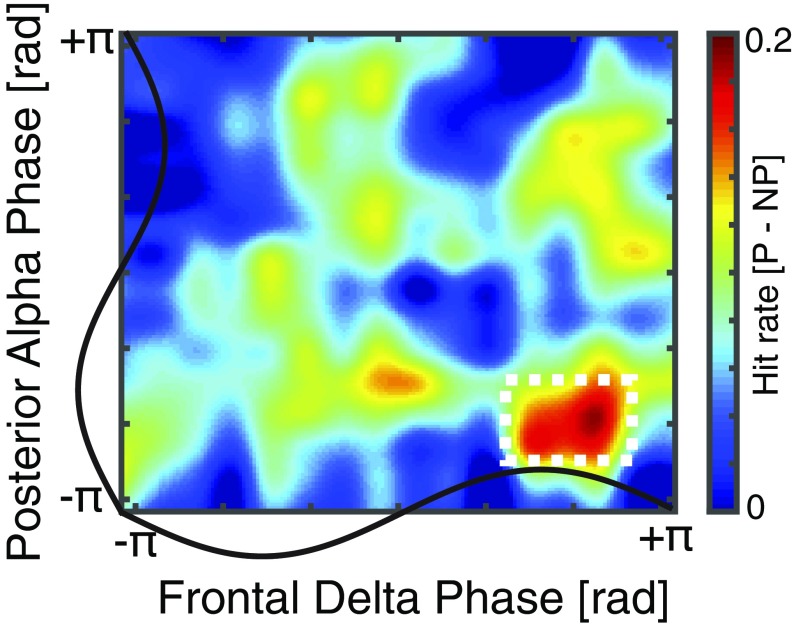
We assessed the behavioral relevance of the observed delta and alpha signatures. Previous studies demonstrated that visual detection performance is enhanced in states of low alpha power and at the trough of the alpha oscillation (3, 4, 8). We calculated the hit rate separately for predictive and nonpredictive contexts as a function of the instantaneous frontal delta phase and the instantaneous posterior alpha phase at target onset (13) and compared the phase resolved hit rates by means of cluster-based permutation test. We found that hit rates were higher during the trough of the alpha and the peak of the frontal delta for the predictive over the nonpredictive condition (P = 0.0030, d = 1.0005; Fig. 5). This provides evidence that the PFC-mediated decrease of the posterior alpha power (Fig. 4) has direct behavioral relevance.
Fig. 5.
Behavioral relevance of coupled delta and alpha signatures. The hit rate difference between predicted and nonpredicted contexts is displayed as a function of the frontal delta phase and the posterior alpha phase. Note that behavioral performance is increased during the peak of the frontal delta phase, which results in lower posterior alpha power (Fig. 4B). In addition, target detection also depends on the alpha phase and is higher during the trough of the posterior alpha rhythm.
Discussion
The current study presents converging behavioral and electrophysiological evidence for delta-mediated top-down control of posterior alpha activity in visual perception. The behaviorally relevant delta rhythm originated from prefrontal cortical areas during predictive context-dependent top-down processing and was directly visible in spectrally resolved behavioral time courses. Notably, bottom-up sensory entrainment enhanced perceptual alpha sampling only when no predictive context was present (Fig. 1 E and F). These findings indicate that delta-mediated top-down control governs posterior alpha activity independent of exogenous interference (Fig. 2D). We did not observe an interaction of prediction and rhythmic stimulation, which implies a functional separation of top-down and bottom-up systems supporting visual perception.
Our results are in accordance with previous lesion studies, which indicated that high-level visual perception is PFC dependent (27, 31), as well as reports suggesting that long-range endogenous delta activity may constitute a neural correlate of directed top-down control (15). For example, Johnson et al. (31) reported that prefrontal damage diminished long-range top-down control that was associated with oscillatory activity in the delta–theta range (2–7 Hz).
Our findings support the idea that the rich spatiotemporal structure of neuronal activity reflects a functional architecture where distinct frequency bands dynamically support different aspects of visual processing (1, 2).
The Rhythmic Nature of Cognition.
It has been argued that low-frequency neuronal oscillations might reflect a cortical mechanism for sensory selection, attentional allocation, and evidence updating during decision making (9, 11, 13, 14, 32). If the underlying functional brain architecture is inherently rhythmic, then we should be able to observe rhythmic patterns in behavior. This has been recently demonstrated for visual perception (4, 5) as well as for high-level attention (16–18). Furthermore, neuronal oscillations have been suggested to facilitate sensory predictions and temporal expectations (15, 33). For example, anticipatory alpha modulations were observed during top-down processing (24), but it remained unclear how top-down control is mediated (2). Inspection of single trials indicated that the endogenous delta signature was not strictly sinusoidal, but it exhibited low-frequency characteristics (3–4 cycles per second), which modulated the instantaneous posterior alpha power as well as the perceptual cycles. The overall best performance was achieved when the target was presented during the peak of the frontal delta, which in turn down-regulated the posterior alpha amplitude facilitating visual perception (4).
Notably, this low-frequency response was not confounded by rhythmic sensory delta entrainment and reflects an endogenous cue-guided response (15, 34). Previous studies in the auditory domain had localized the origin of the low-frequency activity to sensory areas and not frontal regions (13, 14, 35) but were confounded by the presentation rate, which likely evoked activity (14, 35, 36). Given that exogenous stimulation induces a strong phase alignment (Fig. S3 B and C), we speculate that this could have masked frontal contributions (36, 37). Our findings are also in line with the proposal that the absolute voltage gradient might be a better predictor of instantaneous cortical excitability than power or phase information of band-limited signals (38). We speculate that the observed delta signatures might reflect slow cortical potentials, which could be functionally similar to up and down states. These observations highlight the need for single trial analyses to better understand the dynamic time course of human cognition (39). We sampled behavioral performance over 850 ms, which does not allow assessing fluctuations below 2 Hz; hence, we speculate that exact frequency might be influenced by the experimental timing (17, 18).
The Functional Interaction of Different Time Scales in the Human Brain.
Brain activity is inherently rhythmic and spans several temporal scales. The concept of CFC has been proposed as one solution for information integration across several spatiotemporal scales (20). Recently, it has been argued that several methodological limitations and nonsinusoidal signal characteristics might give rise to spurious CFC (21–23), in particular, when the CFC metric is derived from only one signal (e.g., the behavioral time course in Fig. 2) or accompanied by spectral power differences (23). Here, we observed power decreases that were associated with stronger correlations, which is less of a concern than simultaneous power and cross-frequency correlation increments (21–23). We argue that cross-frequency correlations of a single time series provides valuable information about the nonlinear characteristics of the underlying signal, which might otherwise not be captured (21). Using this approach enabled us to disentangle the role of delta and alpha signatures in visual perception. We identified the same spectral signatures in behavior and in a frontal–parietal–occipital network. While the observed effects are correlative in nature, we believe that the use of nonlinear cross-frequency correlation analyses provides a tool to capture complex neural dynamics underlying goal-directed behavior (21).
Confounds and Limitations.
Frequency analyses assume stationarity, which is often violated by neuronal time courses (Fig. 4 D and E). Hence, time–frequency representations rely on short windows where stationary signals can be assumed. Visual inspection of Fig. 4 D and E indicated that a 500 ms was a reasonable window to capture the short-lasted delta effect with three to four cycles. Behavior was probed at ≈30 Hz. Thus, we could only resolve rhythmic fluctuations of up to 15 Hz and the observed signal modulation at >10 Hz could in theory also constitute a broad-band shift (19) or be the result of sharp transients in the discretely sampled signal (40). Notably, we observed a similar peak in the intertrial coherence (ITC) spectra, which suggests a circumscribed effect in the high alpha range and previous reports have indicated that delta-to-beta coupling might underlie temporal prediction accuracy (41). However, these limitations equally apply to all four experimental conditions. Taken together, the presented evidence is correlative in nature and the limited spatial resolution of noninvasive EEG hampers strong neuroanatomical inferences. However, we used beamforming techniques to reconstruct source level activity and observed a clear delineation of frontal and posterior clusters. Notably, the frontal delta signature was lateralized to the right in accord with clinical observations of a right hemispheric lateralization for attention (hemispatial neglect syndrome) (42). Invasive imaging techniques with better spatiotemporal resolution that have access to frontal areas, such as electrocorticography, might allow a better spatial characterization of the observed delta signatures (37). In the future, lesion (31) or brain stimulation (28) approaches would help to establish a causal relationship between slow oscillations and top-down control.
Conclusions
In summary, our results demonstrate that temporally coordinated delta and alpha activity subserves conscious visual perception and top-down processing. In particular, we demonstrated that top-down processing is associated with delta-mediated long-range control of posterior alpha oscillations facilitating visual perception. Our results show that the functional cortical architecture is profoundly rhythmic, but not necessarily sinusoidal (21). The findings support the concept of multiplexing of different cortical functions across several temporal scales to enable efficient multisite communication in the brain (1). Disturbances in large-scale network communication and low-frequency phase concentration have previously been implicated in several neuropsychiatric disorders, such as schizophrenia (43). In the future, a better understanding of large-scale network impairments might offer the possibility to individually tailor therapeutic interventions by means of frequency-specific noninvasive brain stimulation (28).
Materials and Methods
Participants.
Twenty healthy volunteers (7 female, 13 male, mean age: 20.40 ± 2.28 y, mean ± SD) were recruited from the University of California, Berkeley and were financially compensated for their participation. All participants gave written informed consent according to the local ethics committee (Berkeley Committee for Protection of Human Subjects Protocol No. 2010–02-783) and the Declaration of Helsinki. They all had normal or corrected-to-normal vision.
Stimuli, Procedure, and Data Analysis.
Detailed information can be found in SI Materials and Methods.
SI Materials and Methods
Stimuli and Procedure.
The visual stimuli were generated with the Psychophysics Toolbox (44) implemented in MatLab 2012b (The MathWorks, Inc.) and presented on a ViewSonic P220f screen (1,280 × 1,024, 60 Hz). During the experiment, the participants’ head was rested on a chinrest 80 cm away from the screen (Fig. 1A). The task was completed in fully balanced 2 × 2 design (rhythmic × predictive) and 200 fully randomized trials per condition were recorded; 20% of trials were catch trials where no target was presented. Every experimental session started with 20 practice trials with above-detection threshold targets to familiarize the subjects with the task. In a second step, the subjects performed 40 trials where we estimated the subjects’ perceptual threshold and titrated the target luminance to achieve an overall hit rate of 70%.
At the beginning of each trial the central fixation cross was highlighted for 200 ms to indicate the start of a new trial. After a baseline interval of 800 ms, a stimulus train consisting of 14 flashing triangles either facing left, up, or rightwards was presented against a black screen. Note, the presentation was pseudorandom, so that the predictive sequence (left, up, right) only occurred at the end of the sequence in half of all trials. Horizontal and vertical stimulus dimensions were 3° visual angle. Each flash lasted for 17 ms (one frame refresh rate of the monitor) and was followed either by an 83-ms interstimulus interval (ISI) to create the 10-Hz condition or at a pseudorandom integer multiple of 17 ms to create the arrhythmic control condition. Importantly, there was always at least one blank frame between two flashes. In addition, the presentation times for first and the last item of the stimulus sequence were fixed to keep the overall trial time equal and to account for effects such as forward masking. After a variable delay of 34–850 ms (in steps of 34 ms, 25 bins), a close-to-threshold target was presented (downward facing triangle) in 80% of the trials. Participants were instructed to indicate by button presses whether they saw the target or not (forced choice). Furthermore, subjects rated their subjective confidence by a postdecision wager indicating either high or low confidence and received immediate feedback.
Therefore, we used the Bayesian QUEST (45) procedure to adjust the target contrast such that the desired performance was achieved. Subsequently, the participants performed four blocks consisting of 200 trials each. After the second block, we repeated the threshold procedure to account for habituation or fatigue effects. The average red, green, blue (RGB) threshold did not differ between the blocks (t17 = −0.08, P = 0.9377, d = −0.0250) and was 43.80 ± 9.79 (mean ± SEM) during the first two blocks and 44.00 ± 9.84 during the last two blocks. These thresholds were highly correlated on an individual level (Spearman correlation: r = 0.7971, P = 0.0003).
EEG Data Acquisition.
EEG was recorded from 64 active electrodes (Biosemi). In addition, 3 electrodes were used to monitor horizontal and vertical eye movements. Signals were amplified and digitized at 1,024 Hz and stored for offline analysis.
Data Analyses.
All of the data were analyzed in Matlab R2016a, using the FieldTrip toolbox (46), the CircStat toolbox (47), and custom-written scripts.
Behavioral data.
Two subjects were excluded from further analyses based on their behavioral performance. One subject had a high number of invalid button presses (in 28.3% of all trials) and one only indicated high confidence in <10% of all trials (<<2.5 SD below group mean). In addition, on an individual level, we excluded all of the trials with missing button presses as well as trials with reaction times (RTs) that were outside the median RT ± 2.5 SD. We then calculated the average behavioral performance for every phase bin and subject separately.
For spectral analyses of the behavioral data, the time courses were tapered with a Hanning window and transformed into frequency space using the mtmfft method in FieldTrip. To increase frequency resolution, we up-sampled the data by a factor of 2 through linear interpolation before cross-frequency correlation (CFC) analyses, which were calculated after band-pass filtering and applying a Hilbert transform to extract the instantaneous analytic amplitude and phase. We used the CircStat toolbox to compute circular correlations. We used the following parameters for the comodulogram analyses: frequency for phase: 2–7 Hz in 0.25-Hz steps, ±1-Hz window; frequency for amplitude 8–15 Hz in 0.5-Hz steps, ±2-Hz window.
EEG data.
The data were offline rereferenced to average linked earlobes, demeaned, detrended, and filtered in the range from 1–35 Hz using Butterworth filters as implemented in Fieldtrip with default settings. The data were then visually inspected for artifacts and excessively noisy epochs and sensors were removed. Removed channels were interpolated by a spherical spline interpolation. Then the data were submitted to an independent component analysis (48). We excluded components that resembled muscle, heartbeat, or eye movement artifacts in accordance with a recently described procedure (49). Finally, the data were epoched into 4.5-s-long segments, starting 0.5 s before trial onset.
Spectral estimates were computed by means of a sliding Hanning window (1–35 Hz, 1-Hz steps, 500-ms window) in steps of 50 ms and z scored relative to a bootstrapped baseline period (−200 ms to trial onset). Intertrial phase coherence was calculated from the respective Fourier spectrum. To extract the instantaneous analytic amplitude and phase, we band-pass filtered the data and applied a Hilbert transform.
Source space analyses.
Cortical sources of the sensor-level EEG data were reconstructed by using two different beamforming approaches. Dynamic imaging of coherent sources (DICS) beamforming (50) in the frequency domain was used to identify the spatial distribution of sensor-level effects, while linearly constraint minimum variance (LCMV) beamforming (51) was used to estimate the time series for every voxel on the grid, which were used for directed and undirected connectivity analyses. A standard T1 MRI template and a boundary element method headmodel from the Fieldtrip toolbox were used to construct a 3D template grid at 1-cm spacing in Montreal Neurological Institute template space. Before source projection, sensor level data were common average referenced. Spatial filters were constructed for each of the grid positions separately to maximally suppress activity from all other sources. The DICS spatial filter was constructed using the leadfield and the cross-spectral density matrix. The filter was applied to Fourier-transformed data to estimate power and ITC at source level. To optimize the time–frequency tradeoff, we used discrete prolate spheroidal sequence (dpss) multitapers (52) for source space analyses. To obtain a time course for every trial at every voxel, we used the LCMV beamforming approach using the covariance matrix of the sensor-level EEG data with 5% regularization. We used the Automated Anatomical Labeling (AAL) atlas as implemented in Fieldtrip to identify regions at source level.
Interareal connectivity.
We assessed the interareal cross-frequency correlation analyses by means of the phase-locking value technique (29). The directionality of this effect was assessed using the phase slope index as described recently (30). To extract delta and alpha amplitude and phase series, the data were filtered using standard Butterworth filters as implemented in Fieldtrip. We then used the Hilbert transform to extract the instantaneous phase and amplitude series.
To calculate hit rates, a function of the delta and alpha phase (Fig. 5), we band-pass filtered the trial in the delta (2–4 Hz) and alpha (8–12 Hz) range and extracted the instantaneous phase and amplitude at target onset. We used electrode Fz as a seed region for the delta phase. The alpha phase was separately determined for electrodes Pz, POz, and Oz, according to the international 10–20 EEG electrode positioning system. We binned the phase from –pi-to-pi in 16 linearly spaced bins. Given that some bins had more underlying data points than others, we spatially smoothed every data point in the resulting matrix with its adjacent neighbors. Finally, we averaged across the resulting matrices across the three posterior electrodes and up-sampled the resulting matrix by cubic interpolation by a factor of 10 for display purposes only.
Statistical Analyses.
Behavior.
We used repeated measures ANOVAs and paired t tests to assess the behavioral effects. To control for multiple comparisons in the frequency domain, we used cluster-based randomization tests (53) as implemented in FieldTrip (MonteCarlo method, 10,000 iterations for behavioral data; 1,000 iterations for EEG data, cluster alpha P < 0.05, maxsum criterion). Identified clusters were considered significant at P < 0.05 (two tailed unless stated otherwise). The effect size was quantified by Cohen’s d or η2. Circular–circular cross-frequency correlations were calculated using the CircStat toolbox.
EEG.
We used the same approach to statistically quantify the EEG data. We used nonparametric cluster-based permutation tests to assess conditional differences in sensor and source space.
Acknowledgments
We thank Assaf Breska and Lisa and Keith G. Johnson. This work was supported by National Institute of Neurological Disorders and Stroke Grant R37NS21135 (to R.T.K.), the Nielsen Corporation (R.T.K.), an intramural research grant from the Department of Psychology, University of Oslo, and the Alexander von Humboldt Foundation (Feodor Lynen Program) (R.F.H.).
Footnotes
The authors declare no conflict of interest.
This article is a PNAS Direct Submission.
This article contains supporting information online at www.pnas.org/lookup/suppl/doi:10.1073/pnas.1705965114/-/DCSupplemental.
References
- 1.Siegel M, Donner TH, Engel AK. Spectral fingerprints of large-scale neuronal interactions. Nat Rev Neurosci. 2012;13:121–134. doi: 10.1038/nrn3137. [DOI] [PubMed] [Google Scholar]
- 2.Helfrich RF, Knight RT. Oscillatory dynamics of prefrontal cognitive control. Trends Cogn Sci. 2016;20:916–930. doi: 10.1016/j.tics.2016.09.007. [DOI] [PMC free article] [PubMed] [Google Scholar]
- 3.Busch NA, Dubois J, VanRullen R. The phase of ongoing EEG oscillations predicts visual perception. J Neurosci. 2009;29:7869–7876. doi: 10.1523/JNEUROSCI.0113-09.2009. [DOI] [PMC free article] [PubMed] [Google Scholar]
- 4.Mathewson KE, Gratton G, Fabiani M, Beck DM, Ro T. To see or not to see: Prestimulus alpha phase predicts visual awareness. J Neurosci. 2009;29:2725–2732. doi: 10.1523/JNEUROSCI.3963-08.2009. [DOI] [PMC free article] [PubMed] [Google Scholar]
- 5.Spaak E, de Lange FP, Jensen O. Local entrainment of α oscillations by visual stimuli causes cyclic modulation of perception. J Neurosci. 2014;34:3536–3544. doi: 10.1523/JNEUROSCI.4385-13.2014. [DOI] [PMC free article] [PubMed] [Google Scholar]
- 6.Samaha J, Bauer P, Cimaroli S, Postle BR. Top-down control of the phase of alpha-band oscillations as a mechanism for temporal prediction. Proc Natl Acad Sci USA. 2015;112:8439–8444. doi: 10.1073/pnas.1503686112. [DOI] [PMC free article] [PubMed] [Google Scholar]
- 7.van Diepen RM, Cohen MX, Denys D, Mazaheri A. Attention and temporal expectations modulate power, not phase, of ongoing alpha oscillations. J Cogn Neurosci. 2015;27:1573–1586. doi: 10.1162/jocn_a_00803. [DOI] [PubMed] [Google Scholar]
- 8.Jensen O, Mazaheri A. Shaping functional architecture by oscillatory alpha activity: Gating by inhibition. Front Hum Neurosci. 2010;4:186. doi: 10.3389/fnhum.2010.00186. [DOI] [PMC free article] [PubMed] [Google Scholar]
- 9.Schroeder CE, Lakatos P. Low-frequency neuronal oscillations as instruments of sensory selection. Trends Neurosci. 2009;32:9–18. doi: 10.1016/j.tins.2008.09.012. [DOI] [PMC free article] [PubMed] [Google Scholar]
- 10.Szczepanski SM, et al. Dynamic changes in phase-amplitude coupling facilitate spatial attention control in fronto-parietal cortex. PLoS Biol. 2014;12:e1001936. doi: 10.1371/journal.pbio.1001936. [DOI] [PMC free article] [PubMed] [Google Scholar]
- 11.Calderone DJ, Lakatos P, Butler PD, Castellanos FX. Entrainment of neural oscillations as a modifiable substrate of attention. Trends Cogn Sci. 2014;18:300–309. doi: 10.1016/j.tics.2014.02.005. [DOI] [PMC free article] [PubMed] [Google Scholar]
- 12.Lakatos P, Karmos G, Mehta AD, Ulbert I, Schroeder CE. Entrainment of neuronal oscillations as a mechanism of attentional selection. Science. 2008;320:110–113. doi: 10.1126/science.1154735. [DOI] [PubMed] [Google Scholar]
- 13.Henry MJ, Herrmann B, Obleser J. Entrained neural oscillations in multiple frequency bands comodulate behavior. Proc Natl Acad Sci USA. 2014;111:14935–14940. doi: 10.1073/pnas.1408741111. [DOI] [PMC free article] [PubMed] [Google Scholar]
- 14.Wöstmann M, Herrmann B, Maess B, Obleser J. Spatiotemporal dynamics of auditory attention synchronize with speech. Proc Natl Acad Sci USA. 2016;113:3873–3878. doi: 10.1073/pnas.1523357113. [DOI] [PMC free article] [PubMed] [Google Scholar]
- 15.Breska A, Deouell LY. Neural mechanisms of rhythm-based temporal prediction: Delta phase-locking reflects temporal predictability but not rhythmic entrainment. PLoS Biol. 2017;15:e2001665. doi: 10.1371/journal.pbio.2001665. [DOI] [PMC free article] [PubMed] [Google Scholar]
- 16.Landau AN, Fries P. Attention samples stimuli rhythmically. Curr Biol. 2012;22:1000–1004. doi: 10.1016/j.cub.2012.03.054. [DOI] [PubMed] [Google Scholar]
- 17.Fiebelkorn IC, Saalmann YB, Kastner S. Rhythmic sampling within and between objects despite sustained attention at a cued location. Curr Biol. 2013;23:2553–2558. doi: 10.1016/j.cub.2013.10.063. [DOI] [PMC free article] [PubMed] [Google Scholar]
- 18.Song K, Meng M, Chen L, Zhou K, Luo H. Behavioral oscillations in attention: Rhythmic α pulses mediated through θ band. J Neurosci. 2014;34:4837–4844. doi: 10.1523/JNEUROSCI.4856-13.2014. [DOI] [PMC free article] [PubMed] [Google Scholar]
- 19.Zoefel B, Sokoliuk R. Investigating the rhythm of attention on a fine-grained scale: Evidence from reaction times. J Neurosci. 2014;34:12619–12621. doi: 10.1523/JNEUROSCI.2134-14.2014. [DOI] [PMC free article] [PubMed] [Google Scholar]
- 20.Canolty RT, Knight RT. The functional role of cross-frequency coupling. Trends Cogn Sci. 2010;14:506–515. doi: 10.1016/j.tics.2010.09.001. [DOI] [PMC free article] [PubMed] [Google Scholar]
- 21.Cole SR, Voytek B. Brain oscillations and the importance of waveform shape. Trends Cogn Sci. 2017;21:137–149. doi: 10.1016/j.tics.2016.12.008. [DOI] [PubMed] [Google Scholar]
- 22.Gerber EM, Sadeh B, Ward A, Knight RT, Deouell LY. Non-sinusoidal activity can produce cross-frequency coupling in cortical signals in the absence of functional interaction between neural sources. PLoS One. 2016;11:e0167351. doi: 10.1371/journal.pone.0167351. [DOI] [PMC free article] [PubMed] [Google Scholar]
- 23.Aru J, et al. Untangling cross-frequency coupling in neuroscience. Curr Opin Neurobiol. 2015;31:51–61. doi: 10.1016/j.conb.2014.08.002. [DOI] [PubMed] [Google Scholar]
- 24.Rohenkohl G, Nobre AC. α oscillations related to anticipatory attention follow temporal expectations. J Neurosci. 2011;31:14076–14084. doi: 10.1523/JNEUROSCI.3387-11.2011. [DOI] [PMC free article] [PubMed] [Google Scholar]
- 25.Marshall TR, Bergmann TO, Jensen O. Frontoparietal structural connectivity mediates the top-down control of neuronal synchronization associated with selective attention. PLoS Biol. 2015;13:e1002272. doi: 10.1371/journal.pbio.1002272. [DOI] [PMC free article] [PubMed] [Google Scholar]
- 26.VanRullen R. Perceptual cycles. Trends Cogn Sci. 2016;20:723–735. doi: 10.1016/j.tics.2016.07.006. [DOI] [PubMed] [Google Scholar]
- 27.Fogelson N, Shah M, Scabini D, Knight RT. Prefrontal cortex is critical for contextual processing: Evidence from brain lesions. Brain. 2009;132:3002–3010. doi: 10.1093/brain/awp230. [DOI] [PMC free article] [PubMed] [Google Scholar]
- 28.Thut G, Schyns PG, Gross J. Entrainment of perceptually relevant brain oscillations by non-invasive rhythmic stimulation of the human brain. Front Psychol. 2011;2:170. doi: 10.3389/fpsyg.2011.00170. [DOI] [PMC free article] [PubMed] [Google Scholar]
- 29.Helfrich RF, Herrmann CS, Engel AK, Schneider TR. Different coupling modes mediate cortical cross-frequency interactions. Neuroimage. 2016;140:76–82. doi: 10.1016/j.neuroimage.2015.11.035. [DOI] [PubMed] [Google Scholar]
- 30.Jiang H, Bahramisharif A, van Gerven MAJ, Jensen O. Measuring directionality between neuronal oscillations of different frequencies. Neuroimage. 2015;118:359–367. doi: 10.1016/j.neuroimage.2015.05.044. [DOI] [PubMed] [Google Scholar]
- 31.Johnson EL, et al. Bidirectional frontoparietal oscillatory systems support working memory. Curr Biol. 2017;27:1829–1835.e4. doi: 10.1016/j.cub.2017.05.046. [DOI] [PMC free article] [PubMed] [Google Scholar]
- 32.Wyart V, de Gardelle V, Scholl J, Summerfield C. Rhythmic fluctuations in evidence accumulation during decision making in the human brain. Neuron. 2012;76:847–858. doi: 10.1016/j.neuron.2012.09.015. [DOI] [PMC free article] [PubMed] [Google Scholar]
- 33.Wiener M, Kanai R. Frequency tuning for temporal perception and prediction. Curr Opin Behav Sci. 2016;8:1–6. [Google Scholar]
- 34.Tort ABL, et al. Dynamic cross-frequency couplings of local field potential oscillations in rat striatum and hippocampus during performance of a T-maze task. Proc Natl Acad Sci USA. 2008;105:20517–20522. doi: 10.1073/pnas.0810524105. [DOI] [PMC free article] [PubMed] [Google Scholar]
- 35.Kayser SJ, Ince RAA, Gross J, Kayser C. Irregular speech rate dissociates auditory cortical entrainment, evoked responses, and frontal alpha. J Neurosci. 2015;35:14691–14701. doi: 10.1523/JNEUROSCI.2243-15.2015. [DOI] [PMC free article] [PubMed] [Google Scholar]
- 36.Park H, Ince RAA, Schyns PG, Thut G, Gross J. Frontal top-down signals increase coupling of auditory low-frequency oscillations to continuous speech in human listeners. Curr Biol. 2015;25:1649–1653. doi: 10.1016/j.cub.2015.04.049. [DOI] [PMC free article] [PubMed] [Google Scholar]
- 37.Voytek B, et al. Oscillatory dynamics coordinating human frontal networks in support of goal maintenance. Nat Neurosci. 2015;18:1318–1324. doi: 10.1038/nn.4071. [DOI] [PMC free article] [PubMed] [Google Scholar]
- 38.Schalk G, Marple J, Knight RT, Coon WG. Instantaneous voltage as an alternative to power- and phase-based interpretation of oscillatory brain activity. Neuroimage. 2017;157:545–554. doi: 10.1016/j.neuroimage.2017.06.014. [DOI] [PMC free article] [PubMed] [Google Scholar]
- 39.Lundqvist M, et al. Gamma and beta bursts underlie working memory. Neuron. 2016;90:152–164. doi: 10.1016/j.neuron.2016.02.028. [DOI] [PMC free article] [PubMed] [Google Scholar]
- 40.Cole SR, et al. 2016. Nonsinusoidal oscillations underlie pathological phase-amplitude coupling in the motor cortex in Parkinson’s disease. 10.1101/049304.
- 41.Arnal LH, Doelling KB, Poeppel D. Delta-beta coupled oscillations underlie temporal prediction accuracy. Cereb Cortex. 2015;25:3077–3085. doi: 10.1093/cercor/bhu103. [DOI] [PMC free article] [PubMed] [Google Scholar]
- 42.Mesulam MM. A cortical network for directed attention and unilateral neglect. Ann Neurol. 1981;10:309–325. doi: 10.1002/ana.410100402. [DOI] [PubMed] [Google Scholar]
- 43.Lakatos P, Schroeder CE, Leitman DI, Javitt DC. Predictive suppression of cortical excitability and its deficit in schizophrenia. J Neurosci. 2013;33:11692–11702. doi: 10.1523/JNEUROSCI.0010-13.2013. [DOI] [PMC free article] [PubMed] [Google Scholar]
- 44.Brainard DH. The psychophysics toolbox. Spat Vis. 1997;10:433–436. [PubMed] [Google Scholar]
- 45.Watson AB, Pelli DG. QUEST: A Bayesian adaptive psychometric method. Percept Psychophys. 1983;33:113–120. doi: 10.3758/bf03202828. [DOI] [PubMed] [Google Scholar]
- 46.Oostenveld R, Fries P, Maris E, Schoffelen J-M. FieldTrip: Open source software for advanced analysis of MEG, EEG, and invasive electrophysiological data. Comput Intell Neurosci. 2011;2011:156869. doi: 10.1155/2011/156869. [DOI] [PMC free article] [PubMed] [Google Scholar]
- 47.Berens P. CircStat: A MATLAB toolbox for circular statistics. J Stat Softw. 2009;31:21. [Google Scholar]
- 48.Hyvärinen A, Oja E. Independent component analysis: Algorithms and applications. Neural Netw. 2000;13:411–430. doi: 10.1016/s0893-6080(00)00026-5. [DOI] [PubMed] [Google Scholar]
- 49.Hipp JF, Siegel M. Dissociating neuronal gamma-band activity from cranial and ocular muscle activity in EEG. Front Hum Neurosci. 2013;7:338. doi: 10.3389/fnhum.2013.00338. [DOI] [PMC free article] [PubMed] [Google Scholar]
- 50.Gross J, et al. Dynamic imaging of coherent sources: Studying neural interactions in the human brain. Proc Natl Acad Sci USA. 2001;98:694–699. doi: 10.1073/pnas.98.2.694. [DOI] [PMC free article] [PubMed] [Google Scholar]
- 51.Van Veen BD, van Drongelen W, Yuchtman M, Suzuki A. Localization of brain electrical activity via linearly constrained minimum variance spatial filtering. IEEE Trans Biomed Eng. 1997;44:867–880. doi: 10.1109/10.623056. [DOI] [PubMed] [Google Scholar]
- 52.Mitra PP, Pesaran B. Analysis of dynamic brain imaging data. Biophys J. 1999;76:691–708. doi: 10.1016/S0006-3495(99)77236-X. [DOI] [PMC free article] [PubMed] [Google Scholar]
- 53.Maris E, Oostenveld R. Nonparametric statistical testing of EEG- and MEG-data. J Neurosci Methods. 2007;164:177–190. doi: 10.1016/j.jneumeth.2007.03.024. [DOI] [PubMed] [Google Scholar]


