Significance
Little is known about the specific mechanisms by which viruses associated with congenital disease, such as Zika virus (ZIKV), breach the placental barrier to access the fetal compartment. This is at least in part because of the lack of appropriate systems to model the unique properties of human placental syncytiotrophoblasts, which form a key cellular interface between the maternal and fetal compartments. Here, we describe the development of new organotypic models of human syncytiotrophoblasts that can be used to study the innate defense mechanisms used by these cells to restrict ZIKV infection at various stages of human gestation. These models can be used to study the mechanisms of ZIKV vertical transmission, the development of ZIKV diagnostics, and the testing of anti-ZIKV therapeutics.
Keywords: placenta, Zika virus, organotypic models, type III interferon, trophoblast
Abstract
Protecting the fetus from the hematogenous spread of viruses requires multifaceted layers of protection and relies heavily on trophoblasts, the fetal-derived cells that comprise the placental barrier. We showed previously that trophoblasts isolated from full-term placentas resist infection by diverse viruses, including Zika virus (ZIKV), and transfer this resistance to nonplacental cells through the activity of paracrine effectors, including the constitutive release of type III interferons (IFNs). Here, we developed 3D cell-line–based models of human syncytiotrophoblasts, cells that lie in direct contact with maternal blood, and show that these cells recapitulate the antiviral properties of primary trophoblasts through the constitutive release of type III IFNs (IFNλ1 and IFNλ2) and become resistant to ZIKV infection. In addition, using organotypic human midgestation chorionic villous explants, we show that syncytiotrophoblasts isolated from the second trimester of pregnancy also constitutively release type III IFNs and use these IFNs in autocrine and paracrine manners to restrict ZIKV infection. Collectively, these data provide important insights into the defense mechanisms used by syncytiotrophoblasts at various stages of human gestation to resist ZIKV infection and new human models to study the role of type III IFNs in the vertical transmission of ZIKV and other viruses associated with congenital disease.
The human placenta functions as a barrier and conduit between the maternal and fetal environments and protects the fetus from the hematogenous spread of microorganisms (reviewed in ref. 1). Covering the surfaces of the human placental villous trees is the syncytiotrophoblast (SYN), a multinucleated and terminally differentiated cell layer that is formed by the fusion of mononuclear cytotrophoblasts (CYTs) located beneath the outer SYN layer. Modeling the complex nature of the human placenta in vitro has remained a challenge, particularly with respect to viral infections. For example, whereas trophoblast cell lines are permissive to viral infections, primary human trophoblast (PHT) cells isolated from full-term placentas resist infection by diverse viruses (2–4). In addition, PHT cells transfer viral resistance to nonplacental cells through the release of paracrine effectors, including through the constitutive release of type III IFNs, IFNλ1–3, and miRNAs packaged in microvesicles (2–5). Cultured trophoblast cell lines lack these paracrine effector pathways and, in contrast to PHT cells, do not confer paracrine-mediated antiviral effects (3, 4).
Over recent years, Zika virus (ZIKV) infections of pregnant women have been directly associated with microcephaly and other fetal disorders (reviewed in ref. 6). It remains unclear how ZIKV gains access to the fetal compartment or evades SYN-associated antiviral pathways. Recent small-animal models have provided in vivo systems to model fetal ZIKV infection (reviewed in ref. 6). However, mouse models require the absence of important maternal immune pathways or infection with high viral loads, and given differences in cellular composition and anatomy between the mouse and human placentas (reviewed in ref. 7), directly correlating these findings with human transplacental transmission may be difficult. Thus, there remains a critical need to develop new models of the human placenta to study the mechanisms of ZIKV vertical transmission and the cell-intrinsic defense pathways by which SYNs restrict infection to limit fetal infection.
In the present study, we developed 3D cell- and tissue-based models to assess the role of type III IFNs in the susceptibility of SYNs to ZIKV infections at various gestational stages. We show that 3D-cultured trophoblast JEG-3 cells become resistant to ZIKV infection and constitutively release the type III IFNs, IFNλ1 and IFNλ2, to restrict ZIKV infections in both autocrine and paracrine manners. To correlate these observations with earlier stages of gestation, when fetal infections often result in more severe disease, we also developed a human midgestation organotypic chorionic villous explant model and show that type III IFNs are constitutively released from SYNs during the second trimester of human pregnancy and play important roles in SYN-mediated autocrine and paracrine antiviral pathways. Collectively, these data provide important insights into and new models by which to study the role of type III IFN signaling in the restriction of ZIKV infections in the human placenta.
Results
Establishment of 3D Primary Placental Fibroblast Coculture System.
To establish 3D models of JEG-3 cells, we used a rotating wall vessel (RWV) bioreactor. Previously, we generated a 3D JEG-3–based trophoblast model using JEG-3 cells cocultured with immortalized human microvascular endothelial cells (8) that are grown for ∼21 d on a RWV bioreactor that attaches to slow-turning lateral vessels (STLV), which are filled with cell culture medium (CM) and contain cells attached to porous, collagen-coated dextran beads. This system exposes bead-associated cells to shear stress while preventing bead sedimentation because of constant vessel rotation. Although we showed previously that the endothelial cells used in this model were largely displaced by JEG-3 cells during the culture period (8), it remained unclear what impact, if any, nontrophoblast cells present at the end of the culture period had on the expression and secretory phenotypes of these cultures. Thus, to further validate and improve upon this model, we developed an additional coculture system using primary placental fibroblasts isolated from full-term placentas to generate a parallel coculture model using a more physiologically relevant cell type. Parallel systems therefore allow us to directly compare findings from two independent models and to verify that findings from these models are not because of the presence of nontrophoblast cells.
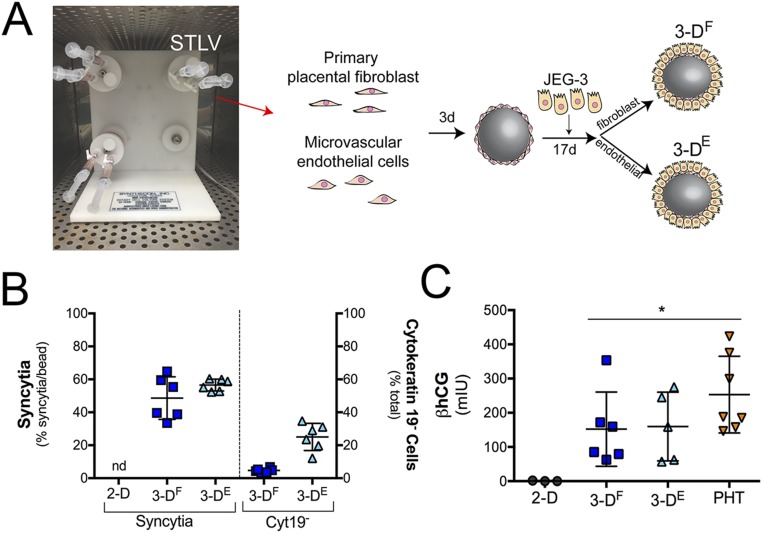
To establish these models, Cytodex-3 beads were cultured with endothelial cells (3DE) or primary placental fibroblasts (3DF) for 3 d in a STLV, at which time JEG-3 cells were added and cultured for an additional 17 d (Fig. S1A). Consistent with our previous findings with endothelial cells (8), we found that JEG-3 cells displaced placental fibroblasts from beads, which corresponded with an enrichment of cytokeratin-19+ (a marker of epithelial-derived cells) trophoblasts at the end of the culture period (Fig. S1B). Importantly, we also found that unlike JEG-3 cells cultured on beads under static conditions (8), 3DF and 3DE cultures formed syncytia, (Fig. 1A and Fig. S1B) and produced human CG β (βhCG), an isoform of hCG specifically produced by SYNs, with levels similar to those observed in PHT cells isolated from full-term placentas (Fig. S1C).
Fig. S1.
The 3D-cultured JEG-3 cells form syncytia and secrete βhCG. (A) Image of a STLV attached to a bioreactor with a schematic of the experimental time line for 3D culturing of JEG-3 cells with primary placental fibroblast (3DF) or human microvascular endothelial cells (3DE). (B, Left) Percentage of syncytia formed in 3DF-, 3DE-, or 2D-cultured JEG-3 cells (nd, not detected). (Right) Percentage of cytokeratin-19− cells remaining on the surfaces of 3DF and 3DE cultures after 21 d in culture. (C) ELISAs for the β-subunit of human CG β (βhCG) from the supernatants of 2D-cultured JEG-3, 3DF or 3DE beads, or PHT cells. βhCG units are presented as milli-international units (mIU) and are normalized to total protein. *P < 0.05.
Fig. 1.
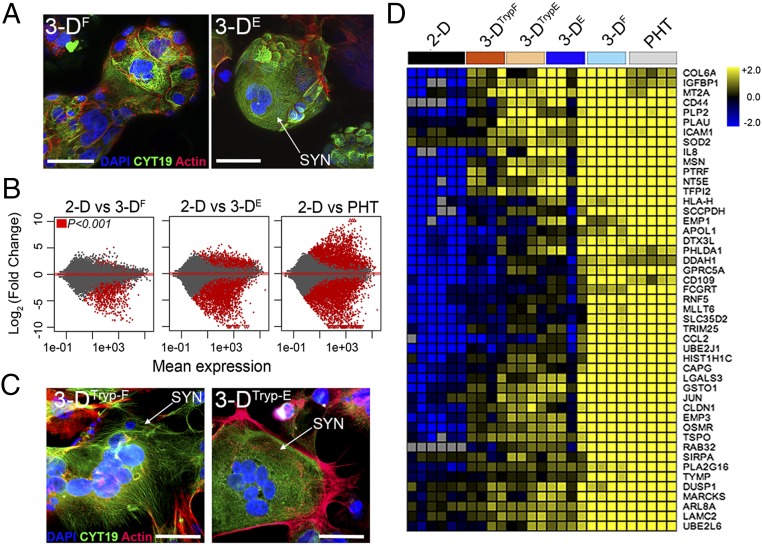
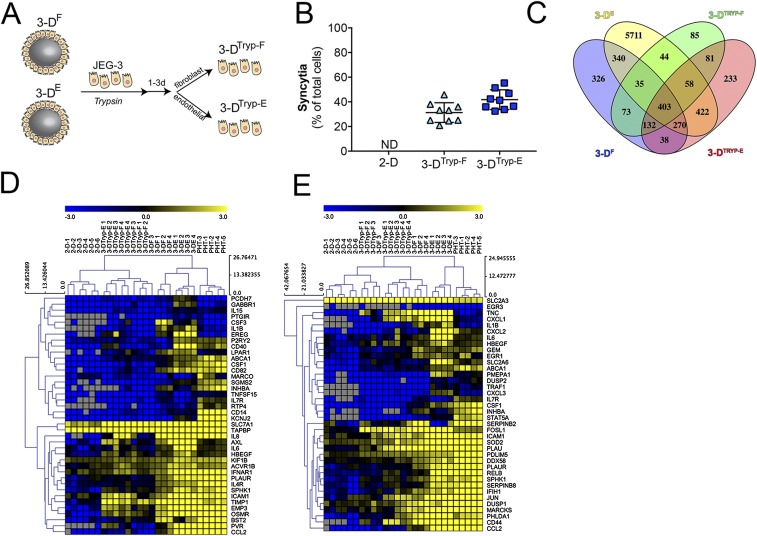
The 3DF- and 3DE-cultured JEG-3 cells express SYN-associated transcripts. (A) Representative confocal micrographs of 3DF (Left) or 3DE (Right) beads immunostained for cytokeratin-19 (green), actin (red), DAPI-stained nuclei (blue). White arrow denotes SYN. (B) MA plots generated in R following DeSeq2 analysis demonstrating the differential expression between 2D JEG-3 cells and 3DF (Left), 3DE (Center), or PHT (Right) cultured cells. Data are plotted as log2 fold-change (y axis) and mean expression (x axis). Red symbols denote transcripts whose expression was differentially expressed at P < 0.001. (C) Confocal micrographs of 3DTryp-F (Left) or 3DTryp-E (Right) cells immunostained for cytokeratin-19 (green), actin (red), or nuclei (blue). (D) Heat maps based on log2 reads per kilobase million (RPKM) of a subset of transcripts differentially expressed (P < 0.001) between 2D JEG-3 cells and 3DE, 3DF, 3DTrypE, 3DTrypF, and PHT cells. (Scale bars, 50 μm.)
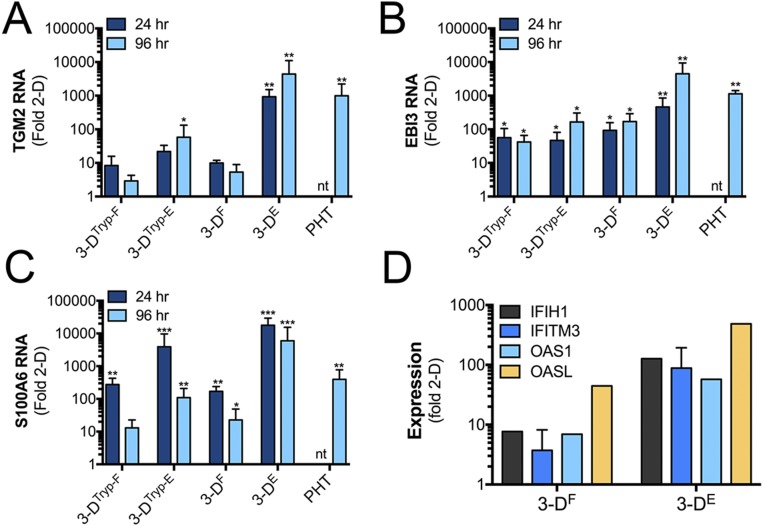
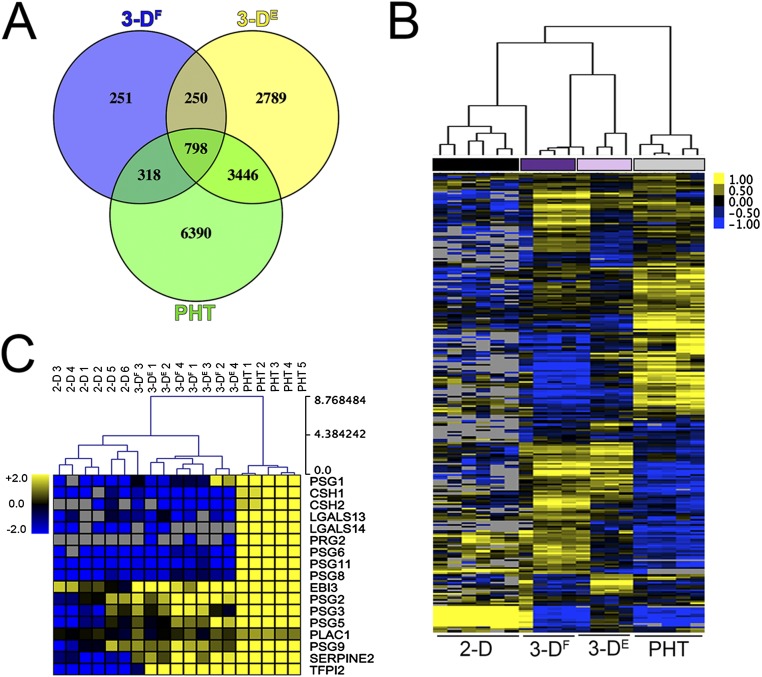
Next, we profiled the transcriptional changes induced in 3DF and 3DE cultures and compared these changes to 2D-cultured cells or to PHT cells using RNASeq followed by differential expression analysis using DeSeq2 (9). Using this approach, we identified the differential expression of transcripts between 2D-cultured JEG-3 cells and either 3DE, 3DF, or PHT cells (Fig. 1B), some of which were validated by qRT-PCR at both early (24 h) and later (96 h) times following removal from the STLV (Fig. S2). Of these differentially expressed genes, 798 were shared between 3DF, 3DE, and PHT cells (Fig. S3A). Importantly, culturing in 3D induced the expression of several SYN-enriched transcripts (such as pregnancy-specific glycoproteins and tissue factor pathway inhibitor 2), which were not expressed or were expressed at low levels in 2D-cultured JEG-3 cells (Fig. S3C). Importantly, these transcripts were induced in both 3DE and 3DF cultures and therefore likely do not result from any remaining nontrophoblast cells at the end of the culture period. Collectively, these data show that parallel 3D coculture models of JEG-3 cells form syncytia and induce the expression of select SYN-associated transcripts independent from the cell type used to establish the cultures.
Fig. S2.
qRT-PCR validation of RNAseq studies. (A–C) qRT-PCR analysis of (A) TGM2, (B) EBI3, and (C) S100A6. Data are from three independent vessels cultured in parallel or from three independent PHT preparations at 24 or 96 h postremoval from the STLV. Data are normalized to 2D-cultured JEG-3 cells and are shown as mean ± SD, *P < 0.05, **P < 0.01, ***P < 0.001, nt, not tested. (D) qRT-PCR analysis of IFIH1, IFITM3, OAS1, or OASL from parallel cultures of 3DF or 3DE cells immediately following their removal from the STLV. Data are normalized to 2D-cultured JEG-3 cells and are shown as mean ± SD.
Fig. S3.
Transcriptional profiles of 3D-cultured JEG-3 cells. (A) Venn diagram denoting transcripts differentially expressed between 2D-cultured JEG-3 cells and 3DF- or 3DE- cultured or PHT cells. (B) Hierarchical clustering heat map based on log2 RPKM values of differentially expressed transcripts (P < 0.001) between 2D JEG-3 and 3DF or 3DE cultures and PHT cells. (C) Hierarchical clustering heat map based on log2 RPKM values of placenta-enriched transcripts expressed in 2D JEG-3 cultures, three independent 3DF or 3DE vessels, or five independent PHT preparations. Gray denotes no expression.
JEG-3 Cells Cultured in 3D and Removed from Beads Retain SYN-Like Phenotypes.
An inherent limitation of RWV bioreactor-based models is the requirement to culture cells on beads, which limits some downstream applications. To overcome this limitation, we optimized the enzyme-mediated removal of 3DF and 3DE cultured JEG-3 cells from Cytodex beads following their culturing on the RWV bioreactor and determined whether this removal influenced their phenotypes (schematic in Fig. S4A). We found that cells removed from beads retained syncytia, or the ability to fuse to form SYNs in culture, from both 3DF (termed 3DTryp-F) and 3DE (termed 3DTryp-E) cultures (Fig. 1C and Fig. S4B). Using RNASeq, we also found that 3DTryp cells retained transcriptional profiles similar to cells cultured in the STLV for up to 5 d postremoval, including retaining the expression of 403 transcripts that were differentially expressed from 2D-cultured JEG-3 cells (a subset of shared transcripts are shown in Fig. 1D and Fig. S4C), and the enrichment of common pathways as assessed by gene-set enrichment analysis (Fig. S4 D and E).
Fig. S4.
The 3DTryp cultures retain phenotypic and transcriptional changes. (A) Schematic for the enzyme-mediated removal of 3D grown JEG-3 cells (3-DTryp). (B) Percentage of cells that form syncytia in 2D, 3DTryp-F, or 3DTryp-E cells. ND, none detected. (C) Venn diagram of the transcripts that are differentially expressed between 2D-cultured JEG-3 cells, 3D-cultured cells, or 3DTryp cells. (D and E) Hierarchical clustering of six 2D cultures of JEG-3 cells, three independent vessels of 3DTryp-F, 3DTryp-E, 3DF, 3DE cultures, or in PHT cells. Genes are involved in the (D) inflammatory response and (E) the TNF-α response.
JEG-3 Cells Cultured in 3D Become Resistant to ZIKV Infection.
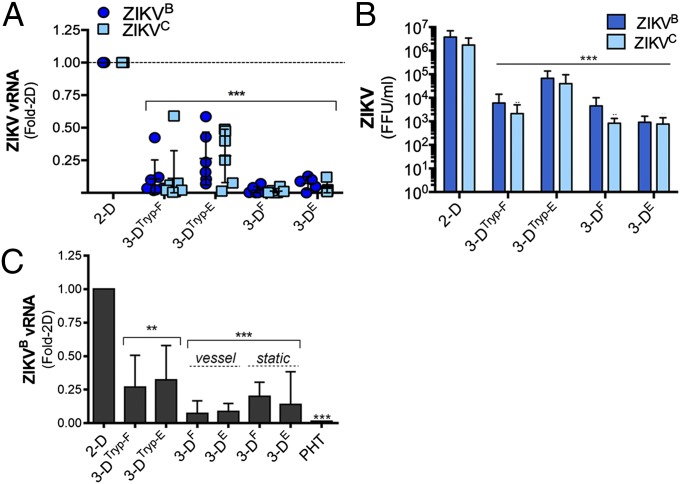
We showed previously that PHT cells exhibit low susceptibility to ZIKV infection (3). Given that 3D-cultured JEG-3 cells fuse to form syncytia and develop a transcriptional profile more similar to PHT cells, we next determined whether these cultures also resist ZIKV infection. We found that 3DF- and 3DE-cultured JEG-3 cells exhibited reduced susceptibility to infection by either a Cambodian strain of ZIKV, FSS13025 (ZIKVC), or a strain that circulated in Brazil in 2015, Paraiba 2015 (ZIKVB), which correlated with significant reductions (up to 1,000-fold) in viral titers (Fig. 2 A and B). Both 3DTryp-F and 3DTryp-E cells also exhibited reduced susceptibility to ZIKV infection, although they were more susceptible than cells that had not been removed from beads (Fig. 2 A and B). Similar to PHT cells, we also found that conditioned medium isolated from 3D-cultured cells, either immediately following removal from the STLV (vessel), after culturing on beads under static conditions for 3 d (static), or removed from beads (3DTryp) inhibited ZIKV infection in nonplacental cells (human brain microvascular endothelial cells, HBMEC) (Fig. 2C), suggesting that these cells also produce paracrine effectors that restrict viral infections.
Fig. 2.
The 3D-cultured JEG-3 cells resist ZIKV infection. (A) qRT-PCR analysis of ZIKV vRNA from six independent vessels of 3DTryp-F-, 3DTryp-E-, 3DF-, 3DE-, or 2D-cultured JEG-3 cells infected with ZIKVB (dark blue) or ZIKVC (light blue) for 48 h. Data are shown as mean fold-change from 2D ± SD,***P < 0.001. (B) FFU per milliliter from three independent vessels of 3DTryp-F-, 3DTryp-E-, 3DF-, 3DE-, or 2D-cultured JEG-3 cells infected with ZIKVB (dark blue) or ZIKVC (light blue) for 48 h. Data are shown as mean ± SD, ***P < 0.001. (C) qRT-PCR analyses of ZIKV vRNA in HBMEC exposed to nonconditioned medium (NCM) or CM isolated from three independent 3DTryp-F-, 3DTryp-E-, 3DF-, 3DE-, or 2D-cultured JEG-3 cultures for 24 h and then infected with ZIKVB for 48 h. Data are displayed as mean fold-change from 2D ± SD, **P < 0.01, ***P < 0.001. Vessel denotes CM isolated immediately following culturing on the RWV. Bioreactor and static refers to 3D-cultured beads grown in standard tissue-culture plates without rotation for ∼96 h.
JEG-3 Cells Cultured in 3D Constitutively Release Type III IFNs, Which Are Involved in Their Protection from ZIKV Infection.
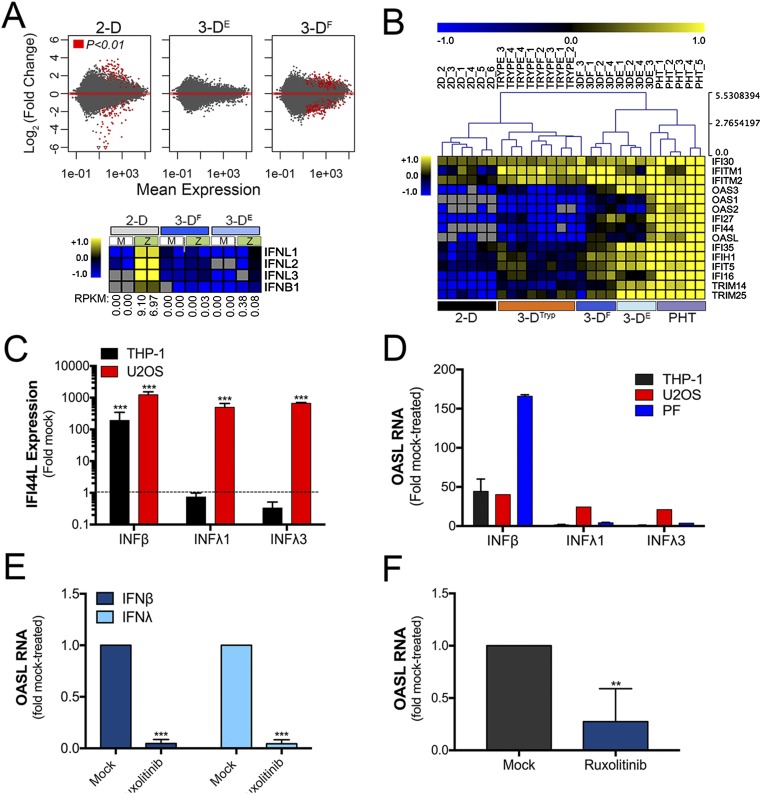
To determine the pathways and factors responsible for the reduction in ZIKV infection in 3D-cultured cells, we profiled the transcriptional changes induced by ZIKV infection in JEG-3 cells cultured in 2D or 3D by RNASeq (Fig. S5A, Upper). Consistent with our previous work (3), we found that JEG-3 cells cultured in 2D and infected with ZIKV (ZIKVC or ZIKVB) robustly induced type III IFNs (IFNλ1–3), with a less robust induction of type I IFNs (IFNβ) (Fig. S5A, Lower). In contrast, ZIKV infection of 3D-cultured JEG-3 cells had no effect on the expression of IFNs (either type I or III) (Fig. S5A, Lower). However, we found that 3DF and 3DE cells basally expressed high levels of many IFN stimulated genes (ISGs) also highly expressed in PHT cells, including several IFN-inducible proteins (IFI16, IFI27, IFIH1), IFN induced transmembrane protein 1 and 2 (IFITM1 and IFITM2), and 2′-5′-oligoadenylate synthetases (OAS), which were also highly expressed in 3DTryp cells (Fig. S5B).
Fig. S5.
Type III IFN signaling IFNλ in placental and nonplacental cells types. (A, Upper) MA plots generated in R following DeSeq2 analysis demonstrating the differential expression between uninfected and ZIKV-infected 2D- (Left), 3DE- (Center), or 3DF- (Right) cultured JEG-3 cells. Data are plotted as log2 fold-changes (y axis) and mean expression (x axis). Red symbols denote transcripts whose expression was differentially expressed at P < 0.01. (Lower) Heat map based on log2 RPKM values of type I (IFNB) or III (IFNλ1–3) IFNs from mock- or ZIKV-infected 2D- (Left), 3DF- (Center), or 3DE- (Right) cultured JEG-3 cells. Numbers at bottom of rows represent RPKM of ZIKV RNA in each sample. (B) Hierarchical clustering of select ISGs in uninfected cultures of 2D, 3DF, 3DE, 3DF, 3DTryp-F, 3DTryp-E, or PHT cultures based on log(RPKM) values. (C and D) U2OS cells, THP-1 cells or primary placental fibroblasts were treated with recombinant IFNβ, IFNλ1, or IFNλ3 (100 ng/mL) for ∼24 h and then the level of ISG induction assessed by qRT-PCR for (C) IFI44L and (D) OASL. Data are normalized to mock-treated controls and are shown as mean ± SD, ***P < 0.001. (E) Cell-coated beads were treated with 5 μM ruxolitinib in the STLV for 24 h before harvesting. Immediately following harvesting, cells were treated with recombinant IFNβ (100 ng/mL) or IFNλ1 (100 ng/mL) for 24 h in the presence of 5 μM ruxolitinib. RT-qPCR for OASL was used to determine the repression of effect of this treatment on ISG induction. Data are normalized to mock-treated controls and are shown as mean ± SD, ***P < 0.001. (F) qRT-PCR for the basal expression of OASL in 3D-cultured JEG-3 cells treated with in 5 μM ruxolitinib for 24 h in the STLV. Immediately following harvesting, RNA was isolated and the expression of OASL assessed. Data are normalized to mock-treated controls and are shown as mean ± SD, **P < 0.01. PF, placental fibroblast.
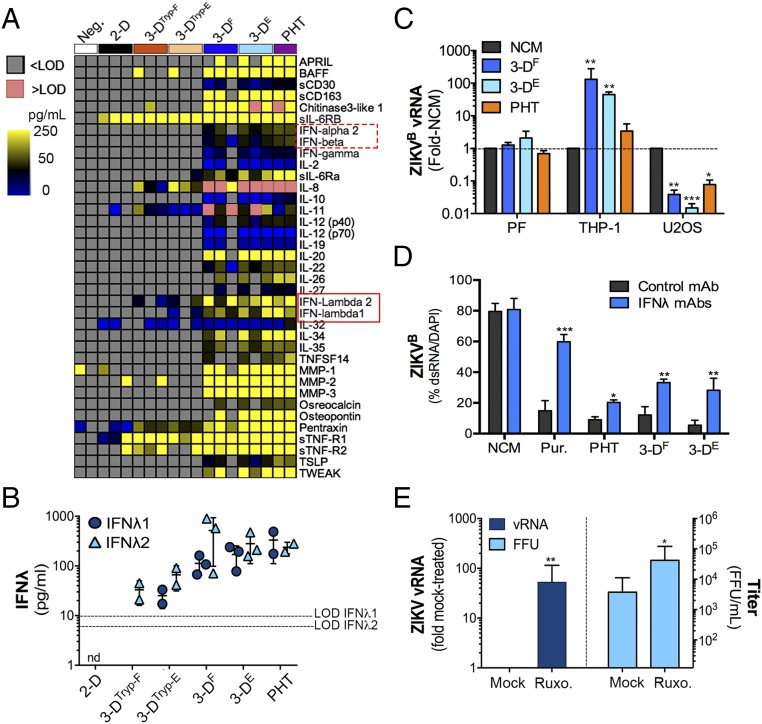
The high basal expression of ISGs in 3D-cultured JEG-3 cells, coupled with their resistance to ZIKV infection and antiviral activity of their CM, suggested that these cells also release ISG-inducing effectors. To determine whether 3D-cultured JEG-3 cells release IFNs or other antiviral cytokines, we performed multiplex immunoassays using Luminex magnetic beads for 37 analytes. Using this approach, we identified cytokines that were secreted from PHT cells, and which were also released by 3D-cultured cells and 3DTryp cells (Fig. 3A). Importantly, these studies revealed that both IFNλ1 and IFNλ2 were released from 3DF, 3DE, and 3DTryp cells, to levels near equivalent to those released from PHT cells (Fig. 3 A and B).
Fig. 3.
The 3D-cultured JEG-3 cells express ISGs and constitutively release type III IFNs. (A) Heat map of Luminex profiling of three independent cultures of 3DTryp-F-, 3DTryp-E-, 3DF-, 3DE-, or 2D-cultured JEG-3 cells or in two preparations of PHT cells. Values are shown as picogram per milliliter, >Limit of detection (LOD) (red) or <LOD (gray). (B) IFNλ1 and -2 levels from 2D- or 3D-cultured JEG-3 cells or in PHT cells from the Luminex shown in A. nd, not detected. (C) Human monocyte THP-1 cells, osteosarcoma U2OS cells, or primary placental fibroblasts were exposed to nonconditioned medium (NCM) or CM isolated from 3DF, 3DE, or PHT cultures for ∼24 h and then infected with ZIKVB for ∼48 h. Infection was assessed by qRT-PCR for vRNA and is shown as mean ± SD from NCM-treated controls, *P < 0.05, **P < 0.01, ***P < 0.001. (D) HBMEC were exposed to NCM, 100 ng/mL each of recombinant IFNλ1 and IFNλ3 (Pur.), or CM isolated from 3DF, 3DE, or PHT cultures that had been preincubated with control monoclonal antibody or with IFNλ1 and -3 neutralizing antibodies. Following this exposure (for 24 h), cells were infected with ZIKVB for 48 h and infection assessed by immunostaining for ZIKV vRNA (shown as ZIKV-infected cells as a percentage of total cells). Data are shown as mean ± SD, **P < 0.01, ***P < 0.001. (E) 3DE cultured JEG-3 cells (cultured for 20 d) were treated with 5 μM ruxolitinib (Ruxo.) for ∼24 h in an STLV and then infected with ZIKVB in the absence or presence of ruxolitinib for 48 h and infection assessed by qRT-PCR for vRNA (Left) or by FFU assay (Right). Data are shown as ±SD from four independent vessels, *P < 0.05, **P < 0.01.
Next, we explored the impact of type III IFNs in the paracrine and autocrine-mediated antiviral effects of 3D-cultured JEG-3 cells. To do this, we first profiled the responsiveness of cells to type I and III IFNs and then determined whether these cells responded to the antiviral effects of this treatment or to the antiviral effects of 3D-derived CM. For these studies, we used human osteosarcoma U2OS cells, which are responsive to type III IFNs, and human monocyte THP-1 cells and primary placental fibroblasts, which do not respond to type III IFNs (Fig. S5 C and D). Consistent with a role for type III IFN signaling in the paracrine-mediated effects of 3D JEG-3 CM, we found that ZIKV infection was suppressed in U2OS cells following exposure, but that infection in placental fibroblasts was unaffected (Fig. 3C). In addition, CM did not suppress ZIKV infection in THP-1 cells and instead led to a significant enhancement of infection (Fig. 3C). Similar results were obtained with CM isolated from PHT cells (Fig. 3C). Next, to inhibit IFNλ-mediated paracrine signaling in recipient cells exposed to CM, we used neutralizing antibodies against type III IFNs and found that neutralizing antibodies against IFNλ1 and IFNλ2/3 led to an enhancement of ZIKV infection in cells exposed to CM from PHT cells and 3D-cultured JEG-3 cells (Fig. 3D). Finally, to assess the impact of autocrine-mediated type III IFN signaling on the protection of 3D-cultured cells with ZIKV infection, we treated cells with the Janus kinase (JAK) 1/2 inhibitor ruxolitinib for 24 h in the STLV before bead removal and subsequent infection. We found that ruxolitinib treatment inhibited ISG induction following treatment of 3D-cultured cells with recombinant type I (IFNβ) or type III (IFNλ1) IFNs (Fig. S5E). We also found that this treatment reduced the high basal expression of the ISG OASL (Fig. S5F). Lastly, we found that ruxolitinib treatment significantly enhanced the levels of ZIKVB vRNA production in 3D-cultured cells and led to an almost 100-fold enhancement in ZIKV infectious titers (Fig. 3E). Given that ZIKV infection of 3D-cultured cells has no impact on the expression of IFNs or in the induction of ISGs (Fig. S5A), these results suggest that the autocrine-mediated effects of constitutively released type III IFNs protect 3D-cultured cells from ZIKV infection.
Midgestation Human SYNs Release Type III IFNs That Function in Autocrine and Paracrine Manners to Suppress ZIKV Infection.
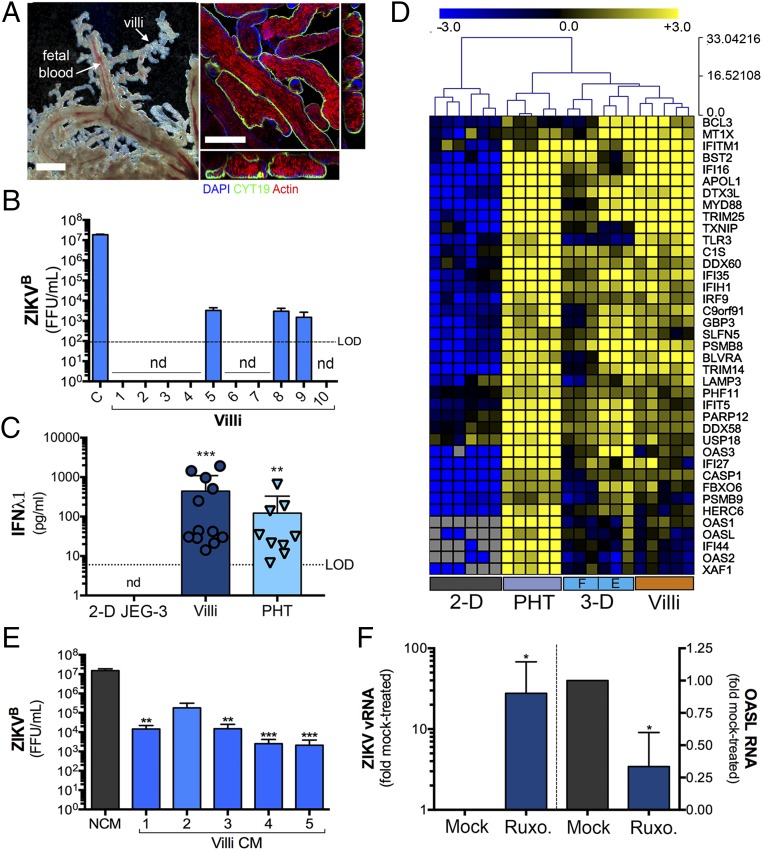
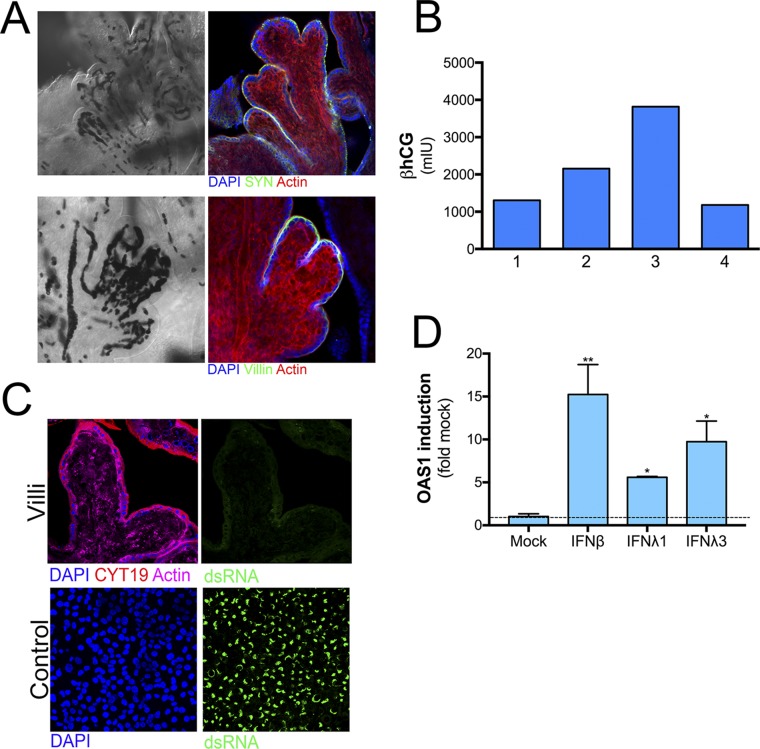
Our data suggest that 3D-derived JEG-3 cells recapitulate many of the morphologic and functional phenotypes associated with PHT cells, which are isolated from full-term placentas. However, whether this model also recapitulates earlier stages of gestation, or whether type III IFNs also play a role at these stages of pregnancy, is unknown. Therefore, we established an explant model of human chorionic villous trees isolated from second-trimester placentas (between ∼17- and 23-wk gestation). Isolated villi retained the morphology of human placental villi in vivo (Fig. 4A), including a continuous layer of SYNs covering the villous tree surfaces that express the endogenous retrovirus fusion protein syncytin (HERV-W) and microvilli on their apical surfaces, as assessed by immunofluorescence staining for villin (Fig. S6A). In addition, isolated villi produced high levels of βhCG (Fig. S6B).
Fig. 4.
Midgestation chorionic villi constitutively release type III IFNs. (A, Left) Bright-field microscopy of an isolated chorionic villi from a human placenta (∼21 wk), demonstrating the retention of villous architecture and blood-filled fetal microvasculature. (Right) Confocal images of midgestation chorionic villi immunostained for cytokeratin-19 (green), actin (red), or counterstained for nuclei (blue). Shown at right and below are 3D-based image reconstructions of xz images. (Scale bar, 50 μm.) (B) ZIKV infectious titers (shown as FFU/mL) from chorionic villi isolated from 10 midgestation placentas (∼17- to 23-wk gestation). In parallel, HBMEC (designated as “C”) were infected with an equal inoculum of virus to serve as a control. nd, not detected. (C) IFNλ1 ELISA from 2D-cultured JEG-3 cells, midgestation chorionic villi isolated from 12 placentas or 9 preparations of PHT cells. Data are shown as ±SD, **P < 0.01, ***P < 0.001. (D) Hierarchical clustering heat map of select ISGs based on log2 RPKM values generated from RNASeq analysis of 2D- or 3D-cultured JEG-3 cells, PHT cells, or chorionic villous explants from three midgestation placentas (“F” denotes 3DF cultures and “E” denotes 3DE cultures). Gray indicates no expression. (E) HBMEC were exposed to nonconditioned medium (NCM) or CM isolated from chorionic villi isolated from four independent placental preparations (Plac 1–4) that had been cultured for 24 h. Cells were exposed to CM for 24 h before infection with ZIKVB for 48 h, at which time infection was assessed by FFU assay. Data are shown mean as ±SD are normalized to NCM-treated controls, **P < 0.01, ***P < 0.001. (F) Isolated chorionic villi were treated with 5 μM ruxolitinib (Ruxo.) for 30 min before infection with ZIKVB for 48 h. Following infection, levels of ZIKV vRNA were assessed by qRT-PCR (Left). Expression of OASL (Right) was assessed by qRT-PCR in uninfected control villi. Data are shown as ±SD from villi isolated from four independent placentas, *P < 0.05.
Fig. S6.
Isolated midgestation chorionic villi retain placental architecture and hormone production. (A) Confocal micrographs of isolated midgestation chorionic villi immunostained for the endogenous retrovirus fusion protein syncytin (SYN, green, Upper) or villin (green, Lower) or stained for actin (in red). DAPI-stained nuclei are shown in blue and differential interference contrast (DIC) image is shown at Left. In DIC image, darkened areas represent fetal blood present in the fetal microvasculature. (B) ELISA for the β-subunit of human CG (βhCG) shown as milli-international units from medium isolated from chorionic villous explants from four independent placental preparations that had been cultured for 24 h. (C, Upper) A chorionic villous explant infected with ZIKVB for 72 h and then immunostained for cytokeratin-19 (in red) or ZIKV vRNA (in green). Actin staining is in magenta and DAPI-stained nuclei in blue. (Lower) HBMEC were infected with ZIKVB in parallel for 72 h to serve as a positive control for infection and immunostaining for ZIKV vRNA (in green). DAPI-stained nuclei are in blue. (D) Isolated chorionic villous explants were treated with 100 ng of recombinant IFNβ, IFNλ1, or IFNλ3 for ∼24 h and qRT-PCR performed for the ISG OAS1. Data are shown as mean ± SD as a fold of mock-treated controls. **P < 0.01, *P < 0.05. (Magnification, 40×.)
To determine whether SYNs from second-trimester chorionic villi are susceptible to ZIKV infection, we assessed the production of infectious viral RNA (vRNA) and infectious progeny. Consistent with the work of others in ex vivo explants (10) and human tissue (11, 12), we found that second-trimester SYNs were largely resistant to ZIKV infection, with no vRNA detectable by immunofluorescence microscopy for double-strand RNA (dsRNA) (Fig. S6C) and low to undetectable levels of infectious viral particles (Fig. 4B). Indeed, of villi isolated from 10 different midgestation placental preparations, three produced detectable levels of infectious ZIKV (Fig. 4B), but we were unable to locate vRNA in SYNs in any of these villi (Fig. S6C). In addition, we found that CM isolated from second-trimester villous explants suppressed ZIKV infection in nonplacental cells (Fig. 4E), suggesting that paracrine effectors that restrict viral infections are also produced early in gestation. Consistent with this, we found that villi isolated from 12 different second-trimester placentas all produced IFNλ1 to levels like those observed in PHT cells (Fig. 4C). Consistent with a role for autocrine- and paracrine-mediated IFNλ signaling in the protection of midgestation placentas from ZIKV infection, we also found that isolated villi basally express high levels of ISGs to levels like those observed in both 3D-cultured JEG-3 cells and PHT cells as assessed by RNASeq analysis from three different placental preparations (Fig. 4D).
To determine whether IFNλs constitutively released from midgestation chorionic villi protect the human placenta from ZIKV infection in an autocrine manner, we treated isolated villi with ruxolitinib and determined whether this treatment reduced basal ISG expression and sensitized tissue to ZIKV infection. We found that ruxolitinib reduced the basal expression of OASL (by ∼50%) and concomitantly enhanced the levels of ZIKV vRNA (∼25-fold) in villi isolated from four independent placentas (Fig. 4F). Collectively, these data support a role for type III IFN signaling in the protection of the human placenta from ZIKV infection during the second trimester of pregnancy.
Discussion
Very little is known about the mechanisms by which viruses associated with congenital disease cross the placental barrier to access the fetal compartment. Here, we generated tractable cell-line–based models and a second-trimester chorionic villi explant model that can be used to elucidate the trophoblast-mediated innate pathways that limit viral vertical transmission. These models revealed that type III IFNs are constitutively produced by SYNs at various stages of gestation and play important roles in protecting the human placenta from ZIKV infection in both autocrine and paracrine manners. The models we describe thus not only inform our understanding of the processes by which the human placenta restricts viral infections during various stages of pregnancy, but also provide human cell-based platforms that can be used to test the effectiveness of therapeutics aimed at restricting viral vertical transmission.
The release of IFNλs specifically from 3D-cultured JEG-3 cells suggests that syncytia formation is a prerequisite for the initiation of this process. However, syncytia formation in forskolin-treated BeWo cells is not sufficient to induce IFNλ release (3), suggesting that more than fusion alone is required. It is unknown whether the JEG-3–based 3D system we describe induces syncytia formation by a pathway that more closely resembles that which occurs in vivo, but the induction of IFNλ release suggests that this might be the case and points to specific factors or pathways that must be stimulated to induce a cascade of events culminating in IFNλ production. Whether the shear stress initiated by culturing cells in 3D is responsible for this fusion and subsequent IFNλ release seems likely, given that parallel models respond to STLV-based culturing by releasing type III IFNs. In support of the possible importance of shear stress in SYN formation and function, once maternal spiral arteries are formed (toward the end of the first trimester), the intervillous space (IVS) becomes filled with maternal blood, which exposes the surfaces of placental villi to shear forces. It is unknown whether trophoblasts cultured in the RWV bioreactor are exposed to the shear forces that mimic those of the placenta in vivo, given difficulties in assessing the shear forces within the IVS during human pregnancy, but our findings implicate CYT-to-SYN fusion as a critical determinant for IFNλ release, which is supported by our previous work in PHT cells (3).
Type III IFNs have been shown to stimulate ISG expression in response to viral infection in a number of cell types, including epithelial cells of the respiratory (13, 14) and gastrointestinal (15, 16) tracts, hepatocytes (17), and endothelial cells of the blood–brain barrier (18). However, unlike these cell types, human SYNs constitutively release IFNλs in the absence of viral infections, which correlates with the high constitutive expression of ISGs that presumably confers a persistent antiviral state in these cells. Our results suggest that type III IFNs constitutively secreted by the human placenta at both mid and late stages of gestation play an important role in the autocrine- and paracrine-mediated protection of cells at the maternal–fetal interface from viral infections. However, given that stem-cell–derived models of the undifferentiated trophoblasts that form very early postconception (primitive trophoblasts) are permissive to ZIKV infection (19), it is unlikely that these cells constitutively release type III IFNs. However, once these primitive trophoblasts begin to differentiate, they become resistant to ZIKV infection and express several ISGs (19). These data suggest that once SYNs form (as early as 12-d gestation), type III IFNs may become constitutively released to protect the developing embryo from infection. Although our findings do not exclude the possibility that SYNs mount other antiviral pathways, which is supported by our previous work (2, 4, 5), our findings implicate type III IFNs as key regulators of the resistance of the human placenta at both mid and late stages of human pregnancy from viral infections, including ZIKV.
The human placenta is a highly complex and unique organ. Our data point to a direct role for type III IFNs in the protection of human SYNs from viral infection at both mid and late stages of human gestation and provide important in vitro models to study the pathways and factors that mediate these effects. Defining the contribution of antiviral pathways present in human SYNs is critical to identify the possible mechanisms by which ZIKV and other viruses associated with congenital infection bypass the placental barrier to access the fetus.
Materials and Methods
Additional methods can be found in SI Materials and Methods.
RWV Bioreactor 3D Cultures.
HBMEC or primary placental fibroblasts were harvested in 0.05% trypsin/EDTA and incubated with ∼300-mg collagen-coated Cytodex-3 beads (Sigma) at 4 × 10⁶ cells/300 mg beads in GTSF-2 medium (HyClone) supplemented with 10% FBS (Gibco), insulin-transferrin-sodium selenite (0.5×) (Sigma), penicillin/streptomycin, sodium bicarbonate, and amphotericin B (Gibco). After a brief static incubation (∼15–30 min) at 37 °C, the bead/cell slurry was added to autoclavable 55-mL STLVs and attached to a rotating base (Synthecon) at 19–21 rpm to maintain the cells in suspension for the duration of the culture period (21 d). Three days into the culture period, JEG-3 cells were harvested and 8 × 10⁶ cells were added. Vessels were incubated under static conditions for 15–30 min before resuming rotation. Cell culture medium was replenished every 48 h for the entirety of the culture period. For removal of 3D-cultured JEG-3 cells (3-DTryp), cell-coated beads were washed thoroughly in PBS and then incubated with 0.05% trypsin/EDTA (3DF) or 1× TryPLE Express (Gibco) (3DE) for ∼30 min at room temperature, with frequent, gentle inversion. Following incubation, the cell/bead slurry was passed through a 100-μM cell strainer to remove beads. Isolated cells were collected by centrifugation at 1200 rpm on a Sorvall Legend RT Plus Centrifuge (Thermo Fisher Scientific) and enumerated using a Bio-Rad TC20 Automated Cell Counter. Isolated cells (3DTryp) or an equal number of bead-associated cells were plated in 8-well chamber slides for imaging or in 24-well plates for infection studies.
Human Placental Explants and Primary Cells.
PHT cells and primary placental fibroblasts were isolated from healthy singleton-term placentas were cultured as described previously (3, 4, 20) under an exempt protocol approved by the Institutional Review Board at the University of Pittsburgh. Human fetal placental tissue from less than 24-wk gestation that resulted from elective terminations were obtained from the University of Pittsburgh Health Sciences Tissue Bank through an honest broker system after approval from the University of Pittsburgh Institutional Review Board and in accordance with the University of Pittsburgh’s tissue procurement guidelines. Chorionic villi were dissected and cultured in DMEM/F12 (1:1) supplemented with 10% FBS, penicillin/streptomycin, and amphotericin B for between 24 and 96 h. For infections, isolated villi were infected immediately following isolation with 5 × 10⁵ fluorescent focus unit (FFU)/mL ZIKVB for 72 h. For imaging, villi were fixed and imaging performed as detailed in SI Materials and Methods.
Statistics.
All statistical analysis was performed using GraphPad Prism. Experiments were performed at least three times from at least two independent STLVs or explants isolated from three independent placentas, as indicated in the figure legends. Data are presented as mean ± SD. A Student’s t test was used to determine statistical significance when two sets were compared and one-way ANOVA with Bonferroni’s correction used for post hoc multiple comparisons was used to determine statistical significance. Specific P values are detailed in the figure legends.
SI Materials and Methods
Cell Culture.
PHT cells were maintained in DMEM (Sigma) containing 10% FBS (HyClone) and antibiotics at 37 °C in a 5% CO2 air atmosphere. Primary placental fibroblasts, were isolated and cultured as described previously (20). CM from PHT cells was collected ∼72 h following plating, as described previously (4). For standard cell culturing, JEG-3 cells were cultured in modified Eagle’s medium supplemented with 10% FBS and penicillin/streptomycin. The 2D-cultured JEG-3 cells were cultured on standard tissue-cultured treated surfaces for a minimum of 2–3 d. Vero cells were maintained in DMEM supplemented with 10% FBS and antibiotics. HBMEC were propagated as described previously (3).
ELISAs.
ELISAs for IFNλ1 (R&D Systems) were performed according to the manufacturer’s protocol. Sandwich ELISAs for the β-subunit of human CG was performed as follows: capture antibody (Invitrogen) was diluted to a final concentration of 3 ng/mL in PBS and applied to a 96-well EIA/RIA high-binding certified surface chemistry 96-well plate (Costar) at 4 °C overnight, washed, and blocking performed with 1% BSA in 0.05% Tween-20 in PBS (PBS-T) for 2 h. Following washing, recombinant protein (Abcam) or CM was incubated for 2 h, washed, and horse radish peroxidase-conjugated detection antibody (Invitrogen) added for 2 h. Plates were developed with tetramethylbenzidine substrate (ThermoScientific), reactions stopped with 2N sulfuric acid, and absorbance values read at 450 and 540 nm. Sample concentration was extrapolated using a linear standard curve.
RNA Isolation and qRT-PCR.
Cells were lysed and cellular RNA was isolated using a GenElute Total RNA Miniprep Kit (Sigma). Following isolation and treatment with DNase (Sigma), RNA was reverse-transcribed using an iScript cDNA synthesis kit (Bio-Rad) containing 0.1–1 μg of sample RNA per reaction. qRT-PCR was conducted using IQ SYBR Green Supermix (Bio-Rad) in a Bio-Rad CFX96 touch real-time PCR detection system or an Applied Biosystems StepOne Plus real time PCR machine. A modified ΔCt method was used to calculate gene expression using human actin for normalization. Primer sequences for OASL, cytokeratin 19, actin, and ZIKV have been previously described (3, 8).
RNASeq.
Total RNA was extracted as described above and RNASeq performed as described previously (3, 8). Briefly, libraries were prepared with the New England Biolabs Ultra Library Preparation kit and library quality was determined using the Qubit assay and the Agilent 2100 Bioanalyzer. Sequencing was performed with the Illumina HiSeq2500 rapid-run mode on one flow cell (two lanes) and CLC Genomics Workbench 9.0 (Qiagen) was used to process, normalize, and map sequence data to the human reference genome (hg19). For the calculation of viral RPKM values, sequences were mapped to the appropriate viral genome using CLC Genomics Workbench 9.0. Differentially expressed genes were identified using the DESeq2 package in R (9) with a significance cut-off stated in the figure legends. Hierarchical clustering was performed using Cluster 3.0/Java Treeview. Heat maps were generated using MeV software based upon log(RPKM) or log2(RPKM) values. Gene-set enrichment analysis v2.0 was used for enrichment analyses, which were deemed significantly enriched if the false discovery rate was <0.01. Analysis of the transcriptional profile of select JEG-3 and PHT cells were based on previously published datasets (3, 8), which were deposited in the National Center for Biotechnology Information Sequence Read Archives (SRA) under accession no. SRP067137. Files associated with RNASeq from the present study have been deposited into SRA under accession no. SRP109039.
Neutralization Assay.
CM or recombinant IFNλ1 and IFNλ2 (100 ng/mL; R&D Systems) were incubated with neutralizing antibodies against IFNλ1 and IFNλ3 (1 µg/mL each; R&D Systems), or control mouse IgG1 (1 µg/mL; Sigma) for 1 h at room temperature before addition to cells. After 24 h, cells were infected with 1 FFU ZIKVB per cell for 48 h and infection assessed by immunostaining with anti-dsRNA antibody, as described above. Recombinant IFNβ was purchased from R&D Systems.
Immunofluorescence Microscopy and Quantification of Syncytia Formation.
For imaging studies, cells, beads, or tissue was fixed in 4% PFA followed by permeabilization in 0.25% Triton X-100, washed in PBS, incubated with primary antibody, washed in PBS, and then incubated with Alexa Fluor conjugated secondary antibodies. Alexa Fluor-conjugated phalloidin was purchased from Invitrogen (A12379 or A12381). Rabbit anticytokeratin-19 (ab52625) and antisyncytin/HERV (ab71115) antibodies was purchased from Abcam. Rabbit antivillin antibody was purchased from Proteintech (16488). Mouse anti-dsRNA was provided from Abraham Brass, University of Massachusetts, Worcester, MA. Cells, beads, or tissue were mounted with VectaShield (Vector Laboratories) containing DAPI and images captured using an Olympus FV1000 confocal microscope or Olympus IX83 inverted fluorescent microscope. Images were adjusted for brightness/contrast using Adobe Photoshop (Adobe).
To quantify the percentage of syncytia formation in 3D-cultured JEG-3 cultures, the number of syncytia (as defined as cells containing >three nuclei) and total number of cells were counted from at least 30 beads per vessel (for a total of ∼400 total cells). The number of syncytia per bead was divided by the number of total cells per bead. To quantify, the percentage of syncytia in the 3DTryp cells syncytia and total cells (from at least 400 total cells from at least three independent slides per vessel) were counted. The ratio of syncytia to total cells were averaged and plotted as percentage syncytia per bead.
Luminex Assays.
Luminex profiling was performed using the Human Inflammation assay (Bio-Rad) by the Cancer Proteomics Facility Luminex Core Facility at the University of Pittsburgh, according to the manufacturer’s protocol, using the laboratory multianalyte profiling system (LabMAP) system developed by the Luminex Corporation. Heat maps were generated using the concentration (picograms/milliliter) in MeV software, values above the limit of detection were pseudocolored red in Adobe Photoshop (Adobe).
Ruxolitinib Treatments.
Ruxolitinib was purchased from AdipoGen and was used at 5 μm. For treatment of 3D-cultured cells, ruxolitinib was added to cell culture medium within the STLV for 24 h before the completion of the culture period (21 d). Treated cells (or mock controls) were removed after the treatment period and infected with ZIKV for 48 h in the presence of ruxolitinib. For treatment of human explants, isolated villi were treated with ruxolitinib for 30 min immediately following dissection and then infected with ZIKV for 48 h in the presence of ruxolitinib.
Viral Infections.
Experiments were performed with ZIKV FSS13025 (ZIKVC) or Paraiba (ZIKVB) strain propagated in Vero cells with a multiplicity of infection of 1–3. For infections of cells grown in 3D, beads were removed from the STLV and infected immediately in 24-well plates for the duration of the infection period. To calculate cell number and multiplicity of infection, beads were removed from the STLV, washed with PBS, and incubated with 0.05% trypsin-EDTA to remove cells. Cells were then enumerated using a Bio-Rad TC20 Automated Cell Counter. In all cases, infections were performed with equivalent numbers of 2D, 3D, 3DTryp, or PHT cells. Viral titers were determined by fluorescent focus assays, as previously described (10), with an anti-dsRNA monoclonal antibody provided by Abraham Brass, University of Massachusetts, Worcester, MA. Cells were infected with 1 FFU per cell unless otherwise stated for 48–96 h.
Acknowledgments
We thank Judy Ziegler (Magee Women’s Research Institute) for technical support, and the University of Pittsburgh Cancer Institute Luminex Core Facility, which receives funding from P30CA047904. This project also used the University of Pittsburgh Cancer Institute Tissue and Research Pathology/Health Sciences Tissue Bank shared resource, which is supported in part by Award P30CA047904; and Grants NIH R01-AI081759 (to C.B.C.), R01-HD075665 (to C.B.C. and Y.S.), and T32-AI049820 (to J.C.). C.B.C. is supported by a Burroughs Wellcome Investigators in the Pathogenesis of Infectious Disease Award.
Footnotes
The authors declare no conflict of interest.
This article is a PNAS Direct Submission.
Data deposition: RNASeq data from this study have been deposited into the Sequence Read Archive (SRA), https://www.ncbi.nlm.nih.gov/sra (accession no. SRP109039).
This article contains supporting information online at www.pnas.org/lookup/suppl/doi:10.1073/pnas.1707513114/-/DCSupplemental.
References
- 1.Arora N, Sadovsky Y, Dermody TS, Coyne CB. Microbial vertical transmission during human pregnancy. Cell Host Microbe. 2017;21:561–567. doi: 10.1016/j.chom.2017.04.007. [DOI] [PMC free article] [PubMed] [Google Scholar]
- 2.Bayer A, et al. Human trophoblasts confer resistance to viruses implicated in perinatal infection. Am J Obstet Gynecol. 2015;212:71.e1–71.e8. doi: 10.1016/j.ajog.2014.07.060. [DOI] [PMC free article] [PubMed] [Google Scholar]
- 3.Bayer A, et al. Type III interferons produced by human placental trophoblasts confer protection against Zika virus infection. Cell Host Microbe. 2016;19:705–712. doi: 10.1016/j.chom.2016.03.008. [DOI] [PMC free article] [PubMed] [Google Scholar]
- 4.Delorme-Axford E, et al. Human placental trophoblasts confer viral resistance to recipient cells. Proc Natl Acad Sci USA. 2013;110:12048–12053. doi: 10.1073/pnas.1304718110. [DOI] [PMC free article] [PubMed] [Google Scholar]
- 5.Ouyang Y, et al. Isolation of human trophoblastic extracellular vesicles and characterization of their cargo and antiviral activity. Placenta. 2016;47:86–95. doi: 10.1016/j.placenta.2016.09.008. [DOI] [PMC free article] [PubMed] [Google Scholar]
- 6.Coyne CB, Lazear HM. Zika virus—Reigniting the TORCH. Nat Rev Microbiol. 2016;14:707–715. doi: 10.1038/nrmicro.2016.125. [DOI] [PubMed] [Google Scholar]
- 7.Maltepe E, Bakardjiev AI, Fisher SJ. The placenta: Transcriptional, epigenetic, and physiological integration during development. J Clin Invest. 2010;120:1016–1025. doi: 10.1172/JCI41211. [DOI] [PMC free article] [PubMed] [Google Scholar]
- 8.McConkey CA, et al. A three-dimensional culture system recapitulates placental syncytiotrophoblast development and microbial resistance. Sci Adv. 2016;2:e1501462. doi: 10.1126/sciadv.1501462. [DOI] [PMC free article] [PubMed] [Google Scholar]
- 9.Love MI, Huber W, Anders S. Moderated estimation of fold change and dispersion for RNA-seq data with DESeq2. Genome Biol. 2014;15:550. doi: 10.1186/s13059-014-0550-8. [DOI] [PMC free article] [PubMed] [Google Scholar]
- 10.Tabata T, et al. Zika virus targets different primary human placental cells, suggesting two routes for vertical transmission. Cell Host Microbe. 2016;20:155–166. doi: 10.1016/j.chom.2016.07.002. [DOI] [PMC free article] [PubMed] [Google Scholar]
- 11.Bhatnagar J, et al. Zika virus RNA replication and persistence in brain and placental tissue. Emerg Infect Dis. 2017;23:405–414. doi: 10.3201/eid2303.161499. [DOI] [PMC free article] [PubMed] [Google Scholar]
- 12.Ritter JM, Martines RB, Zaki SR. Zika virus: Pathology from the pandemic. Arch Pathol Lab Med. 2017;141:49–59. doi: 10.5858/arpa.2016-0397-SA. [DOI] [PubMed] [Google Scholar]
- 13.Contoli M, et al. Role of deficient type III interferon-lambda production in asthma exacerbations. Nat Med. 2006;12:1023–1026. doi: 10.1038/nm1462. [DOI] [PubMed] [Google Scholar]
- 14.Jewell NA, et al. Lambda interferon is the predominant interferon induced by influenza A virus infection in vivo. J Virol. 2010;84:11515–11522. doi: 10.1128/JVI.01703-09. [DOI] [PMC free article] [PubMed] [Google Scholar]
- 15.Pott J, et al. IFN-lambda determines the intestinal epithelial antiviral host defense. Proc Natl Acad Sci USA. 2011;108:7944–7949. doi: 10.1073/pnas.1100552108. [DOI] [PMC free article] [PubMed] [Google Scholar]
- 16.Nice TJ, et al. Interferon-λ cures persistent murine norovirus infection in the absence of adaptive immunity. Science. 2015;347:269–273. doi: 10.1126/science.1258100. [DOI] [PMC free article] [PubMed] [Google Scholar]
- 17.Marukian S, et al. Hepatitis C virus induces interferon-λ and interferon-stimulated genes in primary liver cultures. Hepatology. 2011;54:1913–1923. doi: 10.1002/hep.24580. [DOI] [PMC free article] [PubMed] [Google Scholar]
- 18.Lazear HM, et al. Interferon-λ restricts West Nile virus neuroinvasion by tightening the blood-brain barrier. Sci Transl Med. 2015;7:284ra59. doi: 10.1126/scitranslmed.aaa4304. [DOI] [PMC free article] [PubMed] [Google Scholar]
- 19.Sheridan MA, et al. Vulnerability of primitive human placental trophoblast to Zika virus. Proc Natl Acad Sci USA. 2017;114:E1587–E1596. doi: 10.1073/pnas.1616097114. [DOI] [PMC free article] [PubMed] [Google Scholar]
- 20.Rausch K, et al. Screening bioactives reveals nanchangmycin as a broad spectrum antiviral active against Zika virus. Cell Rep. 2017;18:804–815. doi: 10.1016/j.celrep.2016.12.068. [DOI] [PMC free article] [PubMed] [Google Scholar]


