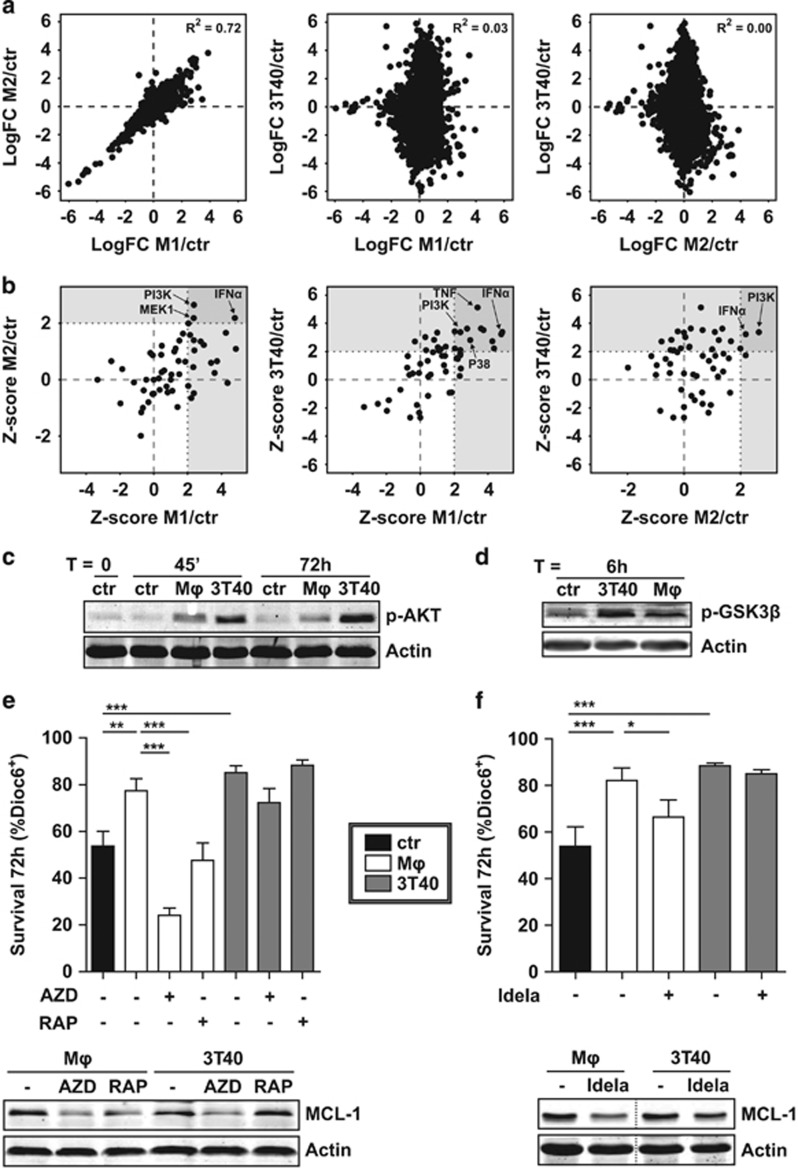
Figure 2.
MCL-1 induction depends on PI3K-AKT-mTOR signaling after both CD40L and Mϕ stimulation. (a) CLL cells were co-cultured as in Figure 1 (N=3 paired samples for each condition) for 16h and RNA from CD5/CD19 FACS-sorted CLL cells (>99% purity) was subjected to microarray analysis. Next, for each mRNA, the log fold change (LogFC) relative to control condition was calculated and plotted. The goodness of fit for the linear regression models (R2) is indicated. (b) A core analysis in the ingenuity pathway analysis (IPA) software was performed with signatures created from the microarray data based on cut-off values logFC >0.8 and P-value <0.01 to identify putative upstream regulators common to all three stimuli. The Z-score of candidate upstream regulators was visualized in scatterplots, in which upstream regulators with a Z-score over 2.0 were defined as activated, in line with IPA specifications. Several potentially relevant activated regulators are indicated by arrows. (c) CLL cells were serum starved for 3 h and subsequently co-cultured as in Figure 1 on indicated feeder layers for indicated time points and the phosphorylation of AKT was determined by western blot (shown blot is representative of N=4). β-Actin was used as a loading control. (d) After resting for 3 h, CLL samples were co-cultured as in Figure 1 on indicated feeder layers for 6h and the activation of AKT signaling was determined by western blotting for phosphorylated GSK3β (blot representative of N=4). (e) CLL samples were co-cultured as in Figure 1 in the presence or absence of mTOR inhibitors AZD8055 (500nM) or rapamycin (1μM) and survival was determined as in Figure 1a. Shown are mean ± s.e.m. for N=9 (untreated and RAPA) or N=3 (AZD) samples (upper panel). Similarly treated CLL samples were subjected to western blot and probed for MCL-1. To exclude caspase-mediated MCL-1 breakdown, 5μM Q-VD-OPh was added to all samples during culture when analyzed for MCL-1 levels by western blotting. β-Actin was used as a loading control. Western blot representative for N=6 (lower panel). (f) CLL samples were co-cultured as in Figure 1 in the presence or absence of 1μM PI3K inhibitor CAL101 (idelalisib) and survival was determined as in Figure 1a. Shown are mean ± s.e.m. for N=7 (upper panel). Similarly treated CLL samples were subjected to western blot and probed for MCL-1, as in e. Western blot representative for N=4. *P<0.05; **P<0.01; ***P<0.001 in an ANOVA test with Newman-Keuls post-hoc test (e, f).

