Abstract
Purpose
To evaluate the effect of imaging sequence (spin-echo echo-planar imaging [EPI] and gradient-echo [GRE]) and postprocessing method (2-dimensional [2D] and 3D inversion algorithms) on liver magnetic resonance elastography (MRE) and to validate the diagnostic performance of EPI-MRE3D versus conventional GRE-MRE2D for liver fibrosis staging.
Materials and Methods
Three MRE methods (EPI-MRE3D, EPI-MRE2D, and GRE-MRE2D) were performed on soft and mildly stiff phantoms and 58 patients with chronic liver disease at a 3-Tesla clinical MRI scanner, and stiffness values were compared among the 3 methods. A validation study comprised 73 patients with histological liver fibrosis (F0–4, METAVIR system). Areas under the receiver operating characteristic curves (AUCs) and accuracies for diagnosing significant fibrosis (F3–4) and cirrhosis (F4) were compared between EPI-MRE3D and GRE-MRE2D.
Results
Stiffness values of soft and mildly stiff phantoms were 2.4 kPa and 4.0kPa by EPI-MRE3D; 2.6 kilopascal [kPa] and 4.2kPa by EPI-MRE2D; and 2.7 kPa and 4.2kPa by GRE-MRE2D. In patients, EPI-MRE3D provided significantly lower stiffness values than other methods (p<0.001). However, there was no significant difference between GRE-MRE2D and EPI-MRE2D (p=0.12). The AUCs and accuracies of EPI-MRE3D and GRE-MRE2D were statistically equivalent in the diagnoses of significant fibrosis (F3–4) and cirrhosis (F4) (all p<0.005).
Conclusion
EPI-MRE3D showed lower modestly liver stiffness values than conventional GRE-MRE2D. The diagnostic performances of EPI-MRE3D and GRE-MRE2D were equivalent for liver fibrosis staging.
Keywords: magnetic resonance elastography (MRE), liver fibrosis staging, echo planar imaging (EPI), gradient-echo imaging (GRE), three-dimensional postprocessing
Introduction
The assessment of liver fibrosis is critical for the clinical management of patients with chronic liver disease (1,2). Although histological liver fibrosis assessment by liver biopsy has been widely used and is the referece standard in clinical practice, liver biopsy has limitations including sampling errors, sampling variability, and problems with the reproducibility of liver fibrosis staging (3,4). To address these issues, imaging-based methods have been developed for the estimation of liver fibrosis. Some techniques have utilized T1, T2, and contrast enhancement information to help stage liver fibrosis (5–7). Other techniques have used liver stiffness measurement methods, collectively called elastography, for the noninvasive assessment of liver fibrosis. Several elastography methods have been developed and validated, including ultrasonography-based transient elastography (8) and MR elastography (MRE) (9,10). Recent studies have revealed that MRE has a very high repeatability (11–13) and validity (14–18) for evaluating liver fibrosis (10), and when used for the assessment of viral hepatitis (19–22) and other diffuse liver diseases (23,24).
In MRE, by applying a dynamic harmonic mechanical excitation to the body, the steady-state mechanical response of tissues can be measured using phase-contrast MRI techniques. MRE can be performed using various types of MRI sequences for signal acquisition including gradient-echo (GRE) (25), spin-echo (SE) (26), spin-echo echo-planar imaging (SE-EPI) (27–29), and balanced steady-state free precession (30). Of these sequences, the SE-EPI sequence has the fastest acquisition time (27). Many preliminary validation studies of MRE for liver fibrosis staging were performed using a GRE MRE sequence (GRE-MRE) (17,18), while more recent studies have used an SE-EPI sequence (SE-EPI-MRE) for faster, broader, or more efficient sampling of hepatic tissue than conventional GRE-MRE(10,29,31,32). Stiffness values measured by MRE at a particular frequency of tissue vibration should be identical, regardless of the sequence use (32).
Acquired MRE data are commonly processed by means of a direct inversion algorithm to estimate the shear modulus in tissue (33,34), which can be performed with either a 2-dimensional (2D) or 3D technique. 3D processing methods have been reported to be more precise than 2D methods because they better accommodate complex propagating waves in complex organs (35). It is also important to note that 2D methods can be performed accurately under the assumption that the shear waves in the tissue are propagating within each imaged slice and not obliquely to them (36). Since 3D analysis can require many slices of data for processing, which could result in long acquisition times, SE-EPI for 3D MRE may be the most practical technique for many applications (29,37). However, most previous validation studies of liver fibrosis staging with MRE were performed using a GRE sequence and 2D postprocessing (15–18). It is important to examine and recognize the differences in results obtained from different MRE sequences and postprocessing methods.
Thus, the purpose of this study was to evaluate the effect of imaging sequence and postprocessing method on liver stiffness measurements. We also aimed to validate liver stiffness measured by SE-EPI-MRE and 3D postprocessing by comparing it with conventional GRE-MRE with 2D postprocessing and histopathological fibrosis staging.
Materials and Methods
The protocols for this retrospective study were approved by our institutional review board, and the requirement for informed consent for the use of imaging and clinical data was waived.
Phantom and preliminary clinical studies
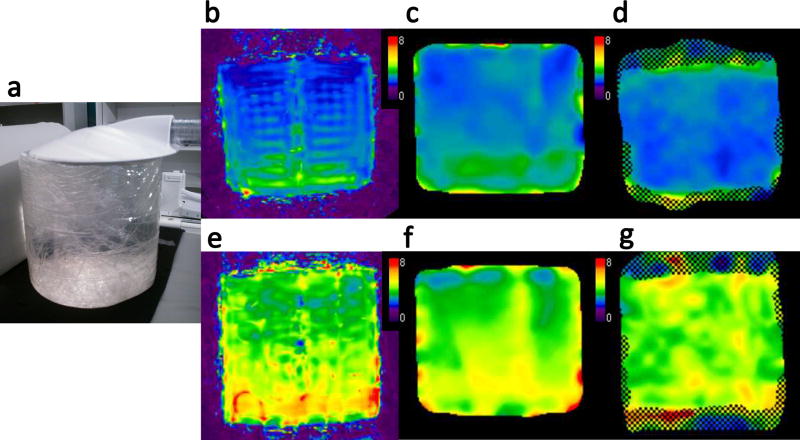
First, to evaluate the effects of imaging sequences and reconstruction algorithms on measured stiffness values, a phantom study was carried out using 3 different protocols: (a) conventional GRE-MRE with a 1-slice acquisition and 2D postprocessing (GRE-MRE2D), and SE-EPI-MRE with a 7-slice acquisition and (b) 2D postprocessing (EPI-MRE2D) and (c) 3D postprocessing (EPI-MRE3D). Cylindrical polyacrylamide gel based soft and mildly stiff tissue mimicking phantoms were created by the polymerisation of acrylamide (6.2% for soft phantom and 7.7% for mild stiff phantom) carried out in water (93.5% for soft phantom and 92.0% for mild stiff phantom) at room temperature using bisacrylamide as the cross linker (0.1%), and ammonium persulfate (0.1%) and tetramethylethylenediamine (0.1%) as a pair of redox initiators (38). The estimated stiffness values of the phantoms using a rheometer were 3.0 kilopascal [kPa] and 4.5 kPa, respectively. The size of each phantom was 12 cm in diameter and 11 cm in height (Figure 1).
Figure 1.
Soft and mildly stiff phantoms (estimated stiffness values of 3 kPa and 4.5 kPa, respectively) 12 cm in diameter and 11 cm in height were vibrated through contact with a pneumatic driver (a). Elastograms of the soft (b–d) and mildly stiff phantoms (e–g) with the 3 imaging methods: SE-EPI-MRE with 3D processing (EPI-MRE3D) (b, e), SE-EPI-MRE with 2D processing (EPI-MRE2D) (c, f), and GRE-MRE with 2D processing (GRE-MRE2D) (d, g). The measured stiffness values of the soft phantom were 2.4 kPa (b), 2.6 kPa (c), and 2.7 kPa (d) for EPI-MRE3D, EPI-MRE2D, and GRE-MRE2D, respectively. The mildly stiff phantom stiffness values were 4.0 kPa (e), 4.2 kPa (f), and 4.2 kPa (g), respectively. EPI-MRE3D demonstrated slightly lower stiffness values than those of the other methods in both the soft and mildly stiff phantoms.
The aforementioned 3 MRE methods were also performed in 58 patients with chronic liver disease. The subjects included 37 men and 21 women who were 70 ± 9 years of age (mean ± standard deviation) (range, 51–91 years) with a mean body mass index (BMI) of 22.9 ± 3.2 kg/m2 (range, 17–30 kg/m2). The types of chronic liver disease included 29 viral hepatitis type C (HCV)-positive patients, 10 viral hepatitis type B (HBV)-positive patients, 6 with alcoholic liver disease, 2 with primary biliary cirrhosis, and 11 patients with other liver diseases.
Validation study for liver fibrosis staging
To validate the EPI-MRE3D stiffness measurements for liver fibrosis staging, we conducted a comparison of the measurement results from GRE-MRE2D and EPI-MRE3D in patients with a known histopathological fibrosis stage. From December 2012 to August 2013, 232 consecutive patients with chronic liver disease underwent abdominal MRI including liver MRE using both the EPI and GRE sequences. Of these patients, 159 were excluded because of unavailable histologic slides of liver tissue within 6 months of the MRE examination (n = 151), MRE failure due to severe hepatic iron deposition resulting in substantially low signal intensity in the liver (n = 6) or massive ascites (n = 2). We finally included 73 patients in the validation study, in whom histological liver fibrosis staging had been performed with a specimen from liver resection (n = 57) or liver biopsy (n = 16). The mean time between tissue sampling and MRE was 10.2 ± 8.4 weeks. The patient demographics were as follows: male-to-female ratio, 56:17; mean age, 68 ± 10 years; age range, 33–83 years; mean BMI, 21.9 ± 3.0 kg/m2; BMI range, 16–31 kg/m2; type of chronic liver disease: 42, HCV-positive; 15, HBV-positive; 6, alcoholic liver disease; 3, a history of autoimmune liver disease; 5, fatty liver disease; and 2, other. Liver fibrosis was graded by using the METAVIR scoring system (F0–4) (39) by assessing hematoxylin-eosin and Masson’s trichrome staining; the results included 5 F0 cases, 10 F1 cases, 14 F2 cases, 18 F3 cases, and 26 F4 cases.
MR elastography
All MRE acquisitions were performed on a 3-Tesla clinical MRI scanner (Discovery MR750; GE Healthcare, Milwaukee, Wisconsin, USA) using a 32-channel phased-array torso coil. The active acoustic generator was placed outside the MRI examination room and generated 60-Hz pneumatic vibrations that were delivered to a passive driver located inside the scan room via a plastic tube (10). The generator, passive driver, and sequences were developed at the Mayo Clinic (Rochester, MN, USA) (anonymized). For the phantom studies, the passive driver was placed on top of the phantom and the imaging parameters for SE-EPI-MRE were as follows: repetition time (TR)/echo time (TE) = 500/50 ms, slice thickness = 5 mm, number of slices = 7, field-of-view (FOV) = 40 × 40 cm2, matrix = 96 × 96, 1 acquisitions for phantoms and 2 acquisitions for patients, 2 NEX, parallel imaging factor = 2, and 3 motion-encoding gradient directions with 4 phase offsets. The imaging parameters for GRE-MRE were as follows: TR/TE = 50/20 ms; slice thickness = 5 mm; number of slices = 1, flip angle = 23 degrees, FOV = 35 × 35 cm2, matrix = 256 × 80, 1 acquisition for both phantoms and patients, 1 NEX, parallel imaging factor = 2, and 1 motion-encoding gradient direction (craniocaudal) with 4 phase offsets. The middle slice of 7 slices of SE-EPI-MRE was set to be oriented to the same level of 1 slice of GRE-MRE.
The data of GRE-MRE was postprocessed by using a 2D direct inversion algorithm. In SE-EPI-MRE, the data was postprocessed by both 2D (40) and 3D direct inversion algorithms (41). The placement of regions of interest (ROI) was performed by an abdominal radiologist with careful attention to avoid heterogeneous wave propagation and to place the ROIs at the same level in both phantoms. For ROIs placement, the middle slice of 2D and 3D postprocessed images of SE-EPI-MRE located at the same level of 1 slice of GRE-MRE were selected. Image acquisitions were performed 3 times and the phantom stiffness values were calculated as the average of the mean values from the ROIs for the 3 experiments.
For the clinical liver MRE data, the same imaging parameters were used. The passive driver was placed across the subject’s right anterior chest wall to deliver transcostal vibrations. Two abdominal radiologists, with 7 and 10 years of experience in abdominal MR imaging, evaluated the stiffness maps independently. ROIs were drawn in the right lobe of the liver of the stiffness maps. During SE-EPI-MRE ROI placement, one middle slice of the 7 slices located at the same level as the GRE-MRE was selected. As a rule, the ROIs were 1.0–1.5 cm2 in area and placed near the anterior edge of the liver where the penetrating wave was well visualized and no interference was observed in the phase image.
Statistical analysis
In the phantom and preliminary clinical studies, the differences in measured stiffness values of the phantoms and the livers of 58 patients were compared between any 2 of the 3 methods (EPI-MRE2D, EPI-MRE3D, and GRE-MRE2D) with Bland-Altman plots. The stiffness values of the livers were compared among the 3 methods by using the Freedman test and a post hoc Wilcoxon signed-rank test for each observer. The interobserver agreement of the measurements was evaluated by using an intraclass correlation coefficient (ICC) analysis of the 3 methods. The ICC values were interpreted as follows: ICC = 0–0.20, slight agreement; ICC = 0.21–0.40, fair agreement; ICC = 0.41–0.60, moderate agreement; ICC = 0.61–0.80, substantial agreement; and ICC = 0.81–1.0, strong agreement (42).
In the validation study, a comparison of the diagnostic performance of the 2 methods was performed by using a receiver operating characteristic (ROC) curve analysis. We compared areas under the ROC curves (AUCs), as well as accuracies derived from optimal cut-off values that maximized the Youden index (43) for discriminating F3–4 (significant fibrosis) from F0–2 and for discriminating F4 (cirrhosis) from F0–3. The equivalence in accuracy for diagnosing F3–4 and F4 at the optimal cut-off value between the 2 methods was tested with a modified McNemar’s test. (44). The equality of the AUC values was tested by using two one-sided tests, in which open source software was used with modification (45). These tests were conducted to show the equivalence of the 2 methods within a given range of ± 5% for accuracy and ± 0.05 for the AUC.
Statistical analyses were performed using JMP software version 9 (SAS Institute Inc., Cary, NC, USA) or R version 3.1.1 (http://www.r-statistics.com). The statistical significance for all analyses was set at p < 0.05.
Results
The phantom and preliminary clinical studies
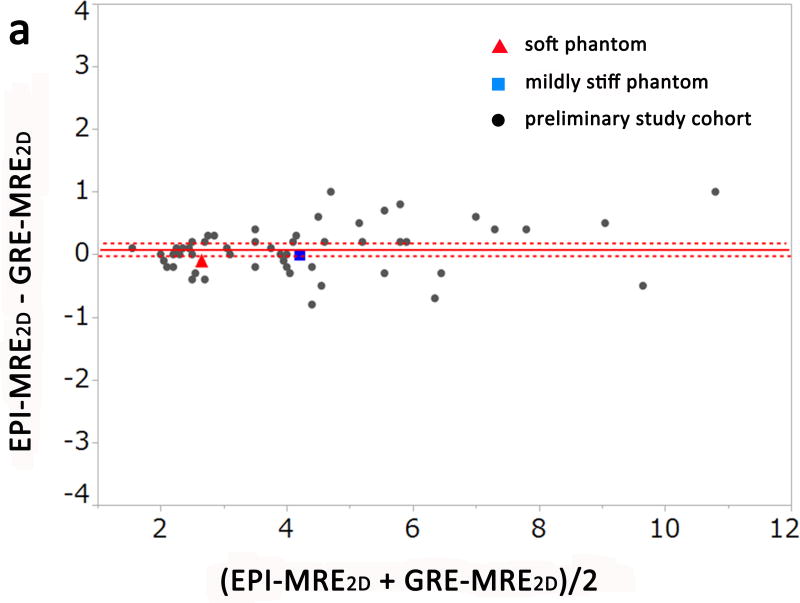
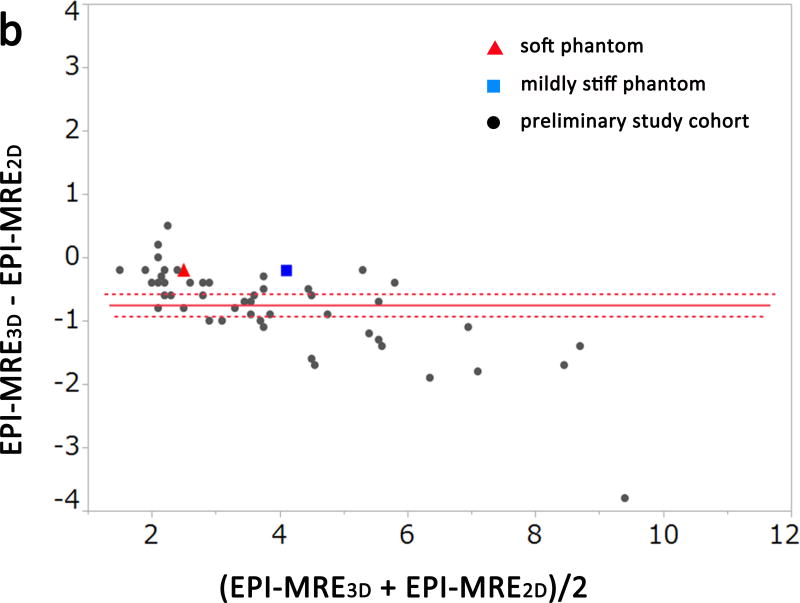
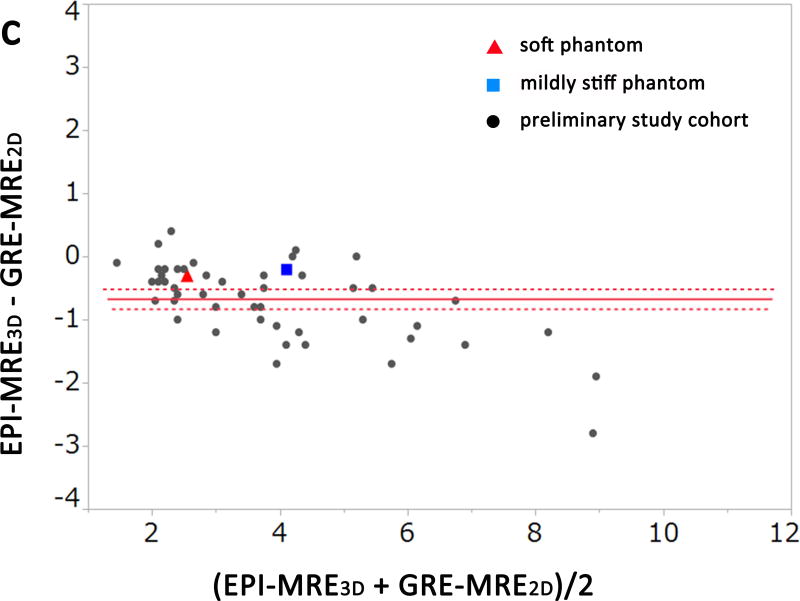
The results of the experimental phantom study and preliminary clinical study are shown in Figures. 1 and 2a–c (Bland-Altman plots). The measured stiffness values of the soft phantom were 2.4 kPa, 2.6 kPa, and 2.7 kPa for EPI-MRE3D, EPI-MRE2D, and GRE-MRE2D, respectively. The mildly stiff phantom demonstrated values of 4.0 kPa, 4.2 kPa, and 4.2 kPa, respectively (Figure 1).
Figure 2.
Bland-Altman plots of the measured stiffness values of the phantoms and the preliminary study cohort for observer 1. There was no significant difference between EPI-MRE2D and GRE-MRE2D (a, p = 0.101). Meanwhile, liver stiffness values from EPI-MRE3D were significantly lower than those of the other methods (b and c, p < 0.001).
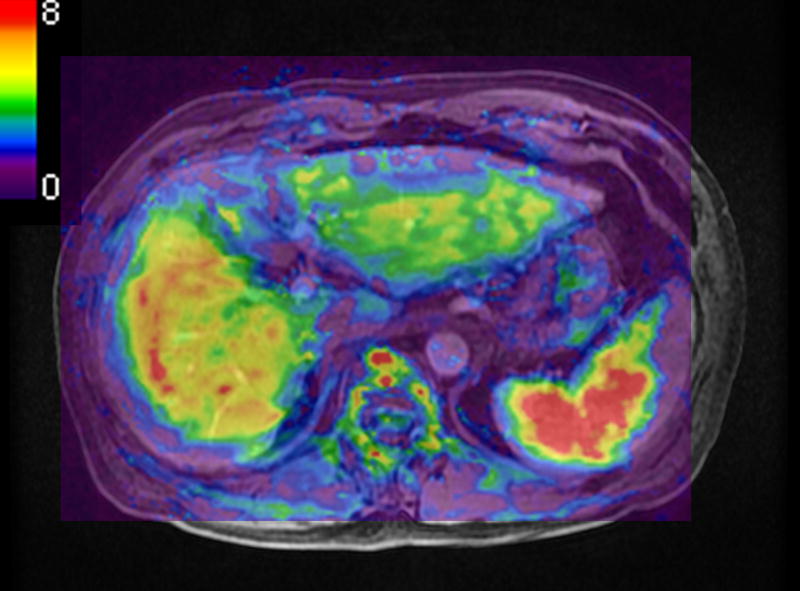
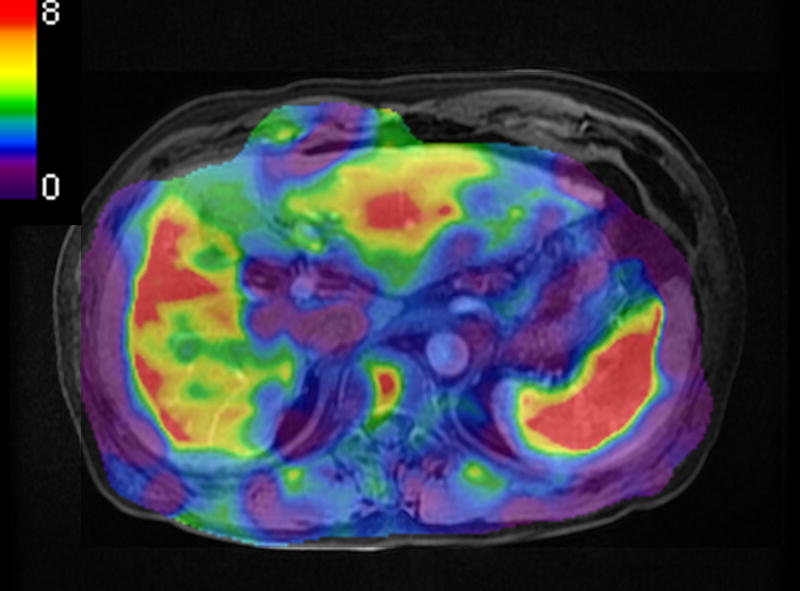
A significant difference was observed among the 3 methods for the measured stiffness values of the liver for both observers in the preliminary study (p < 0.001). In the post hoc analysis, there was no significant difference between GRE-MRE2D and EPI-MRE2D for either observer (Figure 2a, p=0.12). However, liver stiffness values from EPI-MRE3D were significantly lower than those of the other methods (p < 0.001) (Figure 2b and Figure 2c). Figure 3 shows a case in which liver stiffness value measured on EPI-MRE3D is lower than that of GRE-MRE2D.
Figure 3.
A 65 year-old man with chronic viral hepatitis type-C and cirrhosis. A measured liver stiffness value of EPI-MRE3D (a, 4.5 kPa) was lower than that of GRE-MRE2D (b, 6.5 kPa).
Interobserver agreements were strong for all 3 methods. For GRE-MRE2D, the mean ICC = 0.963 [95% CI, 0.953–0.971]; EPI-MRE2D was 0.923 [95% CI, 0.912–0.937]; and EPI-MRE3D was 0.956 [95% CI, 0.943–0.966].
Diagnostic performance for liver fibrosis in the validation study
The AUCs for discriminating F3–4 (significant fibrosis) from F0–2 for EPI-MRE3D were 0.924 [95% CI, 0.871–0.975] and 0.932 [0.852–0.970] for observer 1 and 2, respectively; and 0.920 [0.870–0.975] and 0.943 [0.869–0.976] for GRE-MRE2D (Table 1). For discriminating F4 (cirrhosis) from F0–3, the AUCs were 0.952 [0.890–0.980] and 0.935 [0.861–0.971] for observer 1 and 2 for EPI-MRE3D, respectively; and 0.964 [0.894–0.987] and 0.950 [0.880–0.980] for GRE-MRE2D. The AUCs of the 2 methods were statistically equivalent within the given range of ± 0.05 (p < 0.001) (Figure 4) (Table 1).
Table 1.
Diagnostic performance for liver fibrosis in validation data set
| Methods | EPI-MRE3D | GRE-MRE2D | p value for equality† |
|
|---|---|---|---|---|
| F3–4 vs. F0–2 (n = 73)* | ||||
| reviewer 1 | ||||
| AUC [95% CI] | 0.924 [0.871–0.975] | 0.920 [0.870–0.975] | < 0.001 | |
| optimal cut-off [kPa] | 3.1 | 3.4 | ||
| accuracy | 89% (65/73) | 86% (63/73) | 0.004 | |
| reviewer 2 | ||||
| AUC [95% CI] | 0.932 [0.852–0.970] | 0.943 [0.869–0.976] | < 0.001 | |
| optimal cut-off [kPa] | 3.3 | 3.6 | ||
| accuracy | 86% (63/73) | 88% (64/73) | 0.001 | |
|
| ||||
| F4 vs. F0–3 (n = 73)* | ||||
| reviewer 1 | ||||
| AUC [95% CI] | 0.952 [0.890–0.980] | 0.964 [0.894–0.987] | < 0.001 | |
| optimal cut-off [kPa] | 3.4 | 3.9 | ||
| accuracy | 86% (63/73) | 92% (67/73) | < 0.001 | |
| reviewer 2 | ||||
| AUC [95% CI] | 0.935 [0.861–0.971] | 0.950 [0.880–0.980] | < 0.001 | |
| optimal cut-off [kPa] | 3.4 | 4.0 | ||
| accuracy | 88% (64/73) | 89% (65/73) | < 0.001 | |
EPI-MRE3D: MR elastography with spin-echo echo-planar imaging sequence and 3D postprocessing algorithm; GRE-MRE2D: MR elastography with gradient-echo sequence and 2D post processing algorithm; AUC: area under the receiver operating characteristic curve; CI: confidence interval; kPa: kilopascal
Liver fibrosis was graded based on the METAVIR scoring system (F0–4). Optimal cut-off values that maximized the Youden index were calculated for discriminating F3–4 (significant fibrosis) from F0–2 and for discriminating F4 (cirrhosis) from F0–3.
The equality of the AUC values and accuracies were tested.
Figure 4.
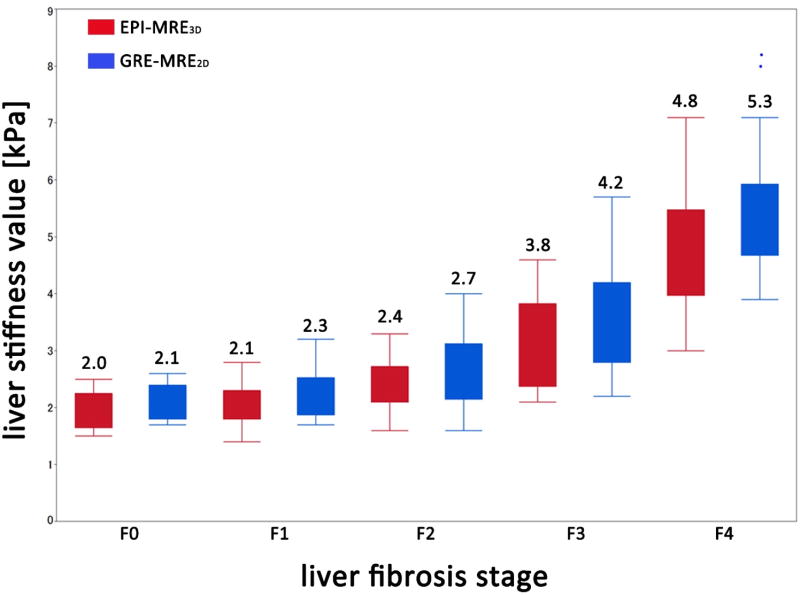
Box-and-whisker plots of the distribution of measured liver stiffness values of the 5 liver fibrosis stages (F0–4) from EPI-MRE3D (red bar) and GRE-MRE2D (blue bar) for observer 1. Strong correlations with histological fibrosis stage were observed for EPI-MRE3D (correlation coefficient = 0.850) and GRE-MRE2D (0.975). The numbers reported above the bars are the means.
The equivalence of the accuracies of the two techniques for discriminating the various fibrosis stage groups were shown statistically, in which a p-value less than 0.05 means “statistically equivalent”. The discrimination ability of EPI-MRE3D and GRE-MRE2D between F0–2 and F3–4 was 89% (65/73) versus 86% (63/73) for observer 1 (p = 0.004), respectively; and 86% (63/73) versus 88% (67/73) for observer 2 (p = 0.001). Similarly, the discrimination ability of EPI-MRE3D and GRE-MRE2D between F0–3 and F4 was also equivalent: 86% (63/73) versus 92% (67/73) for observer 1 (p < 0.001), respectively; and 88% (64/73) versus 89% (65/73) (p < 0.001) for observer 2.
Discussion
In the phantom study and the intra-individual comparisons in the clinical case portion of this study, we demonstrated that (1) stiffness values of EPI-MRE3D were significantly lower than those of the other methods (EPI-MRE2D and GRE-MRE2D) in phantoms and patients, whereas (2) there was no significant difference between the 2 methods with 2D processing. The former result is in agreement with a recent report by Shi et al (46), in which 3D liver MRE with SE-EPI showed lower liver stiffness values and a similar diagnostic accuracy of liver fibrosis to 2D liver MRE with GRE sequence. The latter result is also consistent with a recent study by Wegner et al (32), in which liver stiffness values measured on 2D liver MRE with SE-EPI was not different from that with GRE sequence. This implies that the lower stiffness results were caused by the 3D processing procedure (35). A theoretical explanation is that the 3D inversion algorithm is able to account for propagating waves that are not parallel to the image plane. The 2D algorithm assumes all waves propagate in the imaging plane, which can lead to overestimation of the wavelengths of waves intersecting the imaging plane obliquely, and consequently an overestimation of liver stiffness (36,37).
Although statistically significant difference in measured liver stiffness value between EPI-MRE2D and GRE-MRE2D was observed in this study, the difference between 2D and 3D postprocessing was typically small (about 5–10% in soft phantom and liver with low stiffness value and about 10–20% in stiff phantom and liver with high stiffness value). As expected, the differences are somewhat larger in very stiff livers, where diffraction effects are strong, but the effect on interpretation in this range is not important. Also, the difference is similar in size to the test-retest differences that have been reported for clinical MRE (12,17,32,46).
We found equivalent diagnostic performances between EPI-MRE3D and GRE-MRE2D for the diagnoses of F3–4 (significant fibrosis) and F4 (cirrhosis) in 73 patients with chronic liver disease. This result is in agreement with a recent report (46).
Iron deposition in the liver is a major limitation of MRE, which decreases the signal intensities of the liver due to reduced T2* and susceptibility effects in both GRE and SE-EPI acquisitions. We excluded 6 cases in which MRE was not assessable (only the GRE-MRE was not assessable in 3 cases; only the SE-EPI-MRE in 1 case; both methods in 2 cases). GRE-MRE can be more vulnerable to the effects of iron deposition than SE-EPI-MRE and, in fact, recent studies showed that lower failure rate of liver MRE with SE-EPI than with GRE (32,46). In addition to potentially reduced susceptibility effects, the advantages of EPI-MRE3D include increased signal and better illumination with fewer artifacts (10) and reduced acquisition time (31). Considering the equivalent diagnostic ability and wider anatomical coverage, SE-EPI-MRE could be a better choice than GRE-MRE in many applications.
There were several limitations in our study. First, the sample size of this study was relatively small, especially in patients with F0 (n = 5) and F1 (n = 10) disease, so further study with a larger patient cohort will be needed to validate these results and to compare the capability of these MRE techniques for differentiating lower grades of fibrosis. Second, only small number of patients with fatty liver disease (5/76 in validation study) was included in this study. Nonalcoholic fatty liver disease or steatohepatitis is a major cause of chronic liver disease in worldwide (47) and recent studied have shown utility of 3D MRE technique in nonalcoholic fatty liver disease or steatohepatitis patients (47,48). ROI size used in this study would be small for a stable stiffness value measurement because a substantial heterogeneity of liver parenchyma is often seen on elastograms. However, area for ROI placement, selected at the anterior edge of the liver where the penetrating wave was well visualized, was usually limited space, and larger ROI placement would be difficult. Measurement reproducibility and repeatability were not studied, however, recent studies demonstrated excellent reproducibility of 2D liver MRE with SE-EPI (32) and 3D liver MRE with SE-EPI (46) as well as conventional 2D liver MRE with GRE. The use of biopsy as the reference standard in this study for some patients (n = 16) may also have been a limitation of this study since sampling errors are known to occur with biopsies (3,4).
In conclusion, EPI-MRE3D showed lower modestly liver stiffness values compared with conventional GRE-MRE2D. The diagnostic performance of EPI-MRE3D for liver fibrosis staging was equivalent to that of GRE-MRE2D.
Acknowledgments
We appreciate the assistance of Scott Kruse from the Mayo Clinic and Tetsuya Wakayama from GE Healthcare for setting up the equipment for MRE. We also appreciate the assistance of Mikio Suga from Chiba University Biomedical Imaging Lab for providing the original columnar polyacrylamide gel phantoms for the experimental phantom study and Takashi Kakegawa, Satoshi Ikenaga, and Hiroshi Kumagai for their cooperation in the experimental and clinical studies.
Financial disclosure: National Institutes of Health R01 Grant EB001981
Footnotes
Conflicts of Interest: RLE and KJG hold patents and have a financial interest through royalties related to MRE technology.
References
- 1.Heidelbaugh JJ, Sherbondy M. Cirrhosis and chronic liver failure: part II. Complications and treatment. American family physician. 2006;74(5):767–776. [PubMed] [Google Scholar]
- 2.Hernandez-Gea V, Friedman SL. Pathogenesis of liver fibrosis. Annual review of pathology. 2011;6:425–456. doi: 10.1146/annurev-pathol-011110-130246. [DOI] [PubMed] [Google Scholar]
- 3.Regev A, Berho M, Jeffers LJ, et al. Sampling error and intraobserver variation in liver biopsy in patients with chronic HCV infection. The American journal of gastroenterology. 2002;97(10):2614–2618. doi: 10.1111/j.1572-0241.2002.06038.x. [DOI] [PubMed] [Google Scholar]
- 4.Ratziu V, Charlotte F, Heurtier A, et al. Sampling variability of liver biopsy in nonalcoholic fatty liver disease. Gastroenterology. 2005;128(7):1898–1906. doi: 10.1053/j.gastro.2005.03.084. [DOI] [PubMed] [Google Scholar]
- 5.Chow AM, Gao DS, Fan SJ, et al. Measurement of liver T(1) and T(2) relaxation times in an experimental mouse model of liver fibrosis. Journal of magnetic resonance imaging : JMRI. 2012;36(1):152–158. doi: 10.1002/jmri.23606. [DOI] [PubMed] [Google Scholar]
- 6.Goshima S, Kanematsu M, Kobayashi T, et al. Staging hepatic fibrosis: computer-aided analysis of hepatic contours on gadolinium ethoxybenzyl diethylenetriaminepentaacetic acid-enhanced hepatocyte-phase magnetic resonance imaging. Hepatology. 2012;55(1):328–329. doi: 10.1002/hep.24677. [DOI] [PubMed] [Google Scholar]
- 7.Motosugi U, Ichikawa T, Araki T. Rules, roles, and room for discussion in gadoxetic acid-enhanced magnetic resonance liver imaging: current knowledge and future challenges. Magn Reson Med Sci. 2013;12(3):161–175. doi: 10.2463/mrms.2012-0085. [DOI] [PubMed] [Google Scholar]
- 8.Castera L, Vergniol J, Foucher J, et al. Prospective comparison of transient elastography, Fibrotest, APRI, and liver biopsy for the assessment of fibrosis in chronic hepatitis C. Gastroenterology. 2005;128(2):343–350. doi: 10.1053/j.gastro.2004.11.018. [DOI] [PubMed] [Google Scholar]
- 9.Rouviere O, Yin M, Dresner MA, et al. MR elastography of the liver: preliminary results. Radiology. 2006;240(2):440–448. doi: 10.1148/radiol.2402050606. [DOI] [PubMed] [Google Scholar]
- 10.Venkatesh SK, Yin M, Ehman RL. Magnetic resonance elastography of liver: technique, analysis, and clinical applications. Journal of magnetic resonance imaging : JMRI. 2013;37(3):544–555. doi: 10.1002/jmri.23731. [DOI] [PMC free article] [PubMed] [Google Scholar]
- 11.Hines CD, Bley TA, Lindstrom MJ, Reeder SB. Repeatability of magnetic resonance elastography for quantification of hepatic stiffness. J Magn Reson Imaging. 2010;31(3):725–731. doi: 10.1002/jmri.22066. [DOI] [PMC free article] [PubMed] [Google Scholar]
- 12.Shire NJ, Yin M, Chen J, et al. Test-retest repeatability of MR elastography for noninvasive liver fibrosis assessment in hepatitis C. Journal of magnetic resonance imaging : JMRI. 2011;34(4):947–955. doi: 10.1002/jmri.22716. [DOI] [PMC free article] [PubMed] [Google Scholar]
- 13.Venkatesh SK, Wang G, Teo LL, Ang BW. Magnetic resonance elastography of liver in healthy asians: normal liver stiffness quantification and reproducibility assessment. Journal of magnetic resonance imaging : JMRI. 2014;39(1):1–8. doi: 10.1002/jmri.24084. [DOI] [PubMed] [Google Scholar]
- 14.Huwart L, Sempoux C, Vicaut E, et al. Magnetic resonance elastography for the noninvasive staging of liver fibrosis. Gastroenterology. 2008;135(1):32–40. doi: 10.1053/j.gastro.2008.03.076. [DOI] [PubMed] [Google Scholar]
- 15.Asbach P, Klatt D, Schlosser B, et al. Viscoelasticity-based staging of hepatic fibrosis with multifrequency MR elastography. Radiology. 2010;257(1):80–86. doi: 10.1148/radiol.10092489. [DOI] [PubMed] [Google Scholar]
- 16.Ichikawa S, Motosugi U, Ichikawa T, et al. Magnetic resonance elastography for staging liver fibrosis in chronic hepatitis C. Magnetic resonance in medical sciences : MRMS : an official journal of Japan Society of Magnetic Resonance in Medicine. 2012;11(4):291–297. doi: 10.2463/mrms.11.291. [DOI] [PubMed] [Google Scholar]
- 17.Venkatesh SK, Wang G, Lim SG, Wee A. Magnetic resonance elastography for the detection and staging of liver fibrosis in chronic hepatitis B. European radiology. 2014;24(1):70–78. doi: 10.1007/s00330-013-2978-8. [DOI] [PubMed] [Google Scholar]
- 18.Kim BH, Lee JM, Lee YJ, et al. MR elastography for noninvasive assessment of hepatic fibrosis: experience from a tertiary center in Asia. Journal of magnetic resonance imaging : JMRI. 2011;34(5):1110–1116. doi: 10.1002/jmri.22723. [DOI] [PubMed] [Google Scholar]
- 19.Shi Y, Guo Q, Xia F, et al. MR elastography for the assessment of hepatic fibrosis in patients with chronic hepatitis B infection: does histologic necroinflammation influence the measurement of hepatic stiffness? Radiology. 2014;273(1):88–98. doi: 10.1148/radiol.14132592. [DOI] [PMC free article] [PubMed] [Google Scholar]
- 20.Ichikawa S, Motosugi U, Ichikawa T, et al. Magnetic resonance elastography for staging liver fibrosis in chronic hepatitis C. Magn Reson Med Sci. 2012;11(4):291–297. doi: 10.2463/mrms.11.291. [DOI] [PubMed] [Google Scholar]
- 21.Venkatesh SK, Xu S, Tai D, Yu H, Wee A. Correlation of MR elastography with morphometric quantification of liver fibrosis (Fibro-C-Index) in chronic hepatitis B. Magn Reson Med. 2014;72(4):1123–1129. doi: 10.1002/mrm.25002. [DOI] [PubMed] [Google Scholar]
- 22.Ichikawa S, Motosugi U, Morisaka H, et al. Validity and Reliability of Magnetic Resonance Elastography for Staging Hepatic Fibrosis in Patients with Chronic Hepatitis B. Magn Reson Med Sci. 2015;14(3):211–221. doi: 10.2463/mrms.2014-0150. [DOI] [PubMed] [Google Scholar]
- 23.Matsuda S, Motosugi U, Kato R, et al. Hepatic Amyloidosis with an Extremely High Stiffness Value on Magnetic Resonance Elastography. Magn Reson Med Sci. 2016 doi: 10.2463/mrms.ci.2015-0133. [DOI] [PMC free article] [PubMed] [Google Scholar]
- 24.Kim D, Kim WR, Talwalkar JA, Kim HJ, Ehman RL. Advanced fibrosis in nonalcoholic fatty liver disease: noninvasive assessment with MR elastography. Radiology. 2013;268(2):411–419. doi: 10.1148/radiol.13121193. [DOI] [PMC free article] [PubMed] [Google Scholar]
- 25.Yin M, Talwalkar JA, Glaser KJ, et al. Assessment of hepatic fibrosis with magnetic resonance elastography. Clinical gastroenterology and hepatology : the official clinical practice journal of the American Gastroenterological Association. 2007;5(10):1207–1213. e1202. doi: 10.1016/j.cgh.2007.06.012. [DOI] [PMC free article] [PubMed] [Google Scholar]
- 26.Huwart L, Sempoux C, Salameh N, et al. Liver fibrosis: noninvasive assessment with MR elastography versus aspartate aminotransferase-to-platelet ratio index. Radiology. 2007;245(2):458–466. doi: 10.1148/radiol.2452061673. [DOI] [PubMed] [Google Scholar]
- 27.Huwart L, Salameh N, ter Beek L, et al. MR elastography of liver fibrosis: preliminary results comparing spin-echo and echo-planar imaging. European radiology. 2008;18(11):2535–2541. doi: 10.1007/s00330-008-1051-5. [DOI] [PubMed] [Google Scholar]
- 28.Murphy MC, Huston J, 3rd, Jack CR, Jr, et al. Decreased brain stiffness in Alzheimer's disease determined by magnetic resonance elastography. Journal of magnetic resonance imaging : JMRI. 2011;34(3):494–498. doi: 10.1002/jmri.22707. [DOI] [PMC free article] [PubMed] [Google Scholar]
- 29.Shin SU, Lee JM, Yu MH, et al. Prediction of Esophageal Varices in Patients with Cirrhosis: Usefulness of Three-dimensional MR Elastography with Echo-planar Imaging Technique. Radiology. 2014;272(1):143–153. doi: 10.1148/radiol.14130916. [DOI] [PMC free article] [PubMed] [Google Scholar]
- 30.Bieri O, Maderwald S, Ladd ME, Scheffler K. Balanced alternating steady-state elastography. Magn Reson Med. 2006;55(2):233–241. doi: 10.1002/mrm.20812. [DOI] [PubMed] [Google Scholar]
- 31.Nedredal GI, Yin M, McKenzie T, et al. Portal hypertension correlates with splenic stiffness as measured with MR elastography. Journal of magnetic resonance imaging : JMRI. 2011;34(1):79–87. doi: 10.1002/jmri.22610. [DOI] [PMC free article] [PubMed] [Google Scholar]
- 32.Wagner M, Besa C, Bou Ayache J, et al. Magnetic Resonance Elastography of the Liver: Qualitative and Quantitative Comparison of Gradient Echo and Spin Echo Echoplanar Imaging Sequences. Investigative radiology. 2016 doi: 10.1097/RLI.0000000000000269. [DOI] [PMC free article] [PubMed] [Google Scholar]
- 33.Manduca A, Oliphant TE, Dresner MA, et al. Magnetic resonance elastography: non-invasive mapping of tissue elasticity. Med Image Anal. 2001;5(4):237–254. doi: 10.1016/s1361-8415(00)00039-6. [DOI] [PubMed] [Google Scholar]
- 34.Park E, Maniatty AM. Shear modulus reconstruction in dynamic elastography: time harmonic case. Physics in medicine and biology. 2006;51(15):3697–3721. doi: 10.1088/0031-9155/51/15/007. [DOI] [PubMed] [Google Scholar]
- 35.Hamhaber U, Sack I, Papazoglou S, Rump J, Klatt D, Braun J. Three-dimensional analysis of shear wave propagation observed by in vivo magnetic resonance elastography of the brain. Acta biomaterialia. 2007;3(1):127–137. doi: 10.1016/j.actbio.2006.08.007. [DOI] [PubMed] [Google Scholar]
- 36.Glaser KJ, Manduca A, Ehman RL. Review of MR elastography applications and recent developments. Journal of magnetic resonance imaging : JMRI. 2012;36(4):757–774. doi: 10.1002/jmri.23597. [DOI] [PMC free article] [PubMed] [Google Scholar]
- 37.Shi Y, Glaser KJ, Venkatesh SK, Ben-Abraham EI, Ehman RL. Feasibility of using 3D MR elastography to determine pancreatic stiffness in healthy volunteers. Journal of magnetic resonance imaging : JMRI. 2014 doi: 10.1002/jmri.24572. [DOI] [PMC free article] [PubMed] [Google Scholar]
- 38.Kumar K, Andrews M, Jayashankar V, Mishra A, Suresh S. Improvement in diagnosis of breast tumour using ultrasound elastography and echography: A phantom based analysis. Biomedical imaging and intervention journal. 2009;5(4):e30. doi: 10.2349/biij.5.4.e30. [DOI] [PMC free article] [PubMed] [Google Scholar]
- 39.Intraobserver and interobserver variations in liver biopsy interpretation in patients with chronic hepatitis C. The French METAVIR Cooperative Study Group. Hepatology. 1994;20(1 Pt 1):15–20. [PubMed] [Google Scholar]
- 40.Dzyubak B, Glaser K, Yin M, et al. Automated liver stiffness measurements with magnetic resonance elastography. J Magn Reson Imaging. 2013;38(2):371–379. doi: 10.1002/jmri.23980. [DOI] [PMC free article] [PubMed] [Google Scholar]
- 41.Shi Y, Glaser KJ, Venkatesh SK, Ben-Abraham EI, Ehman RL. Feasibility of using 3D MR elastography to determine pancreatic stiffness in healthy volunteers. J Magn Reson Imaging. 2015;41(2):369–375. doi: 10.1002/jmri.24572. [DOI] [PMC free article] [PubMed] [Google Scholar]
- 42.Landis JR, Koch GG. The measurement of observer agreement for categorical data. Biometrics. 1977;33(1):159–174. [PubMed] [Google Scholar]
- 43.Youden WJ. Index for rating diagnostic tests. Cancer. 1950;3(1):32–35. doi: 10.1002/1097-0142(1950)3:1<32::aid-cncr2820030106>3.0.co;2-3. [DOI] [PubMed] [Google Scholar]
- 44.Liu JP, Hsueh HM, Hsieh E, Chen JJ. Tests for equivalence or non-inferiority for paired binary data. Statistics in medicine. 2002;21(2):231–245. doi: 10.1002/sim.1012. [DOI] [PubMed] [Google Scholar]
- 45.Robin X, Turck N, Hainard A, et al. pROC: an open-source package for R and S+ to analyze and compare ROC curves. BMC bioinformatics. 2011;12:77. doi: 10.1186/1471-2105-12-77. [DOI] [PMC free article] [PubMed] [Google Scholar]
- 46.Shi Y, Xia F, Li QJ, et al. Magnetic Resonance Elastography for the Evaluation of Liver Fibrosis in Chronic Hepatitis B and C by Using Both Gradient-Recalled Echo and Spin-Echo Echo Planar Imaging: A Prospective Study. The American journal of gastroenterology. 2016 doi: 10.1038/ajg.2016.56. [DOI] [PubMed] [Google Scholar]
- 47.Cui J, Heba E, Hernandez C, et al. Magnetic resonance elastography is superior to acoustic radiation force impulse for the Diagnosis of fibrosis in patients with biopsy-proven nonalcoholic fatty liver disease: A prospective study. Hepatology. 2016;63(2):453–461. doi: 10.1002/hep.28337. [DOI] [PMC free article] [PubMed] [Google Scholar]
- 48.Loomba R, Cui J, Wolfson T, et al. Novel 3D Magnetic Resonance Elastography for the Noninvasive Diagnosis of Advanced Fibrosis in NAFLD: A Prospective Study. The American journal of gastroenterology. 2016;111(7):986–994. doi: 10.1038/ajg.2016.65. [DOI] [PMC free article] [PubMed] [Google Scholar]


