This article provides an overview of US- and MR-based elastographic techniques, which are emerging to have practical clinical effects on diagnosis and management of patients with chronic liver disease and are replacing liver biopsy as noninvasive tools for assessment of hepatic fibrosis.
Abstract
Chronic liver disease has multiple causes, many of which are increasing in prevalence. The final common pathway of chronic liver disease is tissue destruction and attempted regeneration, a pathway that triggers fibrosis and eventual cirrhosis. Assessment of fibrosis is important not only for diagnosis but also for management, prognostic evaluation, and follow-up of patients with chronic liver disease. Although liver biopsy has traditionally been considered the reference standard for assessment of liver fibrosis, noninvasive techniques are the emerging focus in this field. Ultrasound-based elastography and magnetic resonance (MR) elastography are gaining popularity as the modalities of choice for quantifying hepatic fibrosis. These techniques have been proven superior to conventional cross-sectional imaging for evaluation of fibrosis, especially in the precirrhotic stages. Moreover, elastography has added utility in the follow-up of previously diagnosed fibrosis, the assessment of treatment response, evaluation for the presence of portal hypertension (spleen elastography), and evaluation of patients with unexplained portal hypertension. In this article, a brief overview is provided of chronic liver disease and the tools used for its diagnosis. Ultrasound-based elastography and MR elastography are explored in depth, including a brief glimpse into the evolution of elastography. Elastography is based on the principle of measuring tissue response to a known mechanical stimulus. Specific elastographic techniques used to exploit this principle include MR elastography and ultrasonography-based static or quasistatic strain imaging, one-dimensional transient elastography, point shear-wave elastography, and supersonic shear-wave elastography. The advantages, limitations, and pitfalls of each modality are emphasized.
©RSNA, 2016
See discussion on this article by Barr.
SA-CME LEARNING OBJECTIVES
After completing this journal-based SA-CME activity, participants will be able to:
■ Describe the advantages and disadvantages of the available tests for assessment of hepatic fibrosis.
■ Discuss the utility of US elastography and MR elastography in the staging of liver fibrosis.
■ Recognize the pitfalls of elastography.
Introduction
Most forms of chronic liver disease culminate in a final common pathway of progressive fibrosis and, ultimately, cirrhosis. Causes of chronic liver disease include viral infection, alcohol abuse, nonalcoholic fatty liver disease, biliary disease, autoimmune disease, genetic causes, and metabolic disorders, among others (1). These insults cause inflammation and tissue destruction, followed by attempts at regeneration and healing. Repeated episodes of tissue injury and healing eventually result in fibrosis and cirrhosis.
According to the Centers for Disease Control and Prevention (2), an estimated 240 million people in the world have chronic hepatitis B virus infection, including as many as 1.4 million people in the United States. An estimated 160 million individuals worldwide have hepatitis C, including approximately 3.2 million U.S. residents (2). The prevalence of nonalcoholic fatty liver disease (directly linked to obesity, diabetes, and dyslipidemia) is estimated to be 27%–34% in the United States (2). Overall, an estimated 30 million Americans have chronic liver disease (2).
The prognosis and management of liver disease depend on the stage and progression of fibrosis (3). Advanced fibrosis is an independent risk factor for development of hepatocellular carcinoma (4). Furthermore, in patients with a small hepatocellular carcinoma, the outcomes of tumor resection are dependent on the status of the liver parenchyma and fibrosis (5). Thus, it is vital to accurately stage the degree of fibrosis in patients with chronic liver disease. Liver biopsy is considered the reference standard for assessment of fibrosis (6). Nevertheless, liver biopsy is an invasive procedure that carries a fair risk of morbidity and a small risk of mortality. With the rising prevalence of chronic liver disease, interest is increasing in the development of noninvasive methods of estimation of liver fibrosis. Evidence is growing that elastography is a safe, noninvasive, and reliable option for the evaluation of fibrosis in patients with chronic liver disease.
Nonelastographic Evaluation of Chronic Liver Disease
Liver Biopsy
Liver biopsy is the current reference standard for diagnosis of hepatic fibrosis. Liver biopsy is an invasive procedure that involves core sampling of at least five portal tracts; sampling of greater than 11 portal tracts is considered optimal (7). Each core sample should be at least 2 cm long for reliable diagnosis.
Commonly used fibrosis staging systems include the METAVIR system, the Ishak system, the Knodell score or histology activity index, and the Batts-Ludwig system. Among these systems, the METAVIR and Ishak systems are most frequently used for grading activity and staging fibrosis (8). Although the METAVIR system was developed primarily for use in viral hepatitis, its use has expanded, and it is commonly used for the assessment of other chronic liver diseases.
Although liver biopsy is the benchmark for diagnosing liver fibrosis, it has its own disadvantages. There is a danger of hemorrhage (1.7% risk) (9), which in patients with cirrhosis may be compounded by abnormality of coagulation secondary to hepatic dysfunction. There is a small risk (0.01%–1%) of death (9–11). Although liver biopsy is excellent for establishing the diagnosis of chronic liver disease, it is generally considered less reliable for assessing the severity of fibrosis (12). Fibrosis is heterogeneous in distribution, which results in the risk of sampling error (13,14). Although there are several established scoring systems, categorization into different stages of fibrosis is based on subjective assessment, which results in considerable intraobserver and interobserver variability (15,16). Even in the hands of an expert pathologist who is interpreting the results, liver biopsy has as much as a 20% error rate in disease staging (12). Moreover, serial examination for follow-up is impractical, which renders assessment of treatment response with liver biopsy difficult.
Blood Tests
Tests for several direct and indirect markers of liver fibrosis are available commercially today. Tests for indirect markers range from simple laboratory tests, such as the platelet count, prothrombin time, albumin level, total bilirubin level, and serum aminotransferase levels, to more sophisticated tests, including levels of hyaluronic acid and α2-macroglobulin. Direct markers of fibrosis include levels of procollagen (types I, III, and IV), matrix metalloproteinases, cytokines, and chemokines. Investigators have shown that a panel of these measures is superior to stand-alone tests (17). Advantages include ready availability, cost-effectiveness, and the capability of performing serial testing for follow-up. Some disadvantages include a relative lack of specificity and a limited ability to quantify fibrosis (18). The lack of access to these tests at some institutions is another drawback.
None of these markers have evolved as the standard of practice for primary assessment of liver fibrosis. Biopsy and, more recently, elastography remain the modalities for primary assessment of hepatic fibrosis. Nonetheless, blood tests are helpful in confirming or refuting a diagnosis in cases in which the findings from elastography and biopsy are equivocal.
In our practice, the two most commonly used blood tests are a liver fibrosis panel (HepaScore; Quest Diagnostics, Madison, NJ) and a patented biomarker test (FibroSure; LabCorp, Burlington, NC). The HepaScore is a complicated algorithm that uses age, sex, and levels of total bilirubin, γ-glutamyltransferase, α2-macroglobulin, and hyaluronic acid (19). At HepaScore values less than or equal to 0.2, the negative predictive value to exclude fibrosis is 98%. At values greater than or equal to 0.8, the positive predictive value for predicting cirrhosis is 62%. Thus, HepaScore is a good test to exclude fibrosis, but a HepaScore of greater than 0.2 requires use of an adjunct fibrosis marker to predict cirrhosis.
The FibroSure (20) algorithm uses age, gender, and levels of α2-macroglobulin, haptoglobulin, γ-glutamyltransferase, apolipoprotein A-1, total bilirubin, and alanine aminotransferase. At a cutoff value of less than 0.31, the negative predictive value for the absence of fibrosis is 91%. At a cutoff of 0.72, the positive predictive value for clinically significant fibrosis is 76%. The FibroSure test also provides an estimation of the grade of fibrosis. This model is good at excluding or confirming the diagnosis, but results are indeterminate in the middle ranges, necessitating the use of adjunct tests in those cases.
Cross-sectional Imaging
Computerized tomography (CT), magnetic resonance (MR) imaging, and ultrasonography (US) can be useful in the imaging of chronic liver disease. Images obtained with these modalities may be used to assess the liver for the presence of fibrosis by the depiction of (a) anatomic distortion; (b) changes in parenchymal attenuation, signal intensity, or echotexture; and (c) alterations in dynamic contrast enhancement. Assessment of complications such as portal hypertension, ascites, and hepatocellular carcinoma is also possible. However, these imaging modalities are typically insensitive for the evaluation of early fibrosis and may not be helpful until cirrhosis develops.
Anatomic signs of cirrhosis include surface nodularity (Fig 1a), segmental hypertrophy or atrophy, enlarged periportal hilar space, the enlarged gallbladder fossa sign, widened fissures, the creeping fat sign, and the posterior hepatic notch sign. A value of more than 0.65 for the ratio of the caudate lobe width to the right lobe width is considered 100% specific for cirrhosis (21) (Fig 1b). However, the caudate lobe–to–right lobe width ratio has only moderate overall interreader agreement, with a κ value of 0.53 (22). Signs of portal hypertension are indirect markers for cirrhosis. These signs include a dilated portal vein (Fig 1c), cavernous transformation of the portal vein, recanalization of the umbilical vein, splenomegaly, ascites, and varices (Fig 1d), among others. When anatomic signs are found, they are most useful; however, their absence cannot be used to reliably exclude fibrosis or cirrhosis of the liver.
Figure 1a.
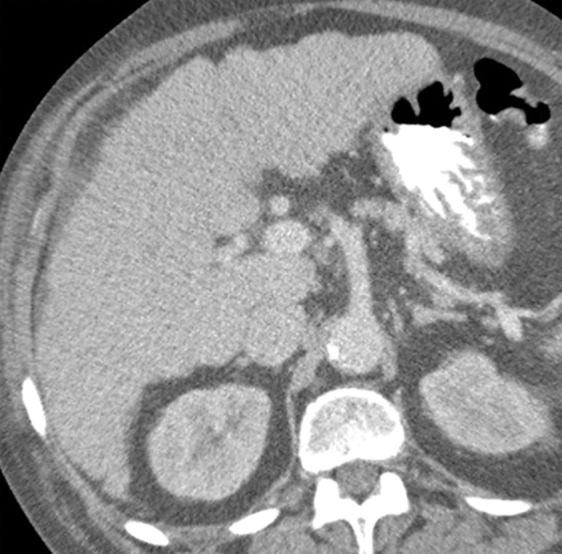
Anatomic imaging of cirrhosis in four patients. (a) Axial contrast material–enhanced CT image of a 63-year-old man with cirrhosis shows the nodular contour of the liver surface, a finding that indicates cirrhosis. (b) Axial contrast-enhanced CT image of a 53-year-old man with cirrhosis shows caudate lobe hypertrophy (red oval). Green line 1 is a vertical line drawn through the lateral border of the main portal vein, green line 2 is a vertical line drawn through the left lateral border of the caudate lobe, and green line 3 is a horizontal line midway between the hepatic vein and the main portal vein, drawn perpendicular to lines 1 and 2. Caudate lobe and right lobe widths are indicated by the yellow and blue double-headed arrows, respectively. A ratio of the caudate lobe width to the right lobe width that is more than 0.65 is considered 100% specific for cirrhosis. (c) Coronal gadolinium-enhanced T1-weighted MR image of a 60-year-old man with cirrhosis and portal hypertension shows a dilated portal vein measuring 1.51 cm in diameter (black line) and ascites, findings that are indicative of portal hypertension, an indirect sign of cirrhosis. (d) Axial contrast-enhanced CT image of a 74-year-old woman with cirrhosis and portal hypertension shows paraesophageal varices (circle), a finding that indicates portal hypertension resulting in collateralization. This finding is another indirect sign of cirrhosis.
Figure 1b.
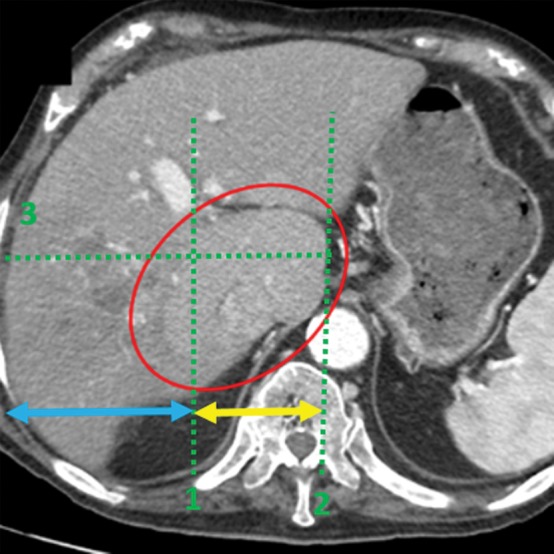
Anatomic imaging of cirrhosis in four patients. (a) Axial contrast material–enhanced CT image of a 63-year-old man with cirrhosis shows the nodular contour of the liver surface, a finding that indicates cirrhosis. (b) Axial contrast-enhanced CT image of a 53-year-old man with cirrhosis shows caudate lobe hypertrophy (red oval). Green line 1 is a vertical line drawn through the lateral border of the main portal vein, green line 2 is a vertical line drawn through the left lateral border of the caudate lobe, and green line 3 is a horizontal line midway between the hepatic vein and the main portal vein, drawn perpendicular to lines 1 and 2. Caudate lobe and right lobe widths are indicated by the yellow and blue double-headed arrows, respectively. A ratio of the caudate lobe width to the right lobe width that is more than 0.65 is considered 100% specific for cirrhosis. (c) Coronal gadolinium-enhanced T1-weighted MR image of a 60-year-old man with cirrhosis and portal hypertension shows a dilated portal vein measuring 1.51 cm in diameter (black line) and ascites, findings that are indicative of portal hypertension, an indirect sign of cirrhosis. (d) Axial contrast-enhanced CT image of a 74-year-old woman with cirrhosis and portal hypertension shows paraesophageal varices (circle), a finding that indicates portal hypertension resulting in collateralization. This finding is another indirect sign of cirrhosis.
Figure 1c.
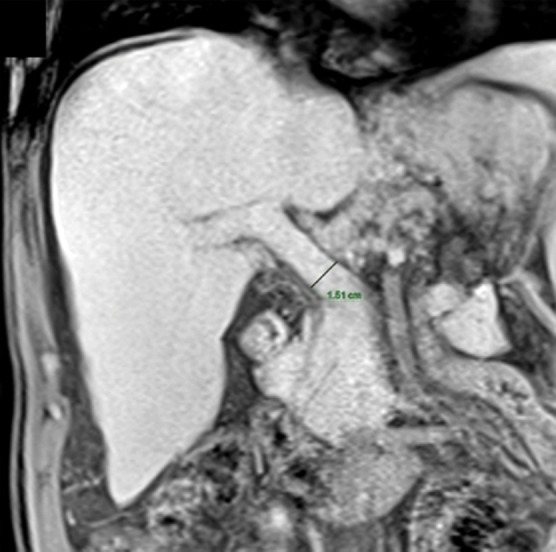
Anatomic imaging of cirrhosis in four patients. (a) Axial contrast material–enhanced CT image of a 63-year-old man with cirrhosis shows the nodular contour of the liver surface, a finding that indicates cirrhosis. (b) Axial contrast-enhanced CT image of a 53-year-old man with cirrhosis shows caudate lobe hypertrophy (red oval). Green line 1 is a vertical line drawn through the lateral border of the main portal vein, green line 2 is a vertical line drawn through the left lateral border of the caudate lobe, and green line 3 is a horizontal line midway between the hepatic vein and the main portal vein, drawn perpendicular to lines 1 and 2. Caudate lobe and right lobe widths are indicated by the yellow and blue double-headed arrows, respectively. A ratio of the caudate lobe width to the right lobe width that is more than 0.65 is considered 100% specific for cirrhosis. (c) Coronal gadolinium-enhanced T1-weighted MR image of a 60-year-old man with cirrhosis and portal hypertension shows a dilated portal vein measuring 1.51 cm in diameter (black line) and ascites, findings that are indicative of portal hypertension, an indirect sign of cirrhosis. (d) Axial contrast-enhanced CT image of a 74-year-old woman with cirrhosis and portal hypertension shows paraesophageal varices (circle), a finding that indicates portal hypertension resulting in collateralization. This finding is another indirect sign of cirrhosis.
Figure 1d.
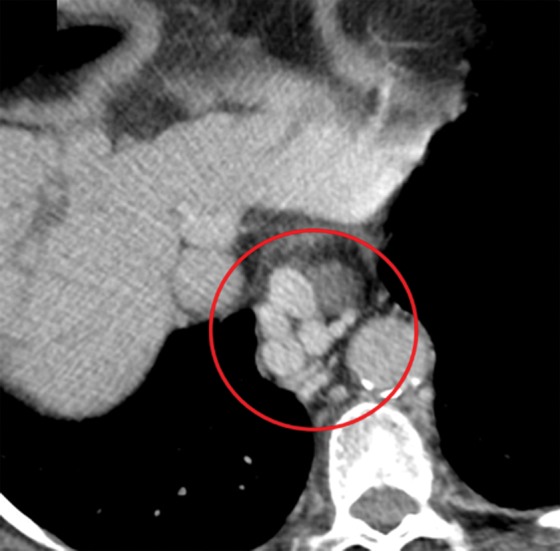
Anatomic imaging of cirrhosis in four patients. (a) Axial contrast material–enhanced CT image of a 63-year-old man with cirrhosis shows the nodular contour of the liver surface, a finding that indicates cirrhosis. (b) Axial contrast-enhanced CT image of a 53-year-old man with cirrhosis shows caudate lobe hypertrophy (red oval). Green line 1 is a vertical line drawn through the lateral border of the main portal vein, green line 2 is a vertical line drawn through the left lateral border of the caudate lobe, and green line 3 is a horizontal line midway between the hepatic vein and the main portal vein, drawn perpendicular to lines 1 and 2. Caudate lobe and right lobe widths are indicated by the yellow and blue double-headed arrows, respectively. A ratio of the caudate lobe width to the right lobe width that is more than 0.65 is considered 100% specific for cirrhosis. (c) Coronal gadolinium-enhanced T1-weighted MR image of a 60-year-old man with cirrhosis and portal hypertension shows a dilated portal vein measuring 1.51 cm in diameter (black line) and ascites, findings that are indicative of portal hypertension, an indirect sign of cirrhosis. (d) Axial contrast-enhanced CT image of a 74-year-old woman with cirrhosis and portal hypertension shows paraesophageal varices (circle), a finding that indicates portal hypertension resulting in collateralization. This finding is another indirect sign of cirrhosis.
Emerging imaging techniques for the detection of liver fibrosis have shown promise in the initial studies. Aguirre et al (23) demonstrated that it is possible to diagnose cirrhosis and grade liver fibrosis on the basis of hepatic texture alterations depicted on MR images obtained after administration of superparamagnetic iron oxide (SPIO)–based and/or gadolinium-based MR contrast agents. The disadvantage with this approach is the use of two contrast agents. The SPIO agents are currently not approved by the U.S. Food and Drug Administration. Ou et al (24) demonstrated that the hepatic arterial enhancement fraction (ratio of hepatic arterial perfusion to the total hepatic perfusion) can be used as a noninvasive way to differentiate normal liver parenchyma from mild fibrosis and to distinguish mild-to-moderate fibrosis from cirrhosis. Zissen et al (25) showed that a noninvasive method of CT quantification of the hepatic fractional extracellular space volume may be used to differentiate the presence and absence of clinical cirrhosis and, potentially, to grade the severity of diffuse liver disease. This technique requires obtaining additional delayed-phase CT images.
Recently, US elastography and MR elastography have emerged as superior modalities for evaluation of liver fibrosis. Investigators have demonstrated that MR elastographic values are better than morphologic features on MR images for the prediction of advanced fibrosis and cirrhosis (22,26).
Basic Principles of Elastography
The elasticity of a material describes its tendency to resume its original size and shape after being subjected to a deforming force or stress. The change in size or shape is known as the strain. The force acting on unit area is known as the stress. Elastography refers to an imaging technique that images and/or quantifies elasticity (mechanical properties) of biologic tissues. Mechanical properties reflecting tissue organization, physiologic findings, and pathologic conditions can be quantified with elastography (27). Tissues are considered viscoelastic in their mechanical properties. Elastographic techniques assess the stiffness of the tissue on the basis of many mechanical assumptions. These assumptions include the viscoelastic nature of tissue, isotropy, homogeneity, and incompressibility, so that calculations are simplified and useful for clinical applications.
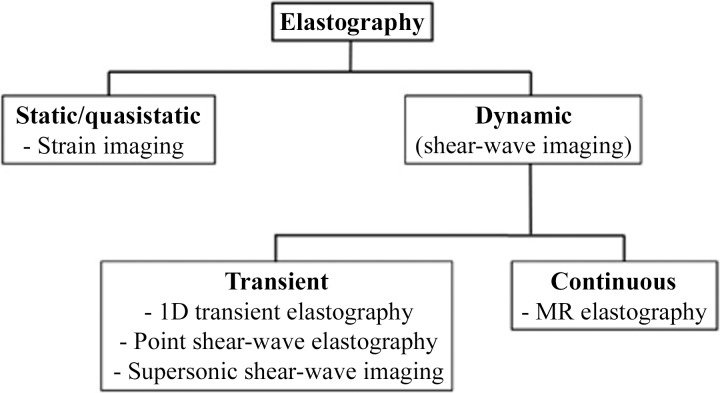
The principle of measuring tissue response to a known mechanical stimulus forms the basis for elastography. The stimulus can be static, quasistatic, or dynamic (Fig 2). An example of a static stimulus is manual palpation, which is used clinically. Imaging-based techniques can use static compressions for elasticity assessment such as real-time elastography and strain-encoding imaging. However, these techniques are most helpful in the assessment of superficial and easily accessible tissues such as the breast, thyroid gland, and parotid glands. Dynamic stimulus–based techniques typically use vibrations in the range of 20–500 Hz and study the properties of the waves produced by the vibrations that propagate through the tissues. Typical examples are US-based shear-wave elastography and MR elastography.
Figure 2.
Diagram shows the various elastographic techniques. 1D = one-dimensional.
Most techniques measure the propagation velocity of mechanical waves propagating within tissue to calculate the stiffness parameters. It is important to understand that the measured parameters are not equal or comparable among the different techniques. For example, transient elastography measures the bulk modulus, or Young modulus (E); whereas MR elastography measures the magnitude of the shear modulus (µ). The bulk modulus is roughly three times the shear modulus (E = 3µ); however, both measures are expressed in kilopascals. In shear-wave elastography, the velocity of the shear waves is reported in meters per second. Another important difference is the frequency of vibration used. For example, transient elastography uses 50 Hz, whereas MR elastography uses 60 Hz. Mechanical properties are frequency dependent and proportional to the frequency used.
Chronic liver disease leads to the development of fibrosis (accumulation of collagen fibers), which results in increased stiffness of the hepatic parenchyma. A stiffer tissue resists deformation and results in faster propagation of mechanical waves. The change in this mechanical property allows for the differentiation of normal liver parenchyma from fibrotic liver and cirrhosis.
Evolution of Elastography
As far back as 400 BC, clinicians have used manual palpation of tissue stiffness to assess pathologic conditions (28). Elastography, in some sense, is a sophisticated palpation technique. The term elastography was first coined by Ophir et al (29).
In a landmark study published in 1952 that heralded the evolution of elastography, von Gierke and colleagues (30) used photography and a strobe light to record vibration waves on the skin. They observed a correlation between increased frequency and increased tissue impedance.
In 1983, Eisenscher et al (31) studied induced quasistatic compression by applying a 1.5-Hz vibration source to liver tissue and using M-mode US to measure wave propagation. They found that benign lesions had a sinusoidal response to compression, whereas malignant lesions had a more linear (flat) response. Modern one-dimensional transient elastography uses a similar basic technique.
Subsequently, in 1985, Birnholz and Farrell (32) made an attempt to qualitatively determine the stiffness of fetal lungs by evaluating lung compression caused by cardiac pulsation on B-mode US images. They proposed that soft lung tissue compresses, and stiff lung tissue exhibits no regional deformation. This US technique is one of the initial examples of quasistatic strain imaging.
One of the earliest studies of vibration amplitude sonoelastography was conducted by Lerner and Parker (33) in 1987. They studied the propagation of shear waves through tissues after application of a continuous low-frequency vibration. This study, among others, led the way to the subsequent development of shear-wave elastography.
In 1995, Muthupillai et al (34) paved the way for the development of MR elastography by inducing harmonic vibrations of acoustic-range frequencies and imaging the propagation of these vibrations with an MR-based sequence to calculate quantitative values for tissue mechanical parameters.
Ophir et al (29) were the pioneers of quasistatic elastography, which was developed in the early 1990s. Catheline et al (35) first demonstrated the utility of one-dimensional transient elastography in the measurement of elastic properties. In 1998, Sarvazyan et al (36) proposed shear-wave elastography as a new elastographic method. In 2008, Tanter et al (37) of the Institut Curie conducted the first clinical in vivo evaluation of supersonic shear-wave elastography of breast lesions.
Elastography in Chronic Liver Disease
The main clinical indication for liver elastography is the detection and staging of fibrosis in patients with chronic liver disease. Other indications include follow-up of previously diagnosed fibrosis, assessment of treatment response in patients with hepatic fibrosis, assessment for the presence of clinically significant portal hypertension (spleen elastography) (38), and evaluation of patients with unexplained portal hypertension.
Recently, the efficacy of elastography in the diagnosis of fibrosis has become even more relevant in patients with hepatitis C. In the past, administration of interferons was the mainstay of therapy, with a high incidence of associated side effects. However, with the advent of hepatitis C virus polymerase inhibitor therapy, cure rates approach 100%, with minimal side effects. The downside of this class of drugs is the treatment expense—a complete course of therapy costs approximately $90 000. Current reimbursement patterns support the use of this therapy only for patients with advanced fibrosis or cirrhosis (METAVIR F3 and higher), creating a need for staging of fibrosis.
Nonalcoholic fatty liver disease is the most common cause of chronic liver disease in the United States and one of the leading reasons for liver transplantation (39). For patients who develop nonalcoholic steatohepatitis with the highest risk of fibrosis progression, early detection and noninvasive monitoring are important. Most physicians and patients would prefer a noninvasive test for both staging and follow-up (40). Hence, elastography is gaining increasing acceptance as a noninvasive method of fibrosis assessment in these patients.
US Elastography
US Elastographic Techniques
Static or Quasistatic Strain Imaging.—In static or quasistatic elastography, also known as compression elastography, stress is applied by repeated compression, and the amount of lesion deformation relative to the surrounding normal tissue is measured and displayed in color (Fig 3). The applied compression may be manual compression with the transducer (quasistatic) or may be from physiologic compression of tissues adjacent to moving structures in the body, such as the heart and lungs (static). Because the amount of applied compression is variable and not quantifiable, there is substantial variability (41).
Figure 3.
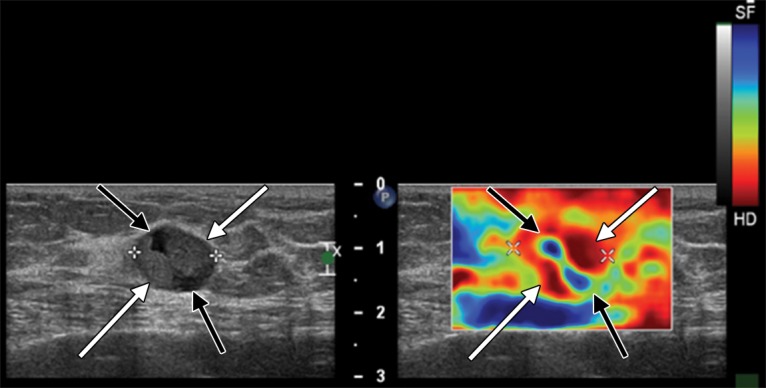
Strain elastography. Gray-scale US image (left) of an 81-year-old woman with invasive papillary carcinoma shows a 1.47-cm complex cystic and solid mass. Strain elastographic image (right) of the same patient shows that the lesion has mixed stiffness, with hard elasticity (red areas indicated by white arrows) correlating to the solid component, and with the cystic component (blue areas indicated by black arrows) appearing soft. (Courtesy of Katie N. Hunt, MD, Breast Imaging Department, Mayo Clinic, Rochester, Minn.)
The main use of static or quasistatic elastography is in the evaluation of breast and thyroid lesions. Ko et al (42) found that the sensitivity and specificity of strain elastography were 89% and 81%, respectively, for diagnosing malignancy in their study of 367 thyroid nodules. Currently, this technique is unlikely to be useful in the assessment of chronic liver disease because several factors, including the intercostal space width and the thickness of the subcutaneous fat, would limit compression of the liver.
One-dimensional Transient Elastography.—For one-dimensional transient elastography (FibroScan; Echosens, Paris, France), a US transducer probe is mounted on the axis of a vibrator. Low-frequency (50-Hz) vibrations are transmitted by the transducer, inducing an elastic shear wave that propagates through the underlying tissues. Pulse-echo US acquisitions are then used to measure the velocity of propagation of the shear wave, which is directly proportional to the tissue stiffness.
Transient elastography measures the liver stiffness in a volume that approximates a cylinder 1 cm wide and 4 cm long, with a measurement depth between 25 mm and 65 mm below the skin surface. This volume is at least 100 times larger than a biopsy sample and is therefore far more representative of the hepatic parenchyma. To achieve a valid evaluation of liver stiffness, at least 10 successful measurements of liver stiffness must be obtained within a defined interquartile range with a success rate (number of successful measurements of the total number attempted) of greater than 60% (43), a requirement that places immense importance on adequate technique for optimal results.
Transient elastography is painless, rapid (takes <5 minutes), and easy to perform at the bedside or in the outpatient clinic, and the results are immediately available. Transient elastography has been shown to be reliable in the assessment of liver fibrosis in patients with chronic hepatitis C (44).
However, transient elastography also has limitations. No real-time imaging is used, and gray-scale images of the liver are unavailable—the operator depends on percussion of the right lower portion of the chest and A-mode images for the selection of liver tissue, which has the potential for errors in adequate region of interest (ROI) selection. Measurement of liver stiffness can be difficult in obese patients and impossible in patients who have ascites (45). Castéra et al (46) studied more than 13 000 transient elastographic examinations during a 5-year period; they found that liver stiffness measurements could not be interpreted in nearly one in five cases.
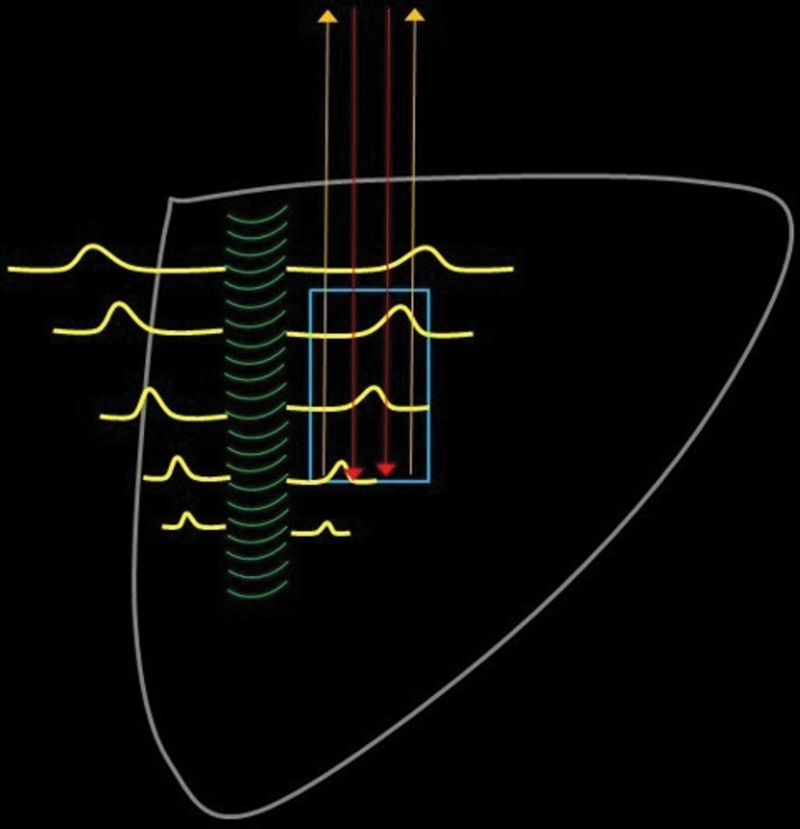
Point Shear-Wave Elastography.—When tissue is displaced posteriorly by focused ultrasound beams from the probe, the restorative force of the tissue propagates laterally, generating shear waves. Focused US pulses are used to generate a transverse wave (shear wave) at specific depths within the liver, as selected by the operator. Tracking US pulses are then used to measure the velocity of these shear waves as they travel through the liver parenchyma. The velocity of propagation of the shear waves is proportional to the square root of the tissue stiffness or elasticity, thus enabling estimation of fibrosis (47). Figure 4 is a diagram that represents the basic steps of point shear-wave elastography.
Figure 4.
Diagram shows the five basic steps of point shear-wave elastography: (1) An ROI (blue rectangle) is placed at the desired location. (2) A standard transducer is used to apply a US push pulse (green curved lines) that runs alongside the ROI. (3) The resultant tissue compression causes propagation of shear waves (yellow lines) perpendicular to the push pulse. Some of these shear waves traverse the ROI. (4) Multiple detection pulses (red arrows) are sent through the ROI. (5) These detection pulses can be used to calculate the speed of the shear waves by analyzing the returned echoes (yellow arrows). The speed of the shear waves correlates with the tissue stiffness.
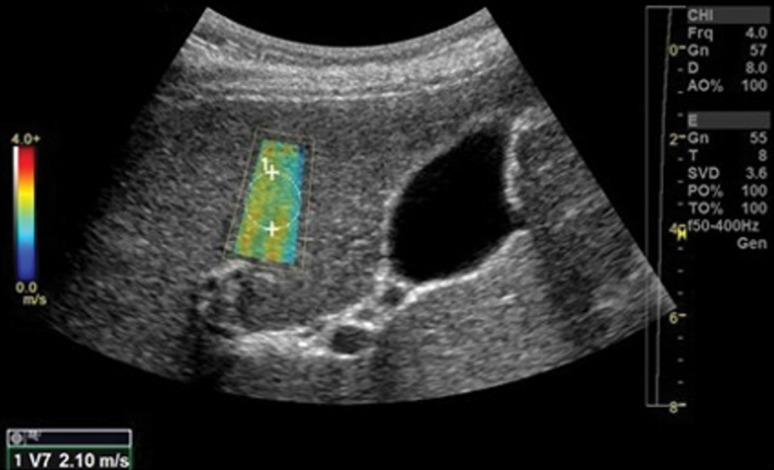
Point shear-wave elastography uses a curvilinear probe at a frequency that is automatically selected by the machine. In cases in which there is an inability to adequately penetrate the liver tissue, manual selection may be used. The patient is placed in a supine or left posterior oblique position with the right arm elevated to enable ease of approach. Right hepatic lobe measurements obtained by way of the intercostal spaces are preferred, to prevent inadvertent compression of liver tissue by the operator’s probe. A total of 10–12 ROIs are selected sequentially, which are placed within 2–7 cm of the liver capsule and include only liver parenchyma. Measurements are obtained in a breath hold during gentle normal respiration. Mean, median, and average velocities are calculated automatically. Barr et al (48) recommended using the median velocity for interpretation (Fig 5).
Figure 5a.
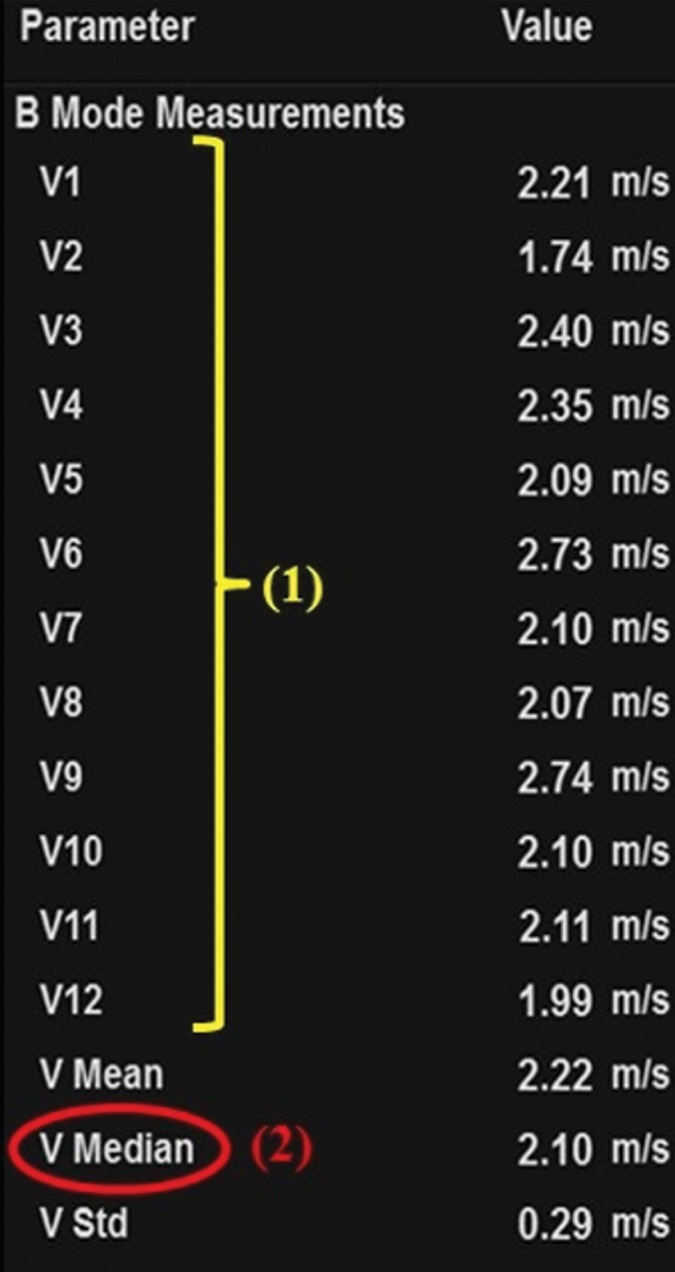
Sample determination of velocity measurement with the use of point shear-wave elastography of a 64-year-old woman with advanced fibrosis secondary to hepatitis C. (a) Tabulation shows velocity measurements. To determine the velocity measurement, step 1 (1) is to obtain 10–12 individual velocity measurements (V1–V12). Step 2 (2) is that the median velocity (V Median) is used for fibrosis assessment. (b) Point shear-wave elastographic image shows one of the individual velocity measurements: velocity measurement 7 (V7) of 2.10 m/sec.
Figure 5b.
Sample determination of velocity measurement with the use of point shear-wave elastography of a 64-year-old woman with advanced fibrosis secondary to hepatitis C. (a) Tabulation shows velocity measurements. To determine the velocity measurement, step 1 (1) is to obtain 10–12 individual velocity measurements (V1–V12). Step 2 (2) is that the median velocity (V Median) is used for fibrosis assessment. (b) Point shear-wave elastographic image shows one of the individual velocity measurements: velocity measurement 7 (V7) of 2.10 m/sec.
Supersonic Shear-Wave Elastography.—Similar to transient shear-wave elastography, shear-wave velocity measurement forms the basis of supersonic shear-wave elastography. The main difference is that focused US beams are transmitted continuously to tissue at different depths, resulting in a conical shear-wave front. The ROI of supersonic shear-wave imaging is fan shaped and larger than the ROI with other modalities (as large as 50 mm × 50 mm). Real-time imaging is then used to measure the velocity of this shear-wave front. A two-dimensional map is created when the speed of the passing shear wave is calculated.
This technique has the ability to show viscoelastic properties in all areas in an ROI with a color lookup table. Thus, the limitations of transient elastography by which liver stiffness cannot be measured accurately in patients with severe obesity, thick subcutaneous fat, and ascites can be overcome (49). However, shear-wave viscosity assessment is not currently used for diagnostic purposes in clinical practice. Moreover, this technique can be used to display a gray-scale US image on the background of the elastogram, so it is more familiar to a physician who uses conventional US.
US Elastographic Interpretation
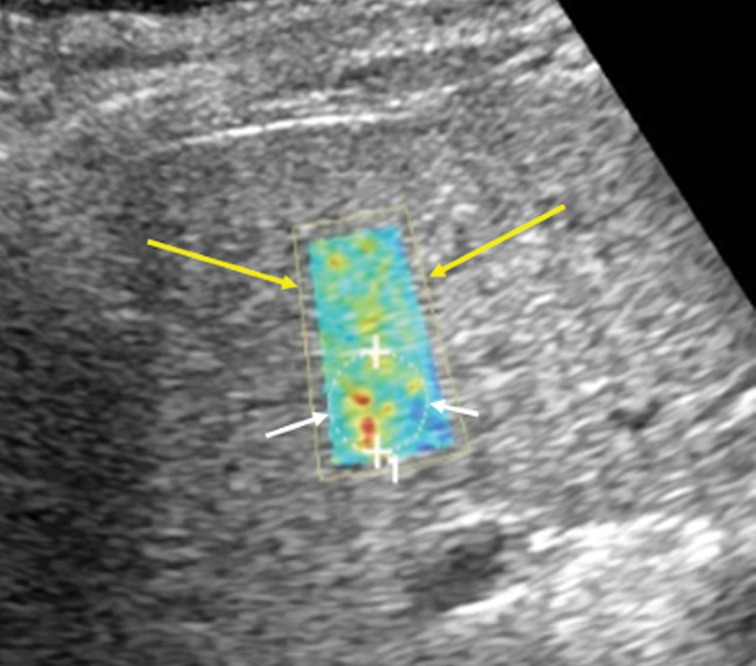
Fibrosis cutoff values for US elastographic techniques are manufacturer dependent because of the variability in velocity measurements, depending on the US equipment used. A recent consensus statement by the Society of Radiologists in Ultrasound (48) suggested dividing patients into three categories: (a) patients with a low risk for fibrosis who are unlikely to need further follow-up (stages F0 and F1), (b) patients with a high risk for advanced fibrosis or cirrhosis who require prioritization for therapy (stage F4 and some stage F3), and (c) patients in between who have moderate to severe fibrosis (stages F2 and F3) and are at risk for progression of the fibrosis, depending on the origin of the fibrosis. The consensus panel recommended interpretation of results by using two cutoff values: one to select patients who are at low risk for clinically significant fibrosis (F0 and F1), and another cutoff value to select patients at high risk for advanced fibrosis or cirrhosis (F4 and some F3). The Society of Radiologists in Ultrasound suggested that there is substantial overlap of fibrosis stages between these two cutoff values, requiring further workup with blood tests and/or biopsy in such cases. The cutoffs for hepatitis C patients proposed by the Society of Radiologists in Ultrasound are provided in Table 1 (50). An example of the use of US elastography and conventional US in a patient with cirrhosis is provided in Figure 6.
Table 1:
Velocity Cutoffs for Hepatitis C Patients Proposed by the Society of Radiologists in Ultrasound
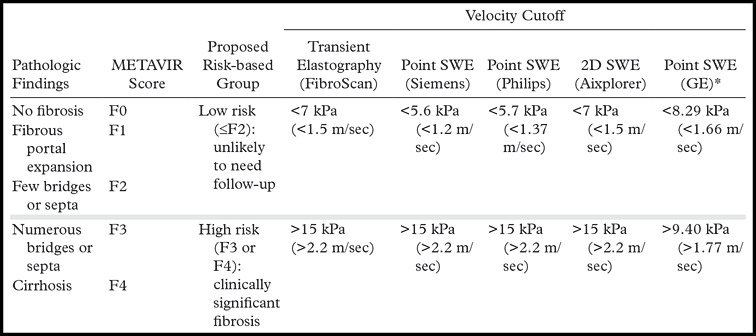
*Source.—Reference 50 (publication by the manufacturer; not in the peer-reviewed literature).
Note.—SWE = shear-wave elastography, 2D = two-dimensional. Manufacturer information includes Aixplorer (SuperSonic Imagine, Aix-en-Provence, France); GE Healthcare (Little Chalfont, United Kingdom); Philips Healthcare (Andover, Mass); and Siemens Healthineers (Malvern, Pa).
Figure 6a.
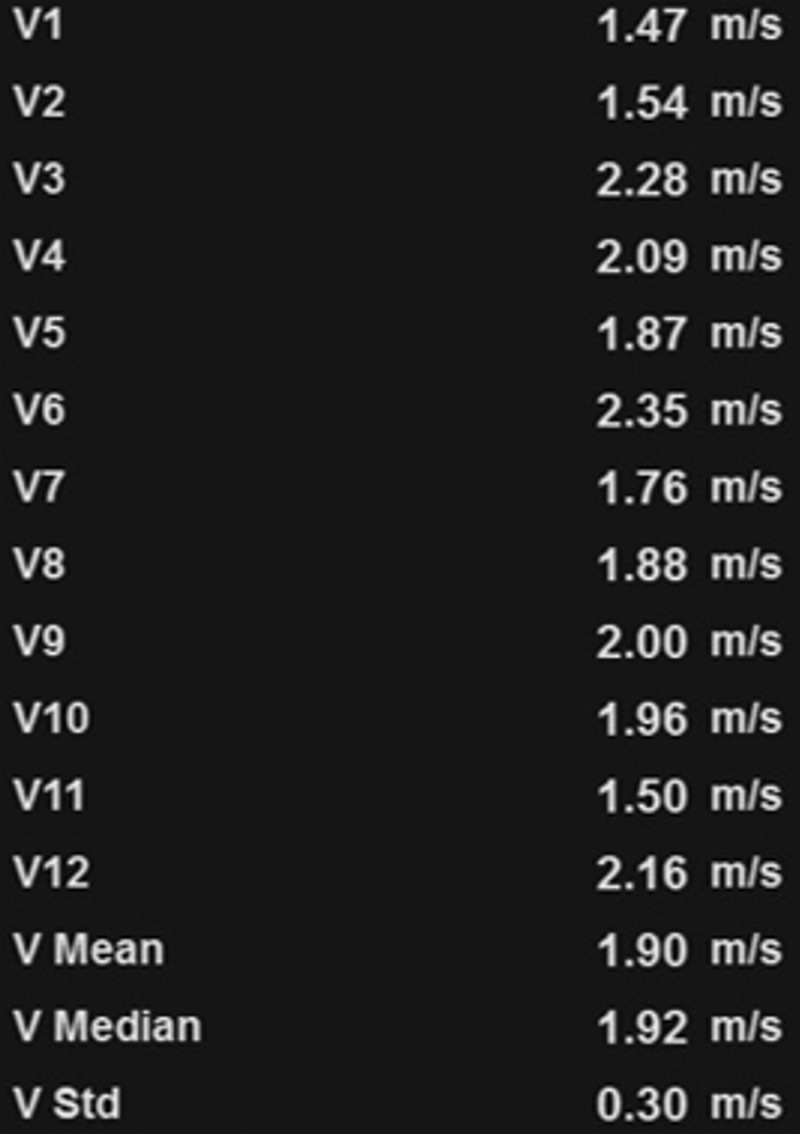
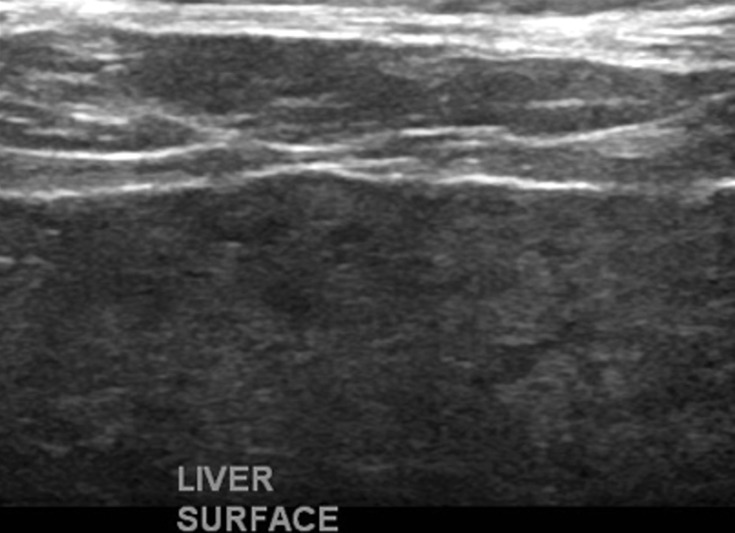
US elastography of a 62-year-old woman with hepatitis C and cirrhosis. (a) Tabulation of 12 velocity measurements (V1–V12) shows an increased median velocity (V Median) of 1.92 m/sec (>1.77 m/sec), a finding that classifies the patient into the high-risk category according to a recent consensus conference statement by the Society of Radiologists in Ultrasound (48). This patient will require prioritization for therapy and further follow-up. (b) US elastographic image shows a mixture of colors that is due to the tissue stiffness variation within the ROI. In this and the subsequent US elastographic images, the yellow box (yellow arrows) is the field of view of the shear-wave sample area, and the dashed circle (white arrows) is the location where the actual velocity measurements are obtained and recorded (1 = ROI 1). (c) Conventional transverse US image of the liver surface shows surface nodularity, a finding that indicates cirrhosis.
Figure 6b.
US elastography of a 62-year-old woman with hepatitis C and cirrhosis. (a) Tabulation of 12 velocity measurements (V1–V12) shows an increased median velocity (V Median) of 1.92 m/sec (>1.77 m/sec), a finding that classifies the patient into the high-risk category according to a recent consensus conference statement by the Society of Radiologists in Ultrasound (48). This patient will require prioritization for therapy and further follow-up. (b) US elastographic image shows a mixture of colors that is due to the tissue stiffness variation within the ROI. In this and the subsequent US elastographic images, the yellow box (yellow arrows) is the field of view of the shear-wave sample area, and the dashed circle (white arrows) is the location where the actual velocity measurements are obtained and recorded (1 = ROI 1). (c) Conventional transverse US image of the liver surface shows surface nodularity, a finding that indicates cirrhosis.
Figure 6c.
US elastography of a 62-year-old woman with hepatitis C and cirrhosis. (a) Tabulation of 12 velocity measurements (V1–V12) shows an increased median velocity (V Median) of 1.92 m/sec (>1.77 m/sec), a finding that classifies the patient into the high-risk category according to a recent consensus conference statement by the Society of Radiologists in Ultrasound (48). This patient will require prioritization for therapy and further follow-up. (b) US elastographic image shows a mixture of colors that is due to the tissue stiffness variation within the ROI. In this and the subsequent US elastographic images, the yellow box (yellow arrows) is the field of view of the shear-wave sample area, and the dashed circle (white arrows) is the location where the actual velocity measurements are obtained and recorded (1 = ROI 1). (c) Conventional transverse US image of the liver surface shows surface nodularity, a finding that indicates cirrhosis.
US Elastographic Confounders
US elastographic confounders can be technical confounders, which are related to hardware and operator factors, or biologic confounders, which are related to physiologic and pathologic alterations in tissues that result in spurious findings. For example, higher velocities obtained from left lobe measurements, compared with right lobe measurements, are a technical confounder. This artifactual increase in velocity is probably related to the left lobe being more prone to compression by the US probe, the stomach, or the heart (Fig 7). Intercostal measurements of the right lobe are thus preferred. Another important technical confounder is inclusion of nonparenchymal tissue within the ROI. Inclusion of the liver capsule, blood vessels, gallbladder wall (Fig 8), falciform ligament, or bile ducts may result in spuriously elevated velocity measurements. This spurious elevation occurs because the walls of nonparenchymal structures are less elastic, giving the illusion of stiff tissue and fibrosis. Depth of measurement also plays an important role in velocity determination (Fig 9). As discussed previously, a depth of 2–7 cm from the liver capsule is ideal. The acoustic radiation force impulse (ARFI) push pulse is attenuated as it traverses the patient and reaches a point at which adequate shear waves are not generated for accurate measurement; this problem results in false low-velocity measurements from deeper tissues (48). The degree of attenuation depends on the amplitude of the ARFI pulse (which is restricted by U.S. Food and Drug Administration limits); low-amplitude pulses are attenuated at more superficial depths. Deeper shear-wave measurements would require pulses above threshold to generate them.
Figure 7a.
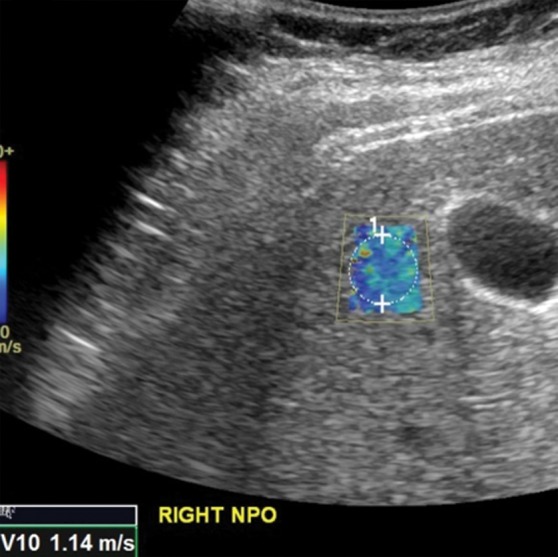
Comparison of right lobe velocity measurement to left lobe velocity measurement obtained by using the point shear-wave elastographic technique in a healthy 37-year-old female volunteer. The higher velocity measurement from the left lobe is likely secondary to compression by the probe, heart, or stomach. (a) Point shear-wave elastographic image of right lobe sample area (circle) shows a velocity of 1.14 m/sec. (b) Point shear-wave elastographic image of left lobe sample area (circle) shows a higher velocity of 1.85 m/sec. NPO = nil per os.
Figure 8.
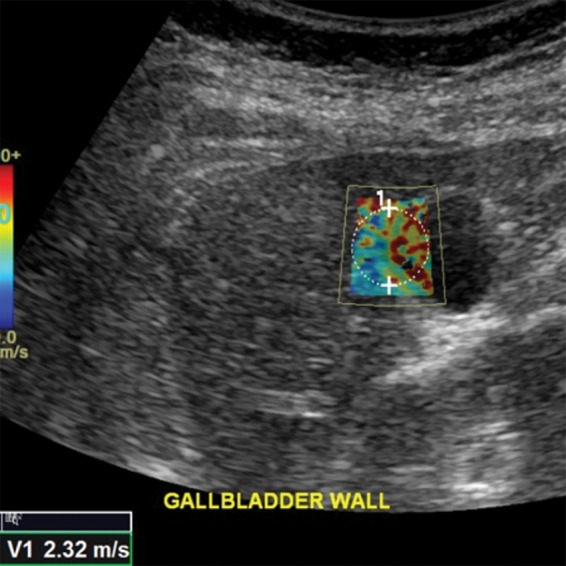
Spuriously elevated velocity measurement in the same healthy 37-year-old female volunteer as in Figure 7. Point shear-wave elastographic image shows sample area (circle) with a velocity measurement of 2.32 m/sec. This high velocity measurement is due to the inclusion of gallbladder wall in the ROI. The gallbladder wall is stiffer, which results in a falsely elevated velocity measurement.
Figure 9a.
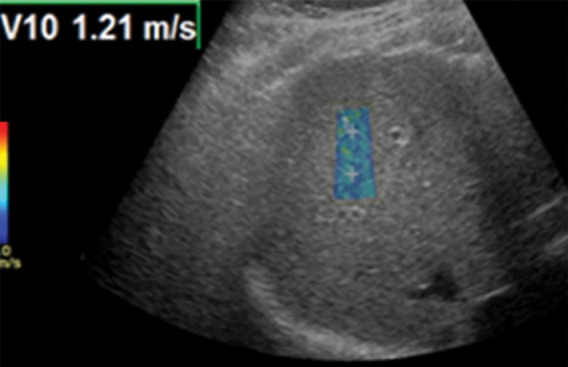
Effect of depth on velocity measurements obtained with the point shear-wave elastographic technique in a healthy 37-year-old female volunteer. Ideally, velocity measurements should be obtained in the superficial portion of the liver (between 2 cm and 7 cm from the capsule). (a) Point shear-wave elastographic image shows that an appropriately placed ROI has a sample velocity of 1.21 m/sec. (b) Point shear-wave elastographic image shows that an ROI placed at a depth of more than 7 cm from the capsule has a sample velocity of 1.01 m/sec. Measuring at this depth results in artifactually low velocities because of inadequate penetration of the ultrasound wave at depth.
Figure 7b.
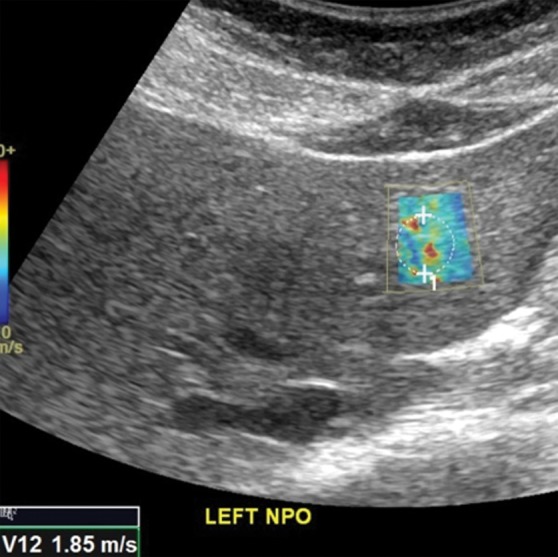
Comparison of right lobe velocity measurement to left lobe velocity measurement obtained by using the point shear-wave elastographic technique in a healthy 37-year-old female volunteer. The higher velocity measurement from the left lobe is likely secondary to compression by the probe, heart, or stomach. (a) Point shear-wave elastographic image of right lobe sample area (circle) shows a velocity of 1.14 m/sec. (b) Point shear-wave elastographic image of left lobe sample area (circle) shows a higher velocity of 1.85 m/sec. NPO = nil per os.
Figure 9b.
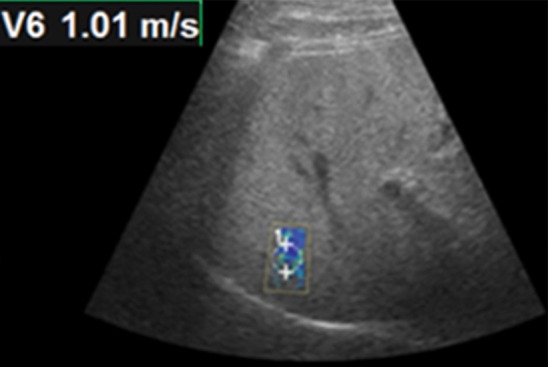
Effect of depth on velocity measurements obtained with the point shear-wave elastographic technique in a healthy 37-year-old female volunteer. Ideally, velocity measurements should be obtained in the superficial portion of the liver (between 2 cm and 7 cm from the capsule). (a) Point shear-wave elastographic image shows that an appropriately placed ROI has a sample velocity of 1.21 m/sec. (b) Point shear-wave elastographic image shows that an ROI placed at a depth of more than 7 cm from the capsule has a sample velocity of 1.01 m/sec. Measuring at this depth results in artifactually low velocities because of inadequate penetration of the ultrasound wave at depth.
Movement during respiration is an important biologic confounder. Ideally, velocities should be measured in a breath hold during gentle normal expiration. Deep inspiration can spuriously increase stiffness measurements (Fig 10). Additional biologic factors include inflammation, hepatic congestion, fasting compared with the postprandial state, diurnal variation, and alcohol. These factors have similar effects on MR elastographic examinations and are discussed in a subsequent section.
Figure 10a.
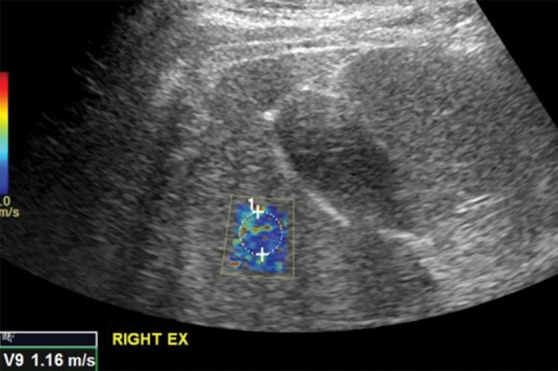
Effect of respiration on velocity measurements obtained with the point shear-wave elastographic technique in a healthy 37-year-old female volunteer. Ideally, velocities should be measured during a breath hold in end expiration to minimize liver motion. (a) Point shear-wave elastographic image shows that a velocity of 1.16 m/sec was measured for a sample obtained during end expiration, which is the appropriate technique. (b) Point shear-wave elastographic image shows that a velocity of 1.71 m/sec was measured for a sample obtained during deep inspiration; this higher velocity measurement is due to the increased stiffness of the liver during inspiration because of compression by the diaphragm.
Figure 10b.
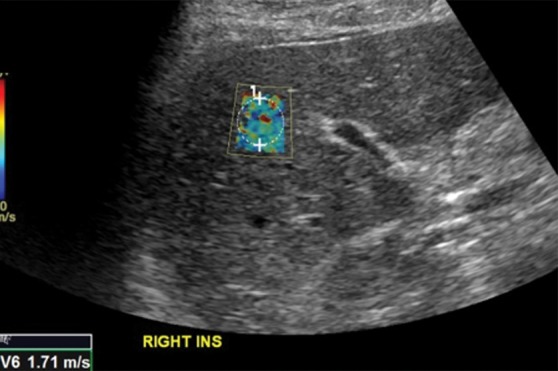
Effect of respiration on velocity measurements obtained with the point shear-wave elastographic technique in a healthy 37-year-old female volunteer. Ideally, velocities should be measured during a breath hold in end expiration to minimize liver motion. (a) Point shear-wave elastographic image shows that a velocity of 1.16 m/sec was measured for a sample obtained during end expiration, which is the appropriate technique. (b) Point shear-wave elastographic image shows that a velocity of 1.71 m/sec was measured for a sample obtained during deep inspiration; this higher velocity measurement is due to the increased stiffness of the liver during inspiration because of compression by the diaphragm.
US Elastographic Performance
Most diagnostic technique performance tests for liver fibrosis staging use the area under the receiver operating curve (Az) as the measure for assessment of the efficacy of the test in question. A diagnostic tool is defined as being perfect if the Az is 1.00, excellent if the Az is more than 0.90, and good if the Az is more than 0.80 (51). Table 2 compares the diagnostic performance of the three main liver US elastographic techniques for the diagnosis of liver fibrosis and cirrhosis (52,53).
Table 2:
Diagnostic Performance of US Elastographic Techniques in Diagnosing Liver Fibrosis and Cirrhosis

Note.—Az = area under the receiver operating curve.
*Higher than stage 2.
US Elastographic Limitations
Shear-wave velocity stiffness values obtained with different techniques and manufacturers are not directly comparable, because shear-wave speed depends on tissue stiffness as well as the applied frequency of the shear wave; with all other things being equal, shear-wave speed and inferred stiffness are greater if the shear waves are applied at higher frequency (54). In addition, the technique is operator dependent, and simultaneous measurements in the same patient may vary, depending on the operator’s expertise. Liver fibrosis assessment with point shear-wave elastography may be unreliable in patients with obesity or ascites (55). The recent development of a new probe (the XL probe, a manufacturer-specific probe for FibroScan) has circumvented the problem in obese patients to a certain extent (46). Additional technical and biologic confounders were discussed in the previous section, “US Elastographic Confounders.”
Despite these limitations, US elastography remains a robust technique for noninvasive measurement of liver fibrosis. In addition, simultaneous assessment of hepatic steatosis can be done by using the principle of the controlled attenuation parameter, which measures the degree of attenuation of ultrasound waves by hepatic fat simultaneously with the liver stiffness measurement. Sasso et al (56) reported that the controlled attenuation parameter was highly correlated with steatosis and had excellent diagnostic performance for grading the severity of steatosis. US elastography can be an all-in-one examination, offering additional benefits of anatomic imaging and the ability to guide biopsy. The operator is able to select ROIs, making evaluation of heterogeneous liver tissue more reliable. The ability to simultaneously assess spleen stiffness is useful to determine portal hypertension, which has prognostic value in patients with chronic liver disease.
MR Elastography
MR elastography is currently regarded as the most accurate noninvasive method for detection and staging of liver fibrosis (57–59). Calculations of liver stiffness with MR elastography are highly reproducible and show excellent interobserver agreement (60–62). The high accuracy is probably related to the large volume of parenchymal sampling, with the potential to assess the stiffness of nearly the entire liver parenchyma. The technique also has high technical success, providing reliable examinations even in obese patients and in those with hepatic steatosis (59,63,64). After the required hardware has been set up, MR elastography may be added to any routine MR imaging protocol with only a few minutes of additional imaging time.
MR Elastographic Technique
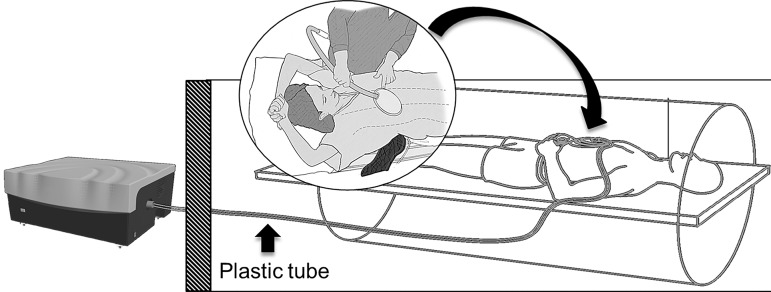
Mechanical shear waves used to determine liver stiffness with MR elastography are created by a wave generator located outside the MR imaging room (Fig 11) (58). On the basis of the results of early patient trials demonstrating both acceptable patient comfort and wave transmission, 60-Hz mechanical waves are most commonly used. Mechanical waves are transmitted through a flexible plastic tube to a passive driver. The passive driver transmits acoustic pressure into the abdominal wall and liver as shear waves. The passive driver is placed directly over the liver on the upper abdomen or lower chest and is held securely in place with a soft elastic strap. The driver is typically placed along the right midclavicular line at the level of the xiphoid process, but the position can be changed in cases of altered anatomy or bowel interposed between the liver and the anterior abdominal wall, to ensure good transmission of the waves into the largest portion of the liver.
Figure 11.
Diagram of the hardware setup for MR elastography. An acoustic wave generator is placed outside the MR imaging room. A flexible plastic tube (∼25 ft [7.5 m] long) transmits pressure waves to a passive driver inside the MR imaging room. The passive driver (curved arrow) is placed on the patient’s abdomen and secured with an elastic strap. Standard torso coils (not shown) are subsequently placed over the passive driver.
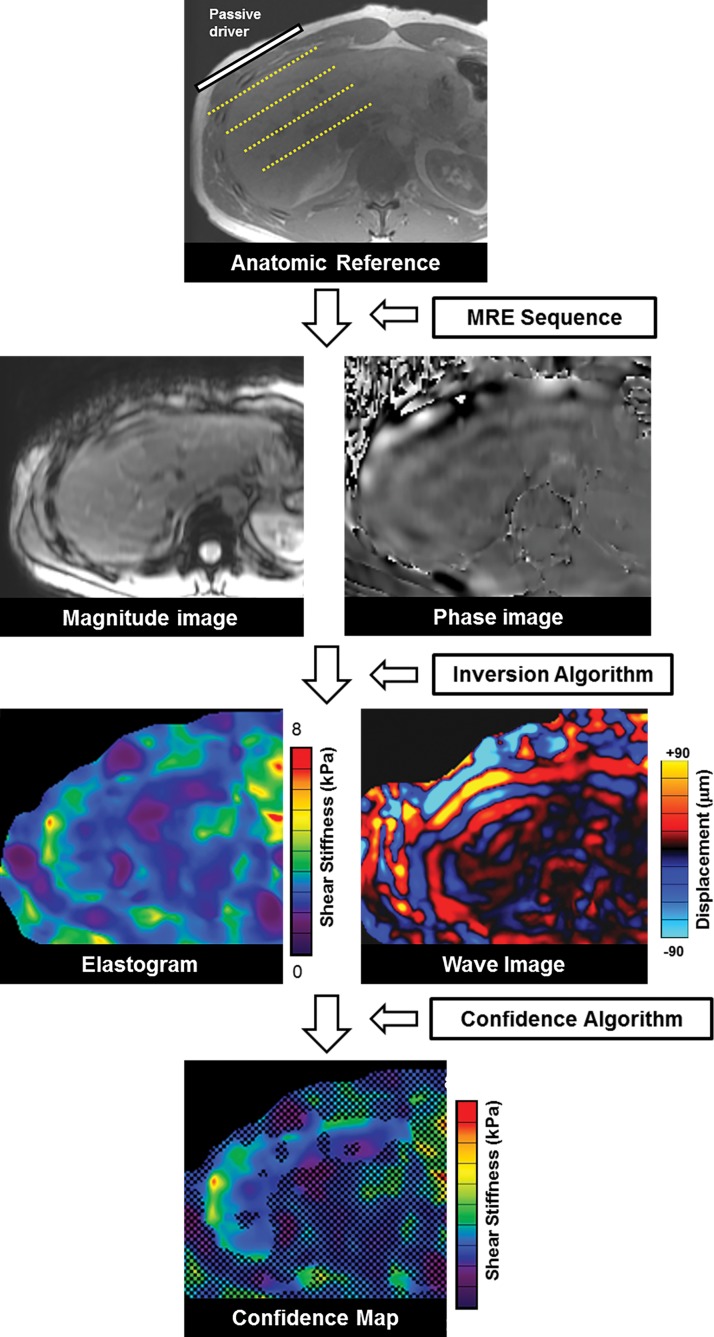
The spatial location of shear waves traveling through the liver is mapped by using a modified phase-contrast pulse sequence that is synchronized to the frequency of the mechanical waves (Fig 12) (34). This sequence is referred to as the “MR elastography sequence.” The most commonly used MR elastography sequence is a two-dimensional gradient-echo sequence that uses motion-encoding gradients (34,65,66). Four phase offsets between the wave and the motion-encoding gradients are used to obtain displacement information. Tissue displacements on the order of nanometers or micrometers are then measured with the MR elastography sequence to produce two sets of raw-data images that carry the information about propagating shear waves: the magnitude images and the phase images.
Figure 12.
Schematic overview of production of MR elastographic images. Shear waves coursing through the patient’s liver create displacement, which is detected and measured by the MR elastography (MRE) sequence to generate the magnitude and phase images. These images are subsequently analyzed with an inversion algorithm to produce an elastogram that is color coded to represent stiffness in kilopascals and a set of wave images to show propagation of shear waves through the liver. A confidence algorithm is used to place a checkerboard pattern over all but the highest regions of statistical confidence, to form the confidence map.
The magnitude images and the phase images are analyzed with an automated “inversion algorithm,” which produces several postprocessed images, depending on the software version installed on the imaging equipment (67,68). The mechanical property measured with the inversion algorithm is the “magnitude of the complex shear modulus.” This measurement accounts for the properties of both tissue elasticity and tissue viscosity. Images produced with the inversion algorithm include (a) the two-dimensional displacement map called the “wave image,” and (b) a two-dimensional gray or color-coded map of liver stiffness in units of kilopascals that is called an “elastogram.”
In a typical MR elastographic examination, four 10-mm axial sections are acquired through the widest portion of the liver. Each section has typically four to eight wave images. The multiple wave images at each section location show the propagation of the waves through the cross-section of the abdomen when run on a cine loop display. Currently, all major vendors offering MR elastography display the elastogram by using the same standard 0–8-kPa color scale. With some imaging equipment, an additional confidence map may be available, which produces a checkered overlay on the elastogram to indicate the highest regions of statistical confidence (69).
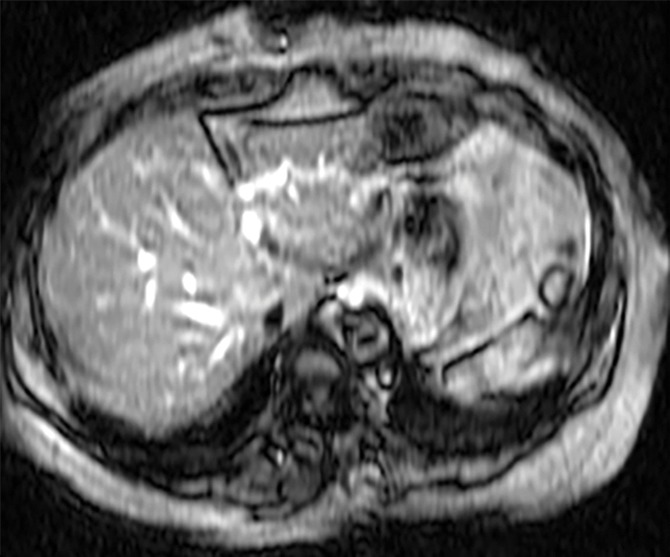
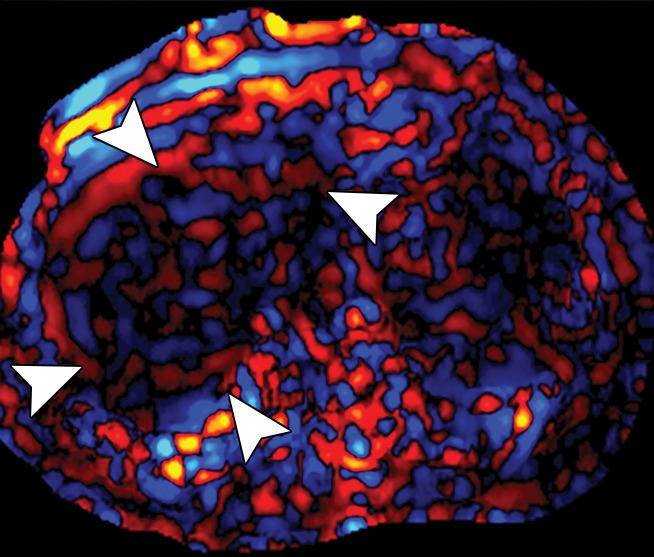
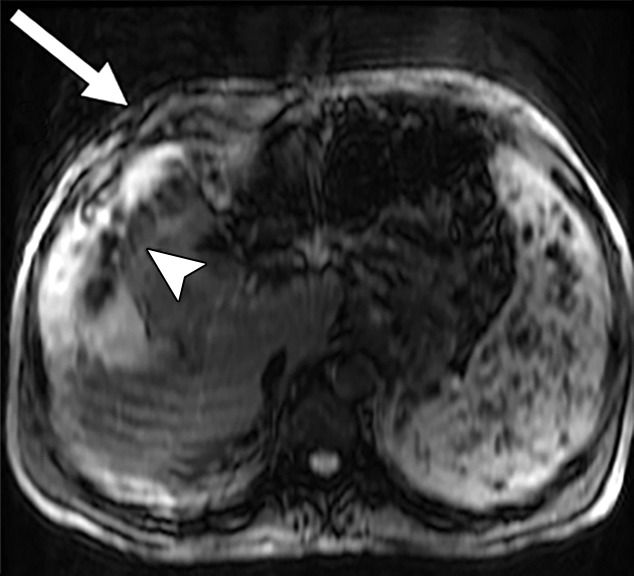
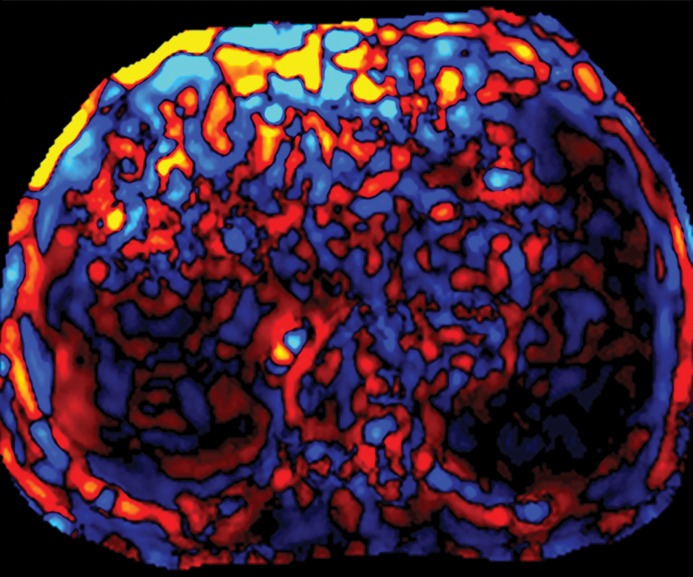
Quality control of the images produced with MR elastography requires several steps to ensure a diagnostic-quality examination and to detect potential confounding causes of altered liver stiffness. Proper driver location over the liver and the absence of interposed air are ensured by identifying the abdominal wall impression created by the driver and the normal focal artifact produced directly beneath the driver on the magnitude images (Fig 13). The wave image is reviewed to ensure adequate and uniform wave propagation through the liver and to identify regions of wave interference, which may create artifactually high or low stiffness values. If either of these steps identifies abnormal wave transmission, it may be necessary to move the driver to a more-optimal position and verify that all tubing is properly connected.
Figure 13a.
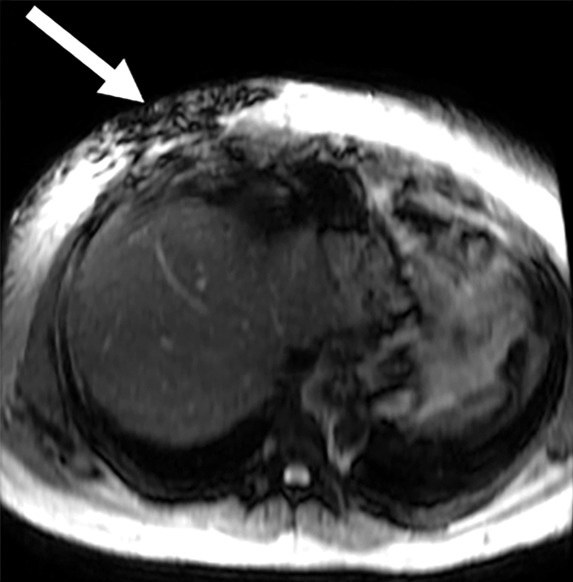
Assessment of adequate wave propagation at MR elastography illustrated with images from four different patients. (a, b) Normal wave propagation. A magnitude image (a) depicts a focal region of artifact (arrow on a) directly beneath the passive driver, which is a reliable indicator that the generator is turned on and that the driver is transmitting pressure waves. The wave image (b) in this case shows wide waves that are due to the stiff parenchyma (arrows on b). (c, d) No wave propagation: images obtained with the driver tubing disconnected. A magnitude image (c) shows the absence of subcutaneous artifact within the subcutaneous fat. The wave image (d) in this case shows variable signal intensity in the liver (arrowheads on d) caused by noise, with a lack of propagating waves. (e, f) Poor wave propagation because of interposed colon. A magnitude image (e) shows a normal artifact (arrow on e) under the passive driver, but the wave image (f) shows a lack of propagating waves in the liver. The cause was interposed colon, which can be recognized by identifying the susceptibility artifact (arrowhead on e) from the luminal gas. (g, h) Successful wave propagation with the driver placed over the left lobe. MR elastography with the driver over the right lobe had failed to produce waves because of interposed colon secondary to right hepatic atrophy. The magnitude image (g) obtained after the driver was moved to a midline position shows a normal susceptibility artifact (arrow on g) over the left hepatic lobe. The wave image (h) shows that this adjustment in the driver position resulted in good-quality wave propagation (arrowheads on h) in the left hepatic lobe.
Figure 13b.
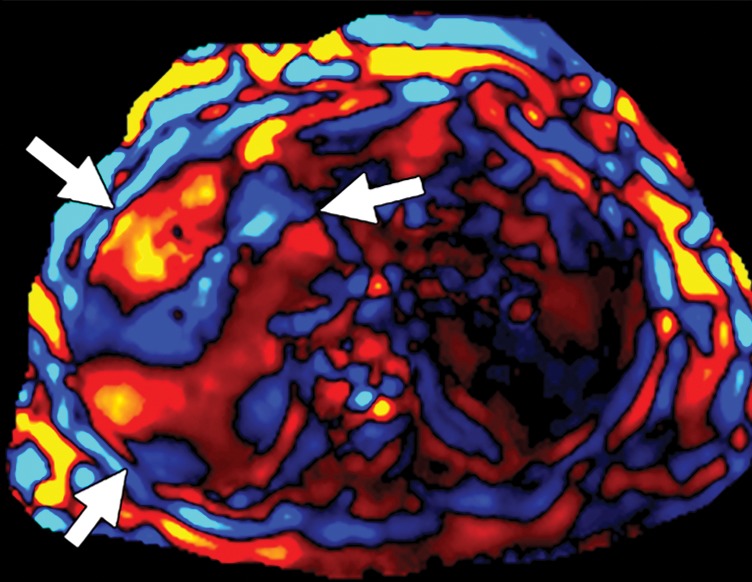
Assessment of adequate wave propagation at MR elastography illustrated with images from four different patients. (a, b) Normal wave propagation. A magnitude image (a) depicts a focal region of artifact (arrow on a) directly beneath the passive driver, which is a reliable indicator that the generator is turned on and that the driver is transmitting pressure waves. The wave image (b) in this case shows wide waves that are due to the stiff parenchyma (arrows on b). (c, d) No wave propagation: images obtained with the driver tubing disconnected. A magnitude image (c) shows the absence of subcutaneous artifact within the subcutaneous fat. The wave image (d) in this case shows variable signal intensity in the liver (arrowheads on d) caused by noise, with a lack of propagating waves. (e, f) Poor wave propagation because of interposed colon. A magnitude image (e) shows a normal artifact (arrow on e) under the passive driver, but the wave image (f) shows a lack of propagating waves in the liver. The cause was interposed colon, which can be recognized by identifying the susceptibility artifact (arrowhead on e) from the luminal gas. (g, h) Successful wave propagation with the driver placed over the left lobe. MR elastography with the driver over the right lobe had failed to produce waves because of interposed colon secondary to right hepatic atrophy. The magnitude image (g) obtained after the driver was moved to a midline position shows a normal susceptibility artifact (arrow on g) over the left hepatic lobe. The wave image (h) shows that this adjustment in the driver position resulted in good-quality wave propagation (arrowheads on h) in the left hepatic lobe.
Figure 13c.
Assessment of adequate wave propagation at MR elastography illustrated with images from four different patients. (a, b) Normal wave propagation. A magnitude image (a) depicts a focal region of artifact (arrow on a) directly beneath the passive driver, which is a reliable indicator that the generator is turned on and that the driver is transmitting pressure waves. The wave image (b) in this case shows wide waves that are due to the stiff parenchyma (arrows on b). (c, d) No wave propagation: images obtained with the driver tubing disconnected. A magnitude image (c) shows the absence of subcutaneous artifact within the subcutaneous fat. The wave image (d) in this case shows variable signal intensity in the liver (arrowheads on d) caused by noise, with a lack of propagating waves. (e, f) Poor wave propagation because of interposed colon. A magnitude image (e) shows a normal artifact (arrow on e) under the passive driver, but the wave image (f) shows a lack of propagating waves in the liver. The cause was interposed colon, which can be recognized by identifying the susceptibility artifact (arrowhead on e) from the luminal gas. (g, h) Successful wave propagation with the driver placed over the left lobe. MR elastography with the driver over the right lobe had failed to produce waves because of interposed colon secondary to right hepatic atrophy. The magnitude image (g) obtained after the driver was moved to a midline position shows a normal susceptibility artifact (arrow on g) over the left hepatic lobe. The wave image (h) shows that this adjustment in the driver position resulted in good-quality wave propagation (arrowheads on h) in the left hepatic lobe.
Figure 13d.
Assessment of adequate wave propagation at MR elastography illustrated with images from four different patients. (a, b) Normal wave propagation. A magnitude image (a) depicts a focal region of artifact (arrow on a) directly beneath the passive driver, which is a reliable indicator that the generator is turned on and that the driver is transmitting pressure waves. The wave image (b) in this case shows wide waves that are due to the stiff parenchyma (arrows on b). (c, d) No wave propagation: images obtained with the driver tubing disconnected. A magnitude image (c) shows the absence of subcutaneous artifact within the subcutaneous fat. The wave image (d) in this case shows variable signal intensity in the liver (arrowheads on d) caused by noise, with a lack of propagating waves. (e, f) Poor wave propagation because of interposed colon. A magnitude image (e) shows a normal artifact (arrow on e) under the passive driver, but the wave image (f) shows a lack of propagating waves in the liver. The cause was interposed colon, which can be recognized by identifying the susceptibility artifact (arrowhead on e) from the luminal gas. (g, h) Successful wave propagation with the driver placed over the left lobe. MR elastography with the driver over the right lobe had failed to produce waves because of interposed colon secondary to right hepatic atrophy. The magnitude image (g) obtained after the driver was moved to a midline position shows a normal susceptibility artifact (arrow on g) over the left hepatic lobe. The wave image (h) shows that this adjustment in the driver position resulted in good-quality wave propagation (arrowheads on h) in the left hepatic lobe.
Figure 13e.
Assessment of adequate wave propagation at MR elastography illustrated with images from four different patients. (a, b) Normal wave propagation. A magnitude image (a) depicts a focal region of artifact (arrow on a) directly beneath the passive driver, which is a reliable indicator that the generator is turned on and that the driver is transmitting pressure waves. The wave image (b) in this case shows wide waves that are due to the stiff parenchyma (arrows on b). (c, d) No wave propagation: images obtained with the driver tubing disconnected. A magnitude image (c) shows the absence of subcutaneous artifact within the subcutaneous fat. The wave image (d) in this case shows variable signal intensity in the liver (arrowheads on d) caused by noise, with a lack of propagating waves. (e, f) Poor wave propagation because of interposed colon. A magnitude image (e) shows a normal artifact (arrow on e) under the passive driver, but the wave image (f) shows a lack of propagating waves in the liver. The cause was interposed colon, which can be recognized by identifying the susceptibility artifact (arrowhead on e) from the luminal gas. (g, h) Successful wave propagation with the driver placed over the left lobe. MR elastography with the driver over the right lobe had failed to produce waves because of interposed colon secondary to right hepatic atrophy. The magnitude image (g) obtained after the driver was moved to a midline position shows a normal susceptibility artifact (arrow on g) over the left hepatic lobe. The wave image (h) shows that this adjustment in the driver position resulted in good-quality wave propagation (arrowheads on h) in the left hepatic lobe.
Figure 13f.
Assessment of adequate wave propagation at MR elastography illustrated with images from four different patients. (a, b) Normal wave propagation. A magnitude image (a) depicts a focal region of artifact (arrow on a) directly beneath the passive driver, which is a reliable indicator that the generator is turned on and that the driver is transmitting pressure waves. The wave image (b) in this case shows wide waves that are due to the stiff parenchyma (arrows on b). (c, d) No wave propagation: images obtained with the driver tubing disconnected. A magnitude image (c) shows the absence of subcutaneous artifact within the subcutaneous fat. The wave image (d) in this case shows variable signal intensity in the liver (arrowheads on d) caused by noise, with a lack of propagating waves. (e, f) Poor wave propagation because of interposed colon. A magnitude image (e) shows a normal artifact (arrow on e) under the passive driver, but the wave image (f) shows a lack of propagating waves in the liver. The cause was interposed colon, which can be recognized by identifying the susceptibility artifact (arrowhead on e) from the luminal gas. (g, h) Successful wave propagation with the driver placed over the left lobe. MR elastography with the driver over the right lobe had failed to produce waves because of interposed colon secondary to right hepatic atrophy. The magnitude image (g) obtained after the driver was moved to a midline position shows a normal susceptibility artifact (arrow on g) over the left hepatic lobe. The wave image (h) shows that this adjustment in the driver position resulted in good-quality wave propagation (arrowheads on h) in the left hepatic lobe.
Figure 13g.
Assessment of adequate wave propagation at MR elastography illustrated with images from four different patients. (a, b) Normal wave propagation. A magnitude image (a) depicts a focal region of artifact (arrow on a) directly beneath the passive driver, which is a reliable indicator that the generator is turned on and that the driver is transmitting pressure waves. The wave image (b) in this case shows wide waves that are due to the stiff parenchyma (arrows on b). (c, d) No wave propagation: images obtained with the driver tubing disconnected. A magnitude image (c) shows the absence of subcutaneous artifact within the subcutaneous fat. The wave image (d) in this case shows variable signal intensity in the liver (arrowheads on d) caused by noise, with a lack of propagating waves. (e, f) Poor wave propagation because of interposed colon. A magnitude image (e) shows a normal artifact (arrow on e) under the passive driver, but the wave image (f) shows a lack of propagating waves in the liver. The cause was interposed colon, which can be recognized by identifying the susceptibility artifact (arrowhead on e) from the luminal gas. (g, h) Successful wave propagation with the driver placed over the left lobe. MR elastography with the driver over the right lobe had failed to produce waves because of interposed colon secondary to right hepatic atrophy. The magnitude image (g) obtained after the driver was moved to a midline position shows a normal susceptibility artifact (arrow on g) over the left hepatic lobe. The wave image (h) shows that this adjustment in the driver position resulted in good-quality wave propagation (arrowheads on h) in the left hepatic lobe.
Figure 13h.
Assessment of adequate wave propagation at MR elastography illustrated with images from four different patients. (a, b) Normal wave propagation. A magnitude image (a) depicts a focal region of artifact (arrow on a) directly beneath the passive driver, which is a reliable indicator that the generator is turned on and that the driver is transmitting pressure waves. The wave image (b) in this case shows wide waves that are due to the stiff parenchyma (arrows on b). (c, d) No wave propagation: images obtained with the driver tubing disconnected. A magnitude image (c) shows the absence of subcutaneous artifact within the subcutaneous fat. The wave image (d) in this case shows variable signal intensity in the liver (arrowheads on d) caused by noise, with a lack of propagating waves. (e, f) Poor wave propagation because of interposed colon. A magnitude image (e) shows a normal artifact (arrow on e) under the passive driver, but the wave image (f) shows a lack of propagating waves in the liver. The cause was interposed colon, which can be recognized by identifying the susceptibility artifact (arrowhead on e) from the luminal gas. (g, h) Successful wave propagation with the driver placed over the left lobe. MR elastography with the driver over the right lobe had failed to produce waves because of interposed colon secondary to right hepatic atrophy. The magnitude image (g) obtained after the driver was moved to a midline position shows a normal susceptibility artifact (arrow on g) over the left hepatic lobe. The wave image (h) shows that this adjustment in the driver position resulted in good-quality wave propagation (arrowheads on h) in the left hepatic lobe.
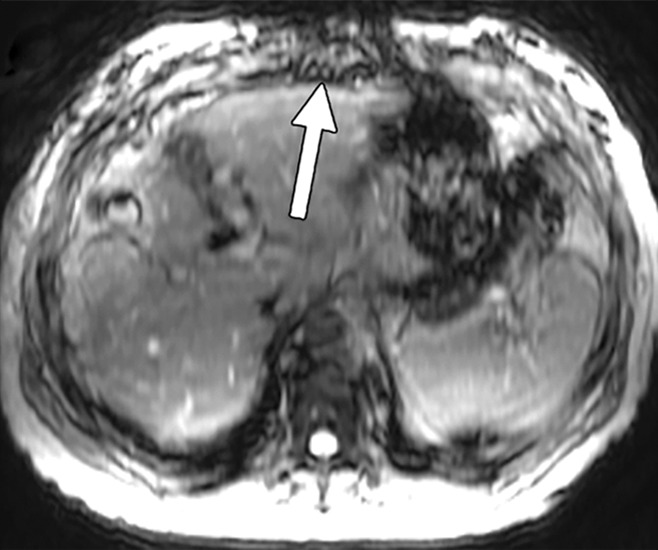
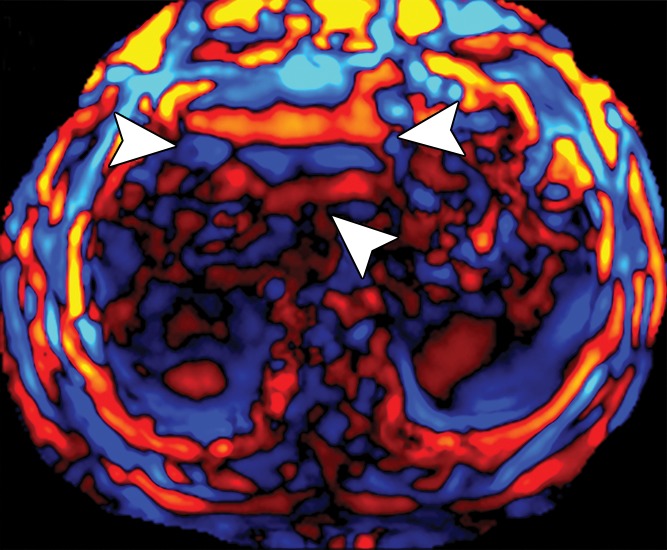
Calculating liver stiffness from the elastogram requires a systematic approach to drawing an ROI. An ROI is typically drawn on each of four axial images, and the mean stiffness is reported. To properly draw an ROI, artifacts must be excluded, including the edge artifact, fossae and fissures, large (>3-mm) vessels, regions of wave interference, and the artifactual “hot spot”; examples of these artifacts are provided in Figure 14 (57). Areas of low statistical confidence are also typically excluded from the reported measurement. The findings from early work with an automated algorithm to generate stiffness calculations from the elastogram have shown promising results and may soon negate the need for manual drawing of an ROI (70). Stiffness values are often reported as a mean and range. It is important to recognize that MR elastographic stiffness values increase with the frequency of applied mechanical waves; thus, stiffness values obtained with MR elastography at 60 Hz cannot be directly compared with values obtained with MR elastography performed at other frequencies. In addition, the methods and assumptions used in stiffness calculations differ between MR elastography and US-based methods, and so the stiffness values from each modality are not directly comparable (54).
Figure 14a.
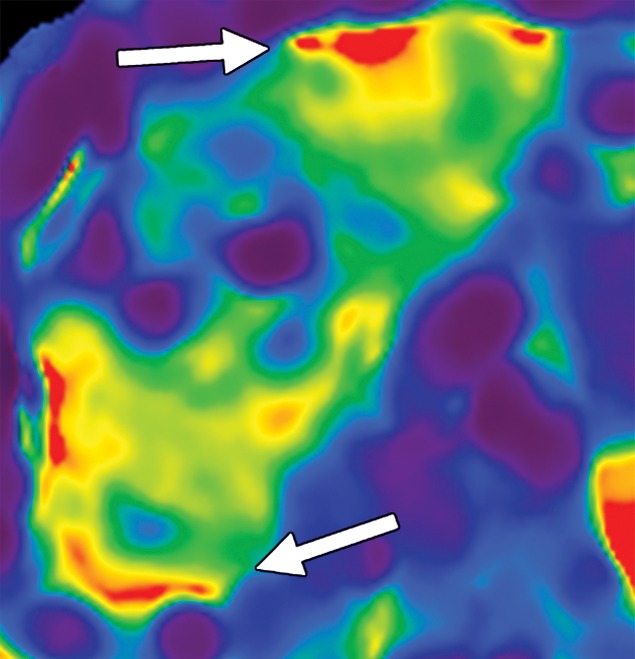
Artifacts that should be excluded from MR elastographic measurements of stiffness. (a) MR elastogram: For ROI placement, typically about 1 cm, or one-half of a wavelength, is excluded around the edge of the liver, including fissures and fossa, to account for partial volume effects (arrows), which may result in an artificially high stiffness calculation. (b) MR elastogram shows an artifactual “hot spot” (arrow) that is often found directly under the passive driver. (c, d) Axial diffusion-weighted MR image (c) and MR elastogram (d) show that large (>3-mm) vessels (arrows) do not reflect parenchymal stiffness. (e, f) A wave image (e) and MR elastogram (f) show that regions of wave interference (arrow) can be constructive or destructive, resulting in variable effects on the liver stiffness.
Figure 14b.
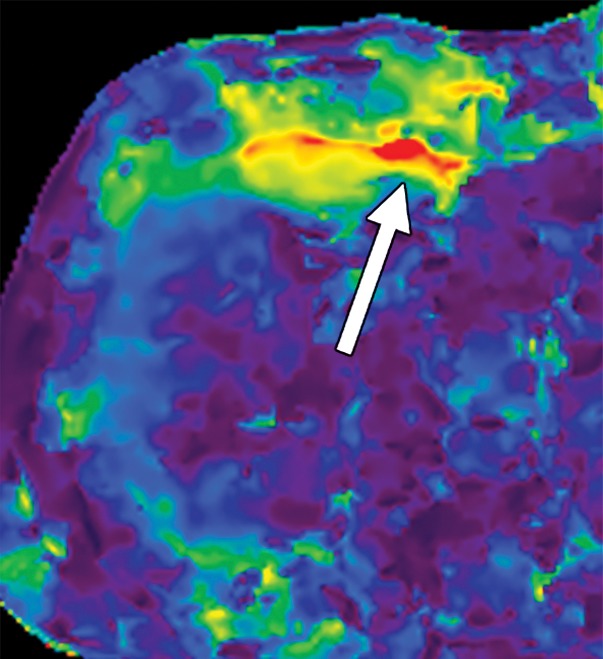
Artifacts that should be excluded from MR elastographic measurements of stiffness. (a) MR elastogram: For ROI placement, typically about 1 cm, or one-half of a wavelength, is excluded around the edge of the liver, including fissures and fossa, to account for partial volume effects (arrows), which may result in an artificially high stiffness calculation. (b) MR elastogram shows an artifactual “hot spot” (arrow) that is often found directly under the passive driver. (c, d) Axial diffusion-weighted MR image (c) and MR elastogram (d) show that large (>3-mm) vessels (arrows) do not reflect parenchymal stiffness. (e, f) A wave image (e) and MR elastogram (f) show that regions of wave interference (arrow) can be constructive or destructive, resulting in variable effects on the liver stiffness.
Figure 14c.
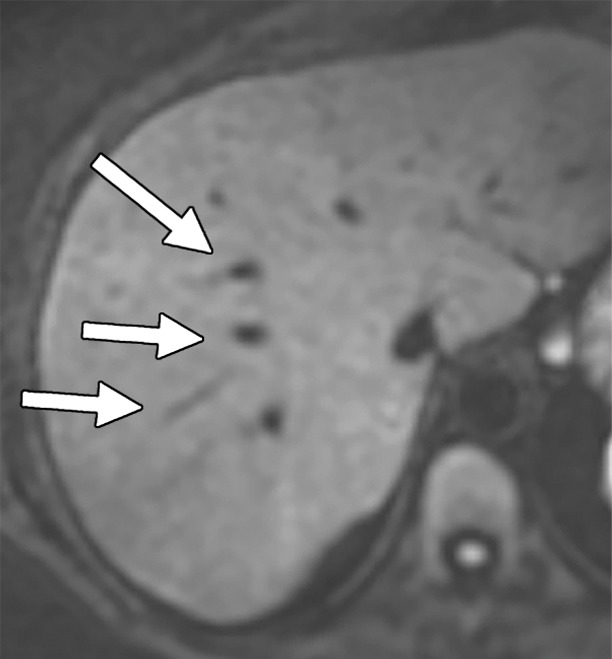
Artifacts that should be excluded from MR elastographic measurements of stiffness. (a) MR elastogram: For ROI placement, typically about 1 cm, or one-half of a wavelength, is excluded around the edge of the liver, including fissures and fossa, to account for partial volume effects (arrows), which may result in an artificially high stiffness calculation. (b) MR elastogram shows an artifactual “hot spot” (arrow) that is often found directly under the passive driver. (c, d) Axial diffusion-weighted MR image (c) and MR elastogram (d) show that large (>3-mm) vessels (arrows) do not reflect parenchymal stiffness. (e, f) A wave image (e) and MR elastogram (f) show that regions of wave interference (arrow) can be constructive or destructive, resulting in variable effects on the liver stiffness.
Figure 14d.
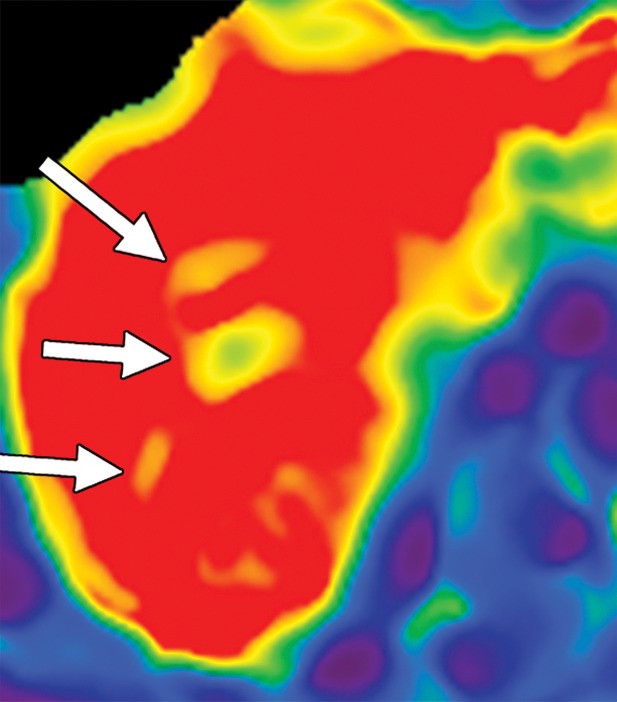
Artifacts that should be excluded from MR elastographic measurements of stiffness. (a) MR elastogram: For ROI placement, typically about 1 cm, or one-half of a wavelength, is excluded around the edge of the liver, including fissures and fossa, to account for partial volume effects (arrows), which may result in an artificially high stiffness calculation. (b) MR elastogram shows an artifactual “hot spot” (arrow) that is often found directly under the passive driver. (c, d) Axial diffusion-weighted MR image (c) and MR elastogram (d) show that large (>3-mm) vessels (arrows) do not reflect parenchymal stiffness. (e, f) A wave image (e) and MR elastogram (f) show that regions of wave interference (arrow) can be constructive or destructive, resulting in variable effects on the liver stiffness.
Figure 14e.
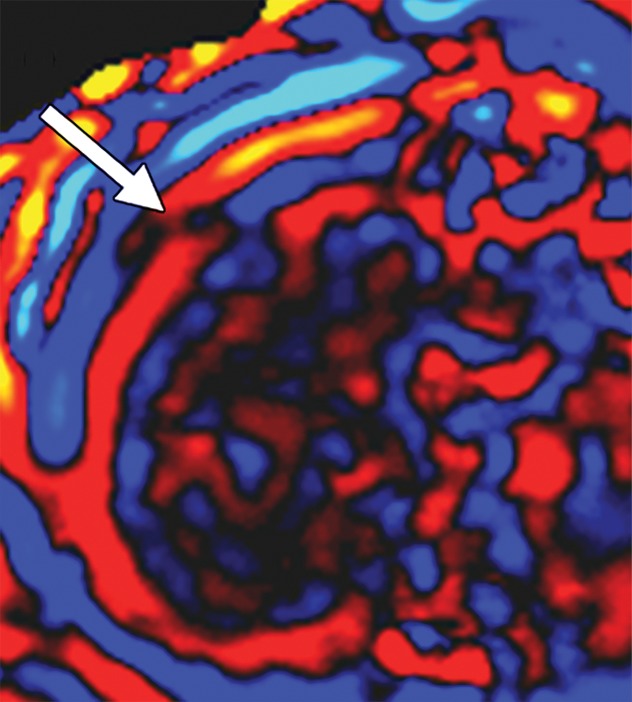
Artifacts that should be excluded from MR elastographic measurements of stiffness. (a) MR elastogram: For ROI placement, typically about 1 cm, or one-half of a wavelength, is excluded around the edge of the liver, including fissures and fossa, to account for partial volume effects (arrows), which may result in an artificially high stiffness calculation. (b) MR elastogram shows an artifactual “hot spot” (arrow) that is often found directly under the passive driver. (c, d) Axial diffusion-weighted MR image (c) and MR elastogram (d) show that large (>3-mm) vessels (arrows) do not reflect parenchymal stiffness. (e, f) A wave image (e) and MR elastogram (f) show that regions of wave interference (arrow) can be constructive or destructive, resulting in variable effects on the liver stiffness.
Figure 14f.
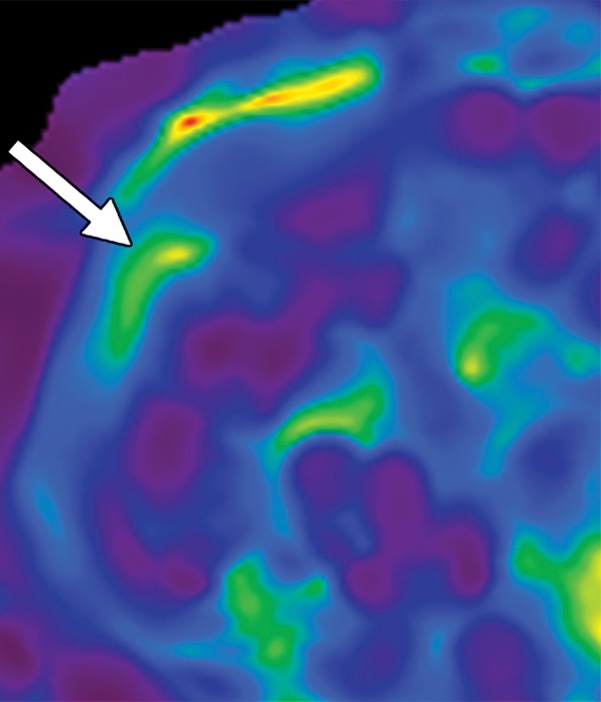
Artifacts that should be excluded from MR elastographic measurements of stiffness. (a) MR elastogram: For ROI placement, typically about 1 cm, or one-half of a wavelength, is excluded around the edge of the liver, including fissures and fossa, to account for partial volume effects (arrows), which may result in an artificially high stiffness calculation. (b) MR elastogram shows an artifactual “hot spot” (arrow) that is often found directly under the passive driver. (c, d) Axial diffusion-weighted MR image (c) and MR elastogram (d) show that large (>3-mm) vessels (arrows) do not reflect parenchymal stiffness. (e, f) A wave image (e) and MR elastogram (f) show that regions of wave interference (arrow) can be constructive or destructive, resulting in variable effects on the liver stiffness.
MR Elastographic Interpretation
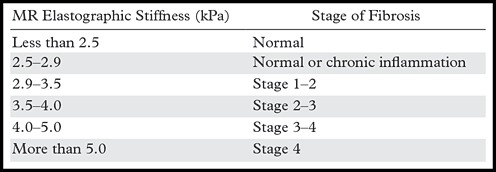
Proper interpretation of MR elastographic stiffness requires further attentive review of the acquired images and exclusion of confounding conditions that may alter liver stiffness. Elevated measurements of liver stiffness are generally a result of chronic liver disease resulting in fibrosis. The correlation between MR elastographic stiffness values and the pathologic degree of fibrosis has been extensively studied, and investigators have shown excellent correlation (71). The relationship between MR elastographic stiffness and the stage of fibrosis is provided in Table 3. It should be recognized that the strength of elastography lies in detecting liver fibrosis and estimating the stage of liver fibrosis, but elastography does not provide a pathologic diagnosis of the cause of fibrosis. If the cause of fibrosis is in question, correlation with conventional images, laboratory findings, clinical factors, and, possibly, biopsy results will be needed.
Table 3:
Correlation between MR Elastographic Stiffness and the Stage of Fibrosis
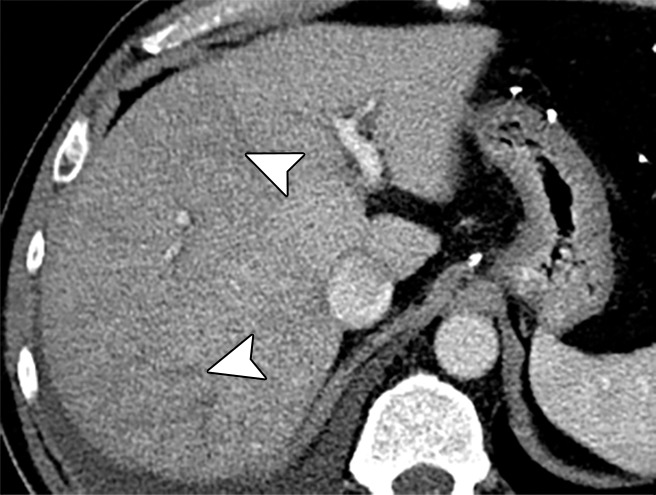
Diseases other than liver fibrosis may be detected as elevated liver stiffness. Common technical factors and patient-related factors that may influence liver stiffness are listed in Tables 4 and 5, respectively. It is necessary to review any anatomic imaging to assess for conditions that are known to influence liver stiffness, including acute inflammation, biliary obstruction, vascular thrombosis, passive hepatic congestion, or neoplasia (Fig 15). The vast majority of these conditions will be readily diagnosed with conventional imaging or clinical evaluation. The three-dimensional representation of liver stiffness in each elastogram stack is a feature unique to MR elastography. The spatial representation of liver stiffness allows the capability of characterizing patterns of stiffness that may be correlated with specific entities (Fig 15).
Table 4:
Technical Factors Influencing Liver Stiffness at MR Elastography
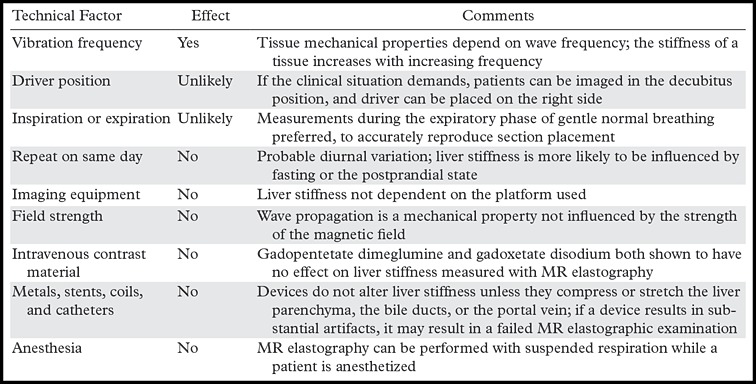
Table 5:
Patient-related Factors Influencing Liver Stiffness
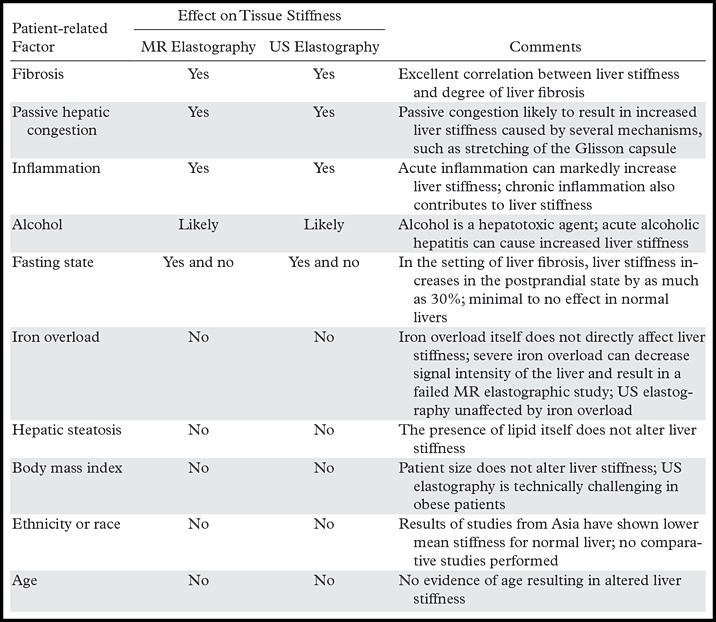
Figure 15a.
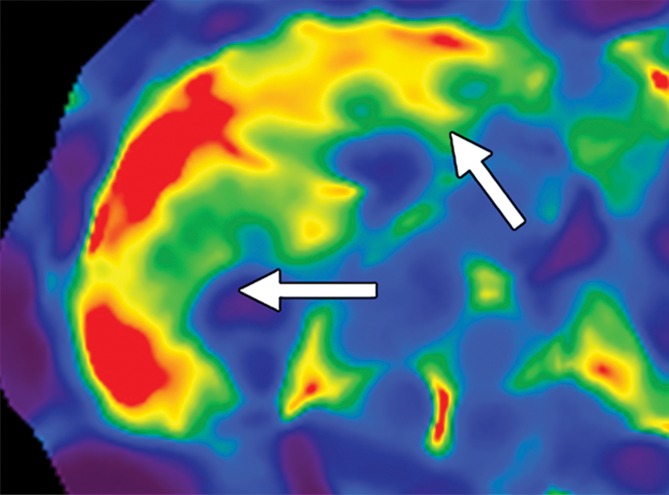
Examples of stiffness patterns at MR elastography that can be correlated to findings at anatomic imaging in three different patients. (a, b) Constrictive pericarditis in a 65-year-old man. MR elastogram (a) shows peripheral increased stiffness (arrows on a), which is often seen with passive hepatic congestion and is not necessarily reflective of underlying hepatic fibrosis. The corresponding anatomic axial contrast-enhanced CT image (b) shows findings of congestive hepatopathy, including altered perfusion of the peripheral liver (arrowheads on b), a finding that corresponds to the region of increased stiffness. (c, d) Primary sclerosing cholangitis in a 55-year-old woman. MR elastogram (c) shows focal increased stiffness (arrow on c), and the anatomic axial T2-weighted MR image (d) shows that this finding corresponds to a dilated bile duct (arrowhead on d). (e, f) Autoimmune hepatitis in a 64-year-old woman. MR elastogram (e) shows diffusely abnormal liver stiffness, with focally increased stiffness in the right hepatic lobe (arrow on e); and the corresponding axial T2-weighted MR anatomic image shows that the focal stiffness corresponds to a region of confluent fibrosis (arrowheads on f).
Figure 15b.
Examples of stiffness patterns at MR elastography that can be correlated to findings at anatomic imaging in three different patients. (a, b) Constrictive pericarditis in a 65-year-old man. MR elastogram (a) shows peripheral increased stiffness (arrows on a), which is often seen with passive hepatic congestion and is not necessarily reflective of underlying hepatic fibrosis. The corresponding anatomic axial contrast-enhanced CT image (b) shows findings of congestive hepatopathy, including altered perfusion of the peripheral liver (arrowheads on b), a finding that corresponds to the region of increased stiffness. (c, d) Primary sclerosing cholangitis in a 55-year-old woman. MR elastogram (c) shows focal increased stiffness (arrow on c), and the anatomic axial T2-weighted MR image (d) shows that this finding corresponds to a dilated bile duct (arrowhead on d). (e, f) Autoimmune hepatitis in a 64-year-old woman. MR elastogram (e) shows diffusely abnormal liver stiffness, with focally increased stiffness in the right hepatic lobe (arrow on e); and the corresponding axial T2-weighted MR anatomic image shows that the focal stiffness corresponds to a region of confluent fibrosis (arrowheads on f).
Figure 15c.

Examples of stiffness patterns at MR elastography that can be correlated to findings at anatomic imaging in three different patients. (a, b) Constrictive pericarditis in a 65-year-old man. MR elastogram (a) shows peripheral increased stiffness (arrows on a), which is often seen with passive hepatic congestion and is not necessarily reflective of underlying hepatic fibrosis. The corresponding anatomic axial contrast-enhanced CT image (b) shows findings of congestive hepatopathy, including altered perfusion of the peripheral liver (arrowheads on b), a finding that corresponds to the region of increased stiffness. (c, d) Primary sclerosing cholangitis in a 55-year-old woman. MR elastogram (c) shows focal increased stiffness (arrow on c), and the anatomic axial T2-weighted MR image (d) shows that this finding corresponds to a dilated bile duct (arrowhead on d). (e, f) Autoimmune hepatitis in a 64-year-old woman. MR elastogram (e) shows diffusely abnormal liver stiffness, with focally increased stiffness in the right hepatic lobe (arrow on e); and the corresponding axial T2-weighted MR anatomic image shows that the focal stiffness corresponds to a region of confluent fibrosis (arrowheads on f).
Figure 15d.
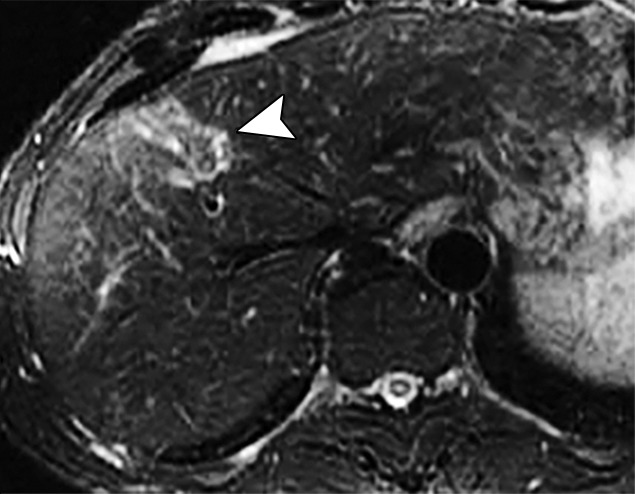
Examples of stiffness patterns at MR elastography that can be correlated to findings at anatomic imaging in three different patients. (a, b) Constrictive pericarditis in a 65-year-old man. MR elastogram (a) shows peripheral increased stiffness (arrows on a), which is often seen with passive hepatic congestion and is not necessarily reflective of underlying hepatic fibrosis. The corresponding anatomic axial contrast-enhanced CT image (b) shows findings of congestive hepatopathy, including altered perfusion of the peripheral liver (arrowheads on b), a finding that corresponds to the region of increased stiffness. (c, d) Primary sclerosing cholangitis in a 55-year-old woman. MR elastogram (c) shows focal increased stiffness (arrow on c), and the anatomic axial T2-weighted MR image (d) shows that this finding corresponds to a dilated bile duct (arrowhead on d). (e, f) Autoimmune hepatitis in a 64-year-old woman. MR elastogram (e) shows diffusely abnormal liver stiffness, with focally increased stiffness in the right hepatic lobe (arrow on e); and the corresponding axial T2-weighted MR anatomic image shows that the focal stiffness corresponds to a region of confluent fibrosis (arrowheads on f).
Figure 15e.
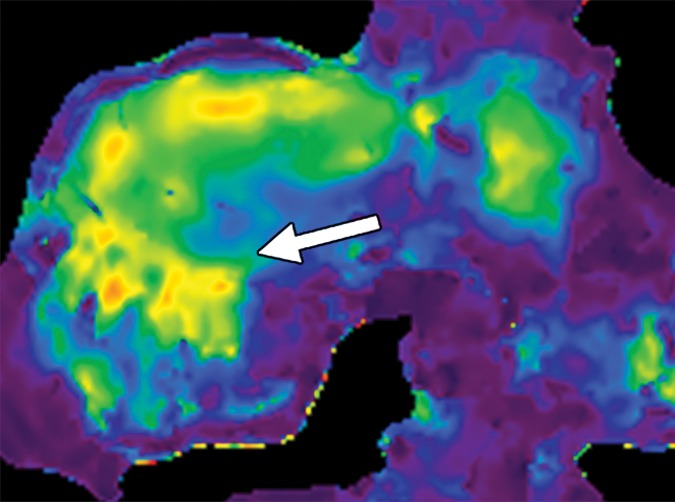
Examples of stiffness patterns at MR elastography that can be correlated to findings at anatomic imaging in three different patients. (a, b) Constrictive pericarditis in a 65-year-old man. MR elastogram (a) shows peripheral increased stiffness (arrows on a), which is often seen with passive hepatic congestion and is not necessarily reflective of underlying hepatic fibrosis. The corresponding anatomic axial contrast-enhanced CT image (b) shows findings of congestive hepatopathy, including altered perfusion of the peripheral liver (arrowheads on b), a finding that corresponds to the region of increased stiffness. (c, d) Primary sclerosing cholangitis in a 55-year-old woman. MR elastogram (c) shows focal increased stiffness (arrow on c), and the anatomic axial T2-weighted MR image (d) shows that this finding corresponds to a dilated bile duct (arrowhead on d). (e, f) Autoimmune hepatitis in a 64-year-old woman. MR elastogram (e) shows diffusely abnormal liver stiffness, with focally increased stiffness in the right hepatic lobe (arrow on e); and the corresponding axial T2-weighted MR anatomic image shows that the focal stiffness corresponds to a region of confluent fibrosis (arrowheads on f).
Figure 15f.
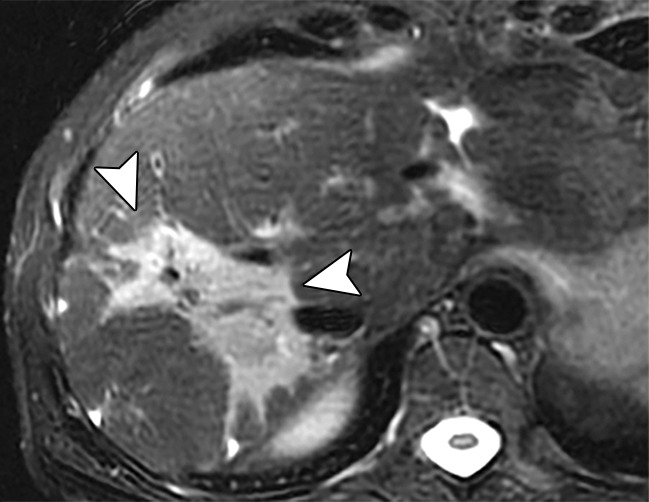
Examples of stiffness patterns at MR elastography that can be correlated to findings at anatomic imaging in three different patients. (a, b) Constrictive pericarditis in a 65-year-old man. MR elastogram (a) shows peripheral increased stiffness (arrows on a), which is often seen with passive hepatic congestion and is not necessarily reflective of underlying hepatic fibrosis. The corresponding anatomic axial contrast-enhanced CT image (b) shows findings of congestive hepatopathy, including altered perfusion of the peripheral liver (arrowheads on b), a finding that corresponds to the region of increased stiffness. (c, d) Primary sclerosing cholangitis in a 55-year-old woman. MR elastogram (c) shows focal increased stiffness (arrow on c), and the anatomic axial T2-weighted MR image (d) shows that this finding corresponds to a dilated bile duct (arrowhead on d). (e, f) Autoimmune hepatitis in a 64-year-old woman. MR elastogram (e) shows diffusely abnormal liver stiffness, with focally increased stiffness in the right hepatic lobe (arrow on e); and the corresponding axial T2-weighted MR anatomic image shows that the focal stiffness corresponds to a region of confluent fibrosis (arrowheads on f).
Liver Elastography: Future Directions
Liver elastography is an area of dynamic research with many emerging indications. For example, elastography is being explored as a modality for longitudinal monitoring of liver fibrosis. The noninvasive nature of elastography makes it suitable for repeated use during a period of time. Elastography-based assessment of liver fibrosis has prognostic value for 5-year survival in patients with chronic hepatitis C (72). It may also be helpful in predicting the risk of hepatic complications and features of decompensation (variceal hemorrhage, ascites, hepatic encephalopathy, hepatorenal syndrome, and spontaneous bacterial peritonitis) (73,74). Investigation is ongoing with regard to the use of elastography to distinguish an inflammation-related increase in liver stiffness from that related to fibrosis (75). If successful, this distinction could help identify hepatic inflammation in the prefibrosis stage, resulting in earlier treatment. As discussed earlier, spleen stiffness may be a marker for portal hypertension. In addition, spleen stiffness may be a predictor of esophageal varices and bleeding risk (76,77). In patients with hemochromatosis, an algorithm that uses serum ferritin levels together with transient elastography was shown to accurately determine the presence of severe fibrosis in 61% of patients, obviating the need for liver biopsy in this group (78). Advanced MR elastographic techniques have been developed to perform MR elastography in patients with mild to moderate iron overload (79). The use of elastography for the characterization of liver tumors is being actively explored (80,81). Overall, the current and novel elastographic applications are emerging to have practical clinical effects on patient management.
Conclusion
Accurate staging of the degree of fibrosis is essential in the management and determination of the prognosis of patients with chronic liver disease. Although liver biopsy is considered to be the reference standard for assessment of fibrosis, biopsy has several limitations, including its invasive nature, inability to assess the degree of fibrosis throughout the liver, sampling error, and incidence of complications. US elastography and MR elastography have emerged as the modalities of choice for quantifying hepatic fibrosis, proving to be superior to conventional cross-sectional imaging, especially in the precirrhotic stages. The limitations of elastography are mainly technical challenges—US elastography lacks diagnostic threshold standardization across manufacturers and is operator and patient dependent, and MR elastography would benefit from simplification of the technique and reduction of the cost. Manufacturers, national societies, and researchers are working toward overcoming these limitations. The ability of elastography to quantify tissue fibrosis is also becoming incorporated into treatment decision making for a variety of liver disorders.
Recipient of Cum Laude and Certificate of Merit awards for education exhibits at the 2015 RSNA Annual Meeting.
For this journal-based SA-CME activity, the authors B.M.Y. and R.L.E. have provided disclosures (see “Disclosures of Conflicts of Interest”); all other authors, the editor, and the reviewers have disclosed no relevant relationships.
Disclosures of Conflicts of Interest.— : B.M.Y. Activities related to the present article: disclosed no relevant relationships. Activities not related to the present article: grant from GE Healthcare; royalties from Oxford University Press; shareholder in Nextrast. Other activities: disclosed no relevant relationships. R.L.E. Activities related to the present article: disclosed no relevant relationships. Activities not related to the present article: grant from Resoundant; licensing royalties from Resoundant for MR elastography patents; CEO of Resoundant. Other activities: disclosed no relevant relationships.
Abbreviations:
- Az
- area under the receiver operating curve
- ROI
- region of interest
References
- 1.Sebastiani G, Castera L, Halfon P, et al. The impact of liver disease aetiology and the stages of hepatic fibrosis on the performance of non-invasive fibrosis biomarkers: an international study of 2411 cases. Aliment Pharmacol Ther 2011;34(10):1202–1216. [DOI] [PubMed] [Google Scholar]
- 2.Centers for Disease Control and Prevention . Viral hepatitis. Centers for Disease Control and Prevention website. http://www.cdc.gov/hepatitis/index.htm. Updated September 18, 2014. Accessed March 1, 2016.
- 3.Friedman SL. Liver fibrosis: from bench to bedside. J Hepatol 2003;38(suppl 1):S38–S53. [DOI] [PubMed] [Google Scholar]
- 4.Nagaoki Y, Aikata H, Nakano N, et al. Development of hepatocellular carcinoma in patients with hepatitis C virus infection who achieved sustained virological response following interferon therapy: a large-scale, long-term cohort study. J Gastroenterol Hepatol 2016;31(5):1009–1015. [DOI] [PubMed] [Google Scholar]
- 5.Ko CJ, Lin PY, Lin KH, Lin CC, Chen YL. Presence of fibrosis is predictive of postoperative survival in patients with small hepatocellular carcinoma. Hepatogastroenterology 2014;61(136):2295–2300. [PubMed] [Google Scholar]
- 6.Bravo AA, Sheth SG, Chopra S. Liver biopsy. N Engl J Med 2001;344(7):495–500. [DOI] [PubMed] [Google Scholar]
- 7.Cholongitas E, Senzolo M, Standish R, et al. A systematic review of the quality of liver biopsy specimens. Am J Clin Pathol 2006;125(5):710–721. [DOI] [PubMed] [Google Scholar]
- 8.Ishak K, Baptista A, Bianchi L, et al. Histological grading and staging of chronic hepatitis. J Hepatol 1995;22(6):696–699. [DOI] [PubMed] [Google Scholar]
- 9.Gilmore IT, Burroughs A, Murray-Lyon IM, Williams R, Jenkins D, Hopkins A. Indications, methods, and outcomes of percutaneous liver biopsy in England and Wales: an audit by the British Society of Gastroenterology and the Royal College of Physicians of London. Gut 1995;36(3): 437–441. [DOI] [PMC free article] [PubMed] [Google Scholar]
- 10.McGill DB, Rakela J, Zinsmeister AR, Ott BJ. A 21-year experience with major hemorrhage after percutaneous liver biopsy. Gastroenterology 1990;99(5):1396–1400. [DOI] [PubMed] [Google Scholar]
- 11.Cadranel JF, Rufat P, Degos F; for the Group of Epidemiology of the French Association for the Study of the Liver (AFEF). Practices of liver biopsy in France: results of a prospective nationwide survey. Hepatology 2000;32(3):477–481. [DOI] [PubMed] [Google Scholar]
- 12.Afdhal NH. Diagnosing fibrosis in hepatitis C: is the pendulum swinging from biopsy to blood tests? Hepatology 2003; 37(5):972–974. [DOI] [PubMed] [Google Scholar]
- 13.Bedossa P, Dargère D, Paradis V. Sampling variability of liver fibrosis in chronic hepatitis C. Hepatology 2003;38(6): 1449–1457. [DOI] [PubMed] [Google Scholar]
- 14.Rousselet MC, Michalak S, Dupré F, et al. Sources of variability in histological scoring of chronic viral hepatitis. Hepatology 2005;41(2):257–264. [DOI] [PubMed] [Google Scholar]
- 15.Bedrossa P; French METAVIR Cooperative Study Group. Intraobserver and interobserver variations in liver biopsy interpretation in patients with chronic hepatitis C. Hepatology 1994;20(1 pt 1):15–20. [PubMed] [Google Scholar]
- 16.Regev A, Berho M, Jeffers LJ, et al. Sampling error and intraobserver variation in liver biopsy in patients with chronic HCV infection. Am J Gastroenterol 2002;97(10):2614–2618. [DOI] [PubMed] [Google Scholar]
- 17.Stasi C, Milani S. Non-invasive assessment of liver fibrosis: between prediction/prevention of outcomes and cost-effectiveness. World J Gastroenterol 2016;22(4):1711–1720. [DOI] [PMC free article] [PubMed] [Google Scholar]
- 18.Liu T, Wang X, Karsdal MA, Leeming DJ, Genovese F. Molecular serum markers of liver fibrosis. Biomark Insights 2012;7:105–117. [DOI] [PMC free article] [PubMed] [Google Scholar]
- 19.Becker L, Salameh W, Sferruzza A, et al. Validation of HepaScore, compared with simple indices of fibrosis, in patients with chronic hepatitis C virus infection in United States. Clin Gastroenterol Hepatol 2009;7(6):696–701. [DOI] [PubMed] [Google Scholar]
- 20.Poynard T, Imbert-Bismut F, Munteanu M, et al. Overview of the diagnostic value of biochemical markers of liver fibrosis (FibroTest, HCV FibroSure) and necrosis (ActiTest) in patients with chronic hepatitis C. Comp Hepatol 2004;3(1):8. doi:10.1186/1476-5926-3-8. Published online September 23, 2004. [DOI] [PMC free article] [PubMed] [Google Scholar]
- 21.Bluth EI, Benson CB, Ralls PW, Siegel MJ, eds. Ultrasound: a practical approach to clinical problems. 2nd ed. New York, NY: Thieme, 2007. [Google Scholar]
- 22.Rustogi R, Horowitz J, Harmath C, et al. Accuracy of MR elastography and anatomic MR imaging features in the diagnosis of severe hepatic fibrosis and cirrhosis. J Magn Reson Imaging 2012;35(6):1356–1364. [DOI] [PMC free article] [PubMed] [Google Scholar]
- 23.Aguirre DA, Behling CA, Alpert E, Hassanein TI, Sirlin CB. Liver fibrosis: noninvasive diagnosis with double contrast material–enhanced MR imaging. Radiology 2006;239(2):425–437. [DOI] [PubMed] [Google Scholar]
- 24.Ou HY, Bonekamp S, Bonekamp D, et al. MRI arterial enhancement fraction in hepatic fibrosis and cirrhosis. AJR Am J Roentgenol 2013;201(4):W596–W602. [DOI] [PubMed] [Google Scholar]
- 25.Zissen MH, Wang ZJ, Yee J, Aslam R, Monto A, Yeh BM. Contrast-enhanced CT quantification of the hepatic fractional extracellular space: correlation with diffuse liver disease severity. AJR Am J Roentgenol 2013;201(6):1204–1210. [DOI] [PMC free article] [PubMed] [Google Scholar]
- 26.Venkatesh SK, Yin M, Takahashi N, Glockner JF, Talwalkar JA, Ehman RL. Non-invasive detection of liver fibrosis: MR imaging features vs. MR elastography. Abdom Imaging 2015; 40(4):766–775. [DOI] [PMC free article] [PubMed] [Google Scholar]
- 27.Gennisson JL, Deffieux T, Fink M, Tanter M. Ultrasound elastography: principles and techniques. Diagn Interv Imaging 2013;94(5):487–495. [DOI] [PubMed] [Google Scholar]
- 28.Adams F, ed. The genuine works of Hippocrates. London, England: Adlard, 1849. [Google Scholar]
- 29.Ophir J, Céspedes I, Ponnekanti H, Yazdi Y, Li X. Elastography: a quantitative method for imaging the elasticity of biological tissues. Ultrason Imaging 1991;13(2):111–134. [DOI] [PubMed] [Google Scholar]
- 30.von Gierke HE, Oestreicher HL, Franke EK, Parrack HO, von Wittern WW. Physics of vibrations in living tissues. J Appl Physiol 1952;4(12):886–900. [DOI] [PubMed] [Google Scholar]
- 31.Eisenscher A, Schweg-Toffler E, Pelletier G, Jacquemard P. Rhythmic echographic palpation: echosismography—a new technic of differentiating benign and malignant tumors by ultrasonic study of tissue elasticity [in French]. J Radiol 1983;64(4):255–261. [PubMed] [Google Scholar]
- 32.Birnholz JC, Farrell EE. Fetal lung development: compressibility as a measure of maturity. Radiology 1985;157(2):495–498. [DOI] [PubMed] [Google Scholar]
- 33.Lerner RM, Parker KJ. Sonoelasticity images derived from ultrasound signals in mechanically vibrated targets. In: Tjissen JM, ed. Ultrasonic tissue characterization and echographic imaging 7: proceedings of the seventh European Communities workshop 25-28 October 1987. Luxembourg, the Netherlands: Office for Official Publications of the European Communities, 1987; 127–129. [Google Scholar]
- 34.Muthupillai R, Lomas DJ, Rossman PJ, Greenleaf JF, Manduca A, Ehman RL. Magnetic resonance elastography by direct visualization of propagating acoustic strain waves. Science 1995;269(5232):1854–1857. [DOI] [PubMed] [Google Scholar]
- 35.Catheline S, Wu F, Fink M. A solution to diffraction biases in sonoelasticity: the acoustic impulse technique. J Acoust Soc Am 1999;105(5):2941–2950. [DOI] [PubMed] [Google Scholar]
- 36.Sarvazyan AP, Rudenko OV, Swanson SD, Fowlkes JB, Emelianov SY. Shear wave elasticity imaging: a new ultrasonic technology of medical diagnostics. Ultrasound Med Biol 1998;24(9):1419–1435. [DOI] [PubMed] [Google Scholar]
- 37.Tanter M, Bercoff J, Athanasiou A, et al. Quantitative assessment of breast lesion viscoelasticity: initial clinical results using supersonic shear imaging. Ultrasound Med Biol 2008;34(9):1373–1386. [DOI] [PubMed] [Google Scholar]
- 38.Şirli R, Sporea I, Popescu A, Dănilă M. Ultrasound-based elastography for the diagnosis of portal hypertension in cirrhotics. World J Gastroenterol 2015;21(41):11542–11551. [DOI] [PMC free article] [PubMed] [Google Scholar]
- 39.Bedogni G, Miglioli L, Masutti F, Tiribelli C, Marchesini G, Bellentani S. Prevalence of and risk factors for nonalcoholic fatty liver disease: the Dionysos nutrition and liver study. Hepatology 2005;42(1):44–52. [DOI] [PubMed] [Google Scholar]
- 40.Chalasani N, Younossi Z, Lavine JE, et al. The diagnosis and management of non-alcoholic fatty liver disease: practice guideline by the American Gastroenterological Association, American Association for the Study of Liver Diseases, and American College of Gastroenterology. Gastroenterology 2012;142(7):1592–1609. [DOI] [PubMed] [Google Scholar]
- 41.Lyshchik A, Higashi T, Asato R, et al. Cervical lymph node metastases: diagnosis at sonoelastography—initial experience. Radiology 2007;243(1):258–267. [DOI] [PubMed] [Google Scholar]
- 42.Ko SY, Kim EK, Sung JM, Moon HJ, Kwak JY. Diagnostic performance of ultrasound and ultrasound elastography with respect to physician experience. Ultrasound Med Biol 2014; 40(5):854–863. [DOI] [PubMed] [Google Scholar]
- 43.Armstrong MJ, Corbett C, Hodson J, et al. Operator training requirements and diagnostic accuracy of FibroScan in routine clinical practice. Postgrad Med J 2013;89(1058): 685–692. [DOI] [PMC free article] [PubMed] [Google Scholar]
- 44.Ziol M, Handra-Luca A, Kettaneh A, et al. Noninvasive assessment of liver fibrosis by measurement of stiffness in patients with chronic hepatitis C. Hepatology 2005;41(1):48–54. [DOI] [PubMed] [Google Scholar]
- 45.Sandrin L, Fourquet B, Hasquenoph JM, et al. Transient elastography: a new noninvasive method for assessment of hepatic fibrosis. Ultrasound Med Biol 2003;29(12): 1705–1713. [DOI] [PubMed] [Google Scholar]
- 46.Castéra L, Foucher J, Bernard PH, et al. Pitfalls of liver stiffness measurement: a 5-year prospective study of 13,369 examinations. Hepatology 2010;51(3):828–835. [DOI] [PubMed] [Google Scholar]
- 47.Urban MW, Nenadic IZ, Chen S, Greenleaf JF. Discrepancies in reporting tissue material properties. J Ultrasound Med 2013;32(5):886–888. [DOI] [PMC free article] [PubMed] [Google Scholar]
- 48.Barr RG, Ferraioli G, Palmeri ML, et al. Elastography assessment of liver fibrosis: Society of Radiologists in Ultrasound Consensus Conference Statement. Radiology 2015;276(3): 845–861. [DOI] [PubMed] [Google Scholar]
- 49.Poynard T, Munteanu M, Luckina E, et al. Liver fibrosis evaluation using real-time shear wave elastography: applicability and diagnostic performance using methods without a gold standard. J Hepatol 2013;58(5):928–935. [DOI] [PubMed] [Google Scholar]
- 50.General Electric . LOGIQ E9 shear wave elastography white paper (document ID: JB23292GB). GE website. http://www3.gehealthcare.com/en/products/categories/ultrasound/logiq/logiq_e9. Published online August 2014. Accessed March 1, 2016.
- 51.Swets JA. Measuring the accuracy of diagnostic systems. Science 1988;240(4857):1285–1293. [DOI] [PubMed] [Google Scholar]
- 52.Frulio N, Trillaud H. Ultrasound elastography in liver. Diagn Interv Imaging 2013;94(5):515–534. [DOI] [PubMed] [Google Scholar]
- 53.Feng JC, Li J, Wu XW, Peng XY. Diagnostic accuracy of SuperSonic shear imaging for staging of liver fibrosis: a meta-analysis. J Ultrasound Med 2016;35(2):329–339. [DOI] [PubMed] [Google Scholar]
- 54.Tang A, Cloutier G, Szeverenyi NM, Sirlin CB. Ultrasound elastography and MR elastography for assessing liver fibrosis. I. Principles and techniques. AJR Am J Roentgenol 2015;205(1):22–32. [DOI] [PMC free article] [PubMed] [Google Scholar]
- 55.de Lédinghen V, Vergniol J, Foucher J, El-Hajbi F, Merrouche W, Rigalleau V. Feasibility of liver transient elastography with FibroScan using a new probe for obese patients. Liver Int 2010;30(7):1043–1048. [DOI] [PubMed] [Google Scholar]
- 56.Sasso M, Beaugrand M, de Ledinghen V, et al. Controlled attenuation parameter (CAP): a novel VCTE™ guided ultrasonic attenuation measurement for the evaluation of hepatic steatosis—preliminary study and validation in a cohort of patients with chronic liver disease from various causes. Ultrasound Med Biol 2010;36(11):1825–1835. [DOI] [PubMed] [Google Scholar]
- 57.Venkatesh SK, Ehman RL. Magnetic resonance elastography of abdomen. Abdom Imaging 2015;40(4):745–759. [DOI] [PMC free article] [PubMed] [Google Scholar]
- 58.Venkatesh SK, Yin M, Ehman RL. Magnetic resonance elastography of liver: technique, analysis, and clinical applications. J Magn Reson Imaging 2013;37(3):544–555. [DOI] [PMC free article] [PubMed] [Google Scholar]
- 59.Singh S, Venkatesh SK, Wang Z, et al. Diagnostic performance of magnetic resonance elastography in staging liver fibrosis: a systematic review and meta-analysis of individual participant data. Clin Gastroenterol Hepatol 2015;13(3):440–451.e6. [DOI] [PMC free article] [PubMed] [Google Scholar]
- 60.Venkatesh SK, Wang G, Teo LL, Ang BW. Magnetic resonance elastography of liver in healthy Asians: normal liver stiffness quantification and reproducibility assessment. J Magn Reson Imaging 2014;39(1):1–8. [DOI] [PubMed] [Google Scholar]
- 61.Lee DH, Lee JM, Han JK, Choi BI. MR elastography of healthy liver parenchyma: normal value and reliability of the liver stiffness value measurement. J Magn Reson Imaging 2013;38(5):1215–1223. [DOI] [PubMed] [Google Scholar]
- 62.Lee YJ, Lee JM, Lee JE, et al. MR elastography for noninvasive assessment of hepatic fibrosis: reproducibility of the examination and reproducibility and repeatability of the liver stiffness value measurement. J Magn Reson Imaging 2014;39(2):326–331. [DOI] [PubMed] [Google Scholar]
- 63.Cui J, Heba E, Hernandez C, et al. Magnetic resonance elastography is superior to acoustic radiation force impulse for the diagnosis of fibrosis in patients with biopsy-proven nonalcoholic fatty liver disease: a prospective study. Hepatology 2016;63(2):453–461. [DOI] [PMC free article] [PubMed] [Google Scholar]
- 64.Yin M, Talwalkar JA, Glaser KJ, et al. Assessment of hepatic fibrosis with magnetic resonance elastography. Clin Gastroenterol Hepatol 2007;5(10):1207–1213.e2. [DOI] [PMC free article] [PubMed] [Google Scholar]
- 65.Glaser KJ, Felmlee JP, Ehman RL. Rapid MR elastography using selective excitations. Magn Reson Med 2006;55(6): 1381–1389. [DOI] [PubMed] [Google Scholar]
- 66.Rump J, Klatt D, Braun J, Warmuth C, Sack I. Fractional encoding of harmonic motions in MR elastography. Magn Reson Med 2007;57(2):388–395. [DOI] [PubMed] [Google Scholar]
- 67.Kwon OI, Park C, Nam HS, et al. Shear modulus decomposition algorithm in magnetic resonance elastography. IEEE Trans Med Imaging 2009;28(10):1526–1533. [DOI] [PMC free article] [PubMed] [Google Scholar]
- 68.Oliphant TE, Manduca A, Ehman RL, Greenleaf JF. Complex-valued stiffness reconstruction for magnetic resonance elastography by algebraic inversion of the differential equation. Magn Reson Med 2001;45(2):299–310. [DOI] [PubMed] [Google Scholar]
- 69.Silva AM, Grimm RC, Glaser KJ, et al. Magnetic resonance elastography: evaluation of new inversion algorithm and quantitative analysis method. Abdom Imaging 2015;40(4): 810–817. [DOI] [PubMed] [Google Scholar]
- 70.Dzyubak B, Venkatesh SK, Manduca A, Glaser KJ, Ehman RL. Automated liver elasticity calculation for MR elastography. J Magn Reson Imaging 2016;43(5):1055–1063. [DOI] [PMC free article] [PubMed] [Google Scholar]
- 71.Venkatesh SK, Xu S, Tai D, Yu H, Wee A. Correlation of MR elastography with morphometric quantification of liver fibrosis (Fibro-C-Index) in chronic hepatitis B. Magn Reson Med 2014;72(4):1123–1129. [DOI] [PubMed] [Google Scholar]
- 72.Vergniol J, Foucher J, Terrebonne E, et al. Noninvasive tests for fibrosis and liver stiffness predict 5-year outcomes of patients with chronic hepatitis C. Gastroenterology 2011;140(7):1970–1979, 1979.e1–1979.e3. doi:http://dx.doi.org/10.1053/j.gastro.2011.02.058. Published online March 3, 2011. [DOI] [PubMed] [Google Scholar]
- 73.Pang JX, Zimmer S, Niu S, et al. Liver stiffness by transient elastography predicts liver-related complications and mortality in patients with chronic liver disease. PLoS One 2014;9(4):e95776. http://journals.plos.org/plosone/article?id=10.1371/journal.pone.0095776. Published online April 22, 2014. [DOI] [PMC free article] [PubMed] [Google Scholar]
- 74.Asrani SK, Talwalkar JA, Kamath PS, et al. Role of magnetic resonance elastography in compensated and decompensated liver disease. J Hepatol 2014;60(5):934–939. [DOI] [PMC free article] [PubMed] [Google Scholar]
- 75.Salameh N, Larrat B, Abarca-Quinones J, et al. Early detection of steatohepatitis in fatty rat liver by using MR elastography. Radiology 2009;253(1):90–97. [DOI] [PubMed] [Google Scholar]
- 76.Sharma P, Kirnake V, Tyagi P, et al. Spleen stiffness in patients with cirrhosis in predicting esophageal varices. Am J Gastroenterol 2013;108(7):1101–1107. [DOI] [PubMed] [Google Scholar]
- 77.Talwalkar JA, Yin M, Venkatesh S, et al. Feasibility of in vivo MR elastographic splenic stiffness measurements in the assessment of portal hypertension. AJR Am J Roentgenol 2009;193(1):122–127. [DOI] [PMC free article] [PubMed] [Google Scholar]
- 78.Legros L, Bardou-Jacquet E, Latournerie M, et al. Non-invasive assessment of liver fibrosis in C282Y homozygous HFE hemochromatosis. Liver Int 2015;35(6):1731–1738. [DOI] [PubMed] [Google Scholar]
- 79.Mariappan YK, Dzyubak B, Glaser KJ, et al. Application of modified spin-echo–based sequences for hepatic MR elastography: evaluation, comparison with the conventional gradient-echo sequence, and preliminary clinical experience. Radiology 2016 Aug 10:160153. http://dx.doi.org/10.1148/radiol.2016160153. [DOI] [PMC free article] [PubMed] [Google Scholar]
- 80.Venkatesh SK, Yin M, Glockner JF, et al. MR elastography of liver tumors: preliminary results. AJR Am J Roentgenol 2008;190(6):1534–1540. [DOI] [PMC free article] [PubMed] [Google Scholar]
- 81.Ronot M, Di Renzo S, Gregoli B, et al. Characterization of fortuitously discovered focal liver lesions: additional information provided by shearwave elastography. Eur Radiol 2015;25(2):346–358. [DOI] [PubMed] [Google Scholar]


