

Abstract
Background
Buprenorphine is an effective treatment for opioid use disorder but the supply of buprenorphine physicians is currently inadequate to address the nation’s prescription opioid crisis. Perception of need due to rising opioid overdose rates is one possible reason for physicians to adopt buprenorphine. This study examined associations between rates of growth in buprenorphine physicians and prescription opioid overdose mortality rates in US states.
Methods
The total buprenorphine physician supply and number of physicians approved to treat 100 patients (per 100,000 population) were measured from June, 2013 to January, 2016. States were divided into two groups: those with rates of prescription opioid overdose mortality in 2013 at or above the median (>5.5 deaths per 100,000 population) and those with rates below the median. State-level growth curves were estimated using mixed-effects regression to compare rates of growth between high and low overdose states.
Results
The total supply and the supply of 100-patient buprenorphine physicians grew significantly (total supply from 7.7 to 9.9 per 100,000 population, p<.001; 100-patient supply from 2.2 to 3.4 per 100,000 population, p<.001). Rates of growth were significantly greater in high overdose states when compared to low overdose states (total supply b=.033, p<.01; 100-patient b=.022, p<.01).
Conclusions
The magnitude of the US prescription opioid crisis, as measured by the rate of prescription opioid overdose mortality, is associated with growth in the number of buprenorphine physicians. Because this observational design cannot establish causality, further research is needed to elucidate the factors influencing physicians’ decisions to begin prescribing buprenorphine.
Keywords: buprenorphine, physicians, treatment supply, prescription opioid overdose
1. INTRODUCTION
The United States is now in the second decade of a prescription opioid epidemic (Compton et al., 2015; Compton and Volkow, 2006) that has seen a rapid escalation of nonmedical use (Han et al., 2015) and prescription opioid use disorder rates that are second only to marijuana in the most recent National Survey on Drug Use and Health (Center for Behavioral Health Statistics and Quality, 2015). Opioid use disorder has well-documented negative consequences including premature mortality, family disruption, acquisition and transmission of HIV and hepatitis C (Mechanic, 2014; Paulozzi and Xi, 2008; Volkow et al., 2014). Moreover, in recent years, many of those abusing prescription opioids have transitioned to using heroin (Cerda et al., 2015; Jones, 2013), underscoring the potential negative outcomes associated with abusing prescription opioids. Perhaps the most alarming trend is that of prescription opioid-associated fatal overdoses. The current opioid abuse epidemic has given rise to significantly greater numbers of prescription-opioid associated fatal overdoses nationwide (Jones et al., 2013; Paulozzi et al., 2014; Rudd et al., 2016).
Concurrent with the dramatic rise in prescription opioid use disorder and subsequent fatal overdose rates has been the emergence and expansion of buprenorphine as a treatment option. Buprenorphine is an effective treatment (Fiellin et al., 2008; Fudula et al., 2003), although methadone may be more effective than buprenorphine in retaining individuals in treatment (Mattick et al., 2014). There has been a steady increase in buprenorphine’s diffusion, particularly in office-based practice (Altice et al., 2011; Dick et al., 2015; Stein et al., 2015b). Buprenorphine is primarily delivered in physicians’ offices, which is notable because of the historical segregation of substance use disorder (SUD) treatment to organizations outside of mainstream medicine (McLellan and Woodsworth, 2014; Roman et al., 2011).
The regulatory system enacted under the US Drug Addiction Treatment Act (DATA) of 2000 requires physicians who intend to prescribe Schedule III controlled substances to treat opioid dependence to submit a notification of intent to the Substance Abuse and Mental Health Services Administration (SAMSHA); currently, buprenorphine is the only medication that is included under this designation (Center for Substance Abuse Treatment, 2004). As of spring 2016, physicians initially can only treat up to 30 patients concurrently in their first year. In subsequent years, physicians can expand their treatment capacity up to 100 patients at any given time, but to do so, they must submit a second notification of intent. Information about whether physicians can treat up to 30 patients at any given time or up to 100 patients is maintained in the Controlled Substances Act (CSA) Active Registrants database.
This aspect of buprenorphine’s regulation allows for measurement of buprenorphine physician supply, which is a population-adjusted measure of the number of physicians in a given geographic area (Cooper, 2009). The current study defines total buprenorphine physician supply as the number of physicians who hold the buprenorphine waiver per 100,000 residents within a state, and we also measure the number of physicians who can treat up to 100 patients. Conceptually, growth in the total physician supply is largely driven by physicians initially seeking the buprenorphine waiver, and therefore, may reflect physicians who are responding to the scope of the opioid epidemic. Submitting a notification to treat up to 100 patients, because it can only occur after at least one year of treating patients, suggests that physicians are directly experiencing sufficient demand for treatment to warrant this larger capacity.
Five recent studies have examined buprenorphine physician supply, but none have measured the extent to which growth in supply is associated with the prescription opioid crisis within states. Prior studies have examined the relationships between state policies and the supply of buprenorphine physicians within counties (Stein et al., 2015a) as well as the rates of growth in buprenorphine physician supply from 2002 to 2011 (Dick et al., 2015). Another study of US counties found greater supplies in counties on the East and West coasts and differences between rural and urban counties (Rosenblatt et al., 2015). A cross-sectional analysis of states also reported significant regional variation as well as correlations between buprenorphine physician supply and the availability of other SUD treatment, the percentage of residents insured by Medicaid, and the rate of overdose mortality from heroin and other opioids (Knudsen, 2015).
The present study builds upon our prior work, which examined buprenorphine physician supply over a 24-month period and its associations with states’ implementation of the Affordable Care Act (Knudsen et al., 2015). We integrated information about states’ decisions regarding the expansion of Medicaid and the building of state-based health insurance exchanges (Blumenthal and Collins, 2014; Buttorff et al., 2015; Gluck, 2014). Compared to states that both expanded Medicaid and established a state-based health insurance exchange, growth in the total buprenorphine physician supply was significantly lower in states that had only adopted one of these elements of ACA and lower in states that adopted neither of these elements. These differences in growth were confined to 30-patient and total physician supply; there were not significant differences in the supply of the more experienced 100-patient physicians by ACA implementation.
This paper extends our work by considering two additional state characteristics while controlling for this ACA typology. The magnitude of the prescription opioid crisis within states has not been tested for its potential impact on the rates of growth in buprenorphine physicians. Prior work has identified that the rate of overdose mortality from heroin and prescription opioids combined is positively correlated with the average number of 100-patient physicians (Knudsen et al., 2015), but the association with prescription opioid mortality alone has not been examined.
Conceptually, the extent of a state’s prescription opioid crisis may represent an important element of the outer context, or environment, in which physicians’ decisions about pursuing the buprenorphine waiver are made. Major theories of innovation implementation suggest the outer context can affect decisions to adopt and implement a novel intervention (Aarons et al., 2011; Damschroder et al., 2009; Damschroder and Hagedorn, 2011; Fixsen et al., 2005). As noted by Rogers (2003) in his classic work, Diffusion of Innovations, innovations are more likely to spread when there is a perceived need for change. Media attention and public awareness regarding the prescription opioid crisis has increased over time (Barry et al., 2016; McGinty et al., 2016), which may increase the perceived need for solutions among physicians in states with greater rates of overdose mortality. These implementation frameworks offer one rationale for why the rates of growth in buprenorphine physicians may be greater in states with high rates of prescription opioid overdose mortality.
Region of the country has been examined in cross-sectional analyses of buprenorphine physician supply and controlled in growth models for its relationship with the intercept (i.e., states’ baseline levels), but region has not been tested for its impact on growth rates (Knudsen, 2015; Knudsen et al., 2015). Large mean differences have been documented between the Northeast and the South, Midwest, and West. From a public health perspective, it is important to consider whether the Northeast is also advantaged in its rate of growth in buprenorphine physicians because that would widen the gap between the Northeast and other regions over time.
It is hypothesized that states with a more pronounced prescription opioid problem, as measured by the rate of prescription opioid-related overdose mortality, have experienced greater growth in buprenorphine physician supply than states with a less pronounced prescription opioid problem. We also hypothesize that states outside the Northeast will have significantly lower rates of growth than Northeastern states. This study tests these hypotheses by examining data on buprenorphine physician supply from June, 2013 to January, 2016.
2. METHODS
2.1. Study design
Growth in the supply of buprenorphine physicians at the state-level was measured using an observational design that integrated data from several sources. The study team purchased a database to extract information about buprenorphine physicians and collated other state characteristics from publicly available data sources.
2.2. Outcome variables
Two outcomes at the state-level were measured monthly using information from the DEA’s CSA Active Registrants database: total buprenorphine physician supply and 100-patient physician supply. For total buprenorphine physician supply, we counted the number of civilian physicians per 100,000 state residents in all 50 states and the District of Columbia that had been designated with activity codes C1 and C4 (which indicate those physicians with approved notifications of intent). We used US Census data regarding state population as the denominator (United States Census Bureau, 2015b). A similar method was applied to measure the supply of physicians holding the 100-patient waivers.
2.3. Independent variables
The primary independent variable was a dichotomous indicator of state-level prescription opioid overdose mortality in 2013. State-level rates of prescription opioid overdose mortality were extracted from the Centers for Disease Control and Prevention’s WONDER Multiple Cause of Death database (2015) using a methodology similar to Bachhuber and colleagues (2014). This database is based on death certificates of US residents, which are coded by states or CDC’s National Center for Health Statistics and entered into the National Vital Statistics System (Centers for Disease Control and Prevention, 2016). Our search parameters included intentional and unintentional deaths (International Statistical Classification of Diseases, 10th revision [ICD-10], codes X40-X44, X60-X64, and Y10-Y14) where prescription opioids were coded (T40.2-T40.4). Our search parameters did not include deaths coded for heroin or opium (i.e., T40.0 and T40.1). We then used a median split to create two groups: high overdose states (those with opioid overdose mortality at or above 5.5 deaths per 100,000 residents in 2013; n=26) and low overdose states (defined as those with overdose mortality below 5.5 per 100,000 residents in 2013; n=25). The coding of states is presented in Figure 1. Generating an interaction term (month-by-group) allowed for testing whether these two groups had differential rates of growth in the two outcomes.
Figure 1. Map of US states by high and low prescription opioid overdose mortality rates.
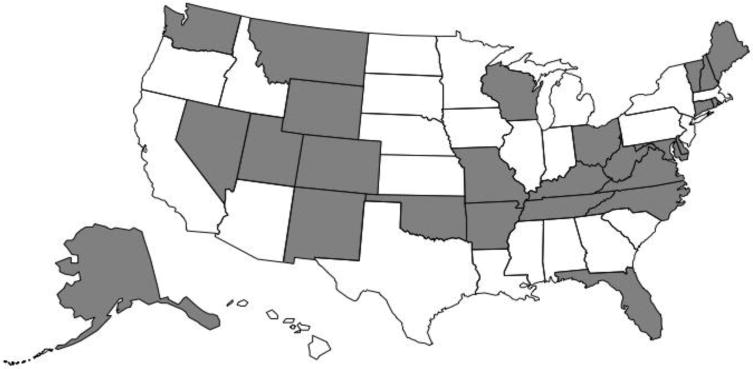
Notes. High overdose states (in gray) are those at or above 5.5 prescription opioid overdose deaths per 100,000 residents in 2013, based on data extracted from the CDC (2015) WONDER database. Low overdose states (in white) had fewer than 5.5 prescription opioid overdose deaths per 100,000 residents in 2013. The District of Columbia was in the group of low overdose states.
2.4. Other variables
To measure ACA implementation, we used the variable constructed for our prior study that combined information about states’ approaches to the Medicaid expansion and insurance exchanges in May, 2013 (Henry J. Kaiser Family Foundation, 2013a, b). ACA-supportive states, the reference group, were those that expanded Medicaid and established a state-based health insurance exchange (n=16, 31.4%). ACA-hybrid states implemented either the Medicaid expansion or a state-based exchange, but not both (n=11, 21.6%); this group primarily consisted of states that expanded Medicaid. States that declined the Medicaid expansion and did not set up a state-based exchange were coded as ACA-resistant states (n=24, 31.4%). An ACA typology-by-month interaction controlled for the associations of ACA implementation with the growth rates.
Region was defined by the US Census Bureau (2015a) categories of Northeast (reference; n=9, 17.7% of states), Midwest (n=12, 23.5%), South (n=18, 35.3%), and West (n=12, 23.5%). To test for regional differences in growth, region was interacted with month, and the Northeast served as the reference group.
Finally, we controlled three state characteristics that were significantly associated with the baseline measures of buprenorphine physicians supply in our previous work (Knudsen et al., 2015). Insurance coverage was measured by the percentage of the state population, averaged for 2012–2013, who were covered by Medicaid (Henry J. Kaiser Family Foundation, 2014); as we previously reported, the average state had 16.0% of its residents covered by Medicaid (SD=3.8). The number of OTPs offering methadone per 100,000 residents in mid-2013 was calculated using SAMHSA’s Treatment Locator (Substance Abuse and Mental Health Services Administration, 2013), and averaged 0.4 OTPs per 100,000 residents (SD=0.3). The number of substance use disorder (SUD) treatment facilities was also constructed using data from SAMHSA’s Treatment Locator, which, as we previously reported, averaged 4.7 programs per 100,000 residents (SD = 2.3).
2.5. Statistical Analysis
As a preliminary test of growth, paired t-tests compared the June 2013 and January 2016 values of buprenorphine physician supply. Mixed-effects regression was then used to estimate growth curve models for the two outcomes. This approach estimates within-state change over time, such that each state has its own growth curve. It tests for the associations of state-level characteristics on the intercept (i.e., baseline of June 2013) and interactions for group differences in growth (Rabe-Hesketh and Skronkal, 2012). We used the “mixed” command in Stata 13.1 (StataCorp, 2013) with an unstructured covariance matrix and maximum likelihood estimation. Each outcome was estimated through a series of four models. First, the model only included the time variable. Models 2 and 3 examined the associations between growth in buprenorphine physicians with prescription opioid overdose mortality rates and region, respectively. Finally, Model 4 included all study variables. After estimating Model 4, the commands “margins” and “marginsplot” were implemented to graph the growth rates by overdose mortality and region, while adjusting for the other variables in the final model (Mitchell, 2012).
3. RESULTS
At baseline in June, 2013, there were 22,572 buprenorphine physicians in the US, and the average state-level total physician supply was 7.7 buprenorphine physicians per 100,000 residents (SD = 5.0). By January 2016, the number had rise to 28,711 physicians, and the average total supply had increased to 9.9 (SD = 6.4), which was a statistically significant increase (t=−9.5, df=50, p<.001). Similarly, there was a significant increase in 100-patient physicians from 2.2 (SD = 1.5) to 3.4 (SD = 2.3) physicians per 100,000 residents (t=−9.1, df=50, p<.001). Nationally, the number of physicians holding the 100-patient waiver increased from 6,316 to 9,483 over the study period.
Four mixed-effects regression models of total buprenorphine physician supply are presented in Table 1. Model 1 only included a parameter for time. There was a significant positive coefficient for month, indicating significant growth in total buprenorphine physician supply. Model 2 added the dichotomous variable for high prescription opioid overdose states as well as its interaction with time. This dichotomous variable, which represented the difference between high overdose and low overdose states in June 2013, approached but did not achieve statistical significance (p=.055, two-tailed test). However, the interaction term was significant, indicating that states in the higher prescription opioid overdose mortality group experienced greater growth in total buprenorphine physicians than states in the lower overdose group. The coefficient for month in Model 2 was somewhat smaller than Model 1 because its meaning shifted with the inclusion of the interaction term; in Model 2, the coefficient for month represented the average rate of growth for states in the lower overdose group, a rate that still differed significantly from zero as indicated by its p-value.
Table 1.
Growth curve model estimates of total buprenorphine physicians
| Model 1 Unstandardized Coefficient (95% CI) |
Model 2 Unstandardized Coefficient (95% CI) |
Model 3 Unstandardized Coefficient (95% CI) |
Model 4 Unstandardized Coefficient (95% CI) |
|
|---|---|---|---|---|
| Month | .072*** (.057, .087) |
.052*** (.032, .072) |
.131*** (.102, .161) |
.131*** (.100, .162) |
| Prescription overdose mortality and region on the growth rate | ||||
| Month-by-high prescription opioid overdose state interaction | .040** (.012, .068) |
.033** (.010, .055) |
||
| Month-by-Midwestern state interaction | −.097*** (−.136, −.058) |
−.071*** (−.108, −.033) |
||
| Month-by-Southern state interaction | −.062** (−.098, −.026) |
−.049** (−.082, −.015) |
||
| Month-by-Western state interaction | −.061** (−.100, −.022) |
−.064*** (−.098, −.030) |
||
| Month-by-ACA-hybrid state interaction | −.031 (−.644, .002) |
|||
| Month-by-ACA-resistant state interaction | −.041** (−.069, −.013) |
|||
| Time-invariant characteristics on the intercept | ||||
| High prescription opioid overdose mortality (vs. low) | 2.513 (−.056, 5.082) |
1.655** (.406, 2.905) |
||
| Region | ||||
| Northeast | Reference | Reference | ||
| Midwest | −10.524*** (−13.440, −7.608) |
−5.349*** (−7.599, −3.099) |
||
| South | −8.188*** (−10.888, −5.488) |
−4.829*** (−6.787, −2.872) |
||
| West | −7.406*** (−10.322, −4.490) |
−4.222*** (−6.381, −2.064) |
||
| Typology of Affordable Care | ||||
| Act implementation | ||||
| ACA-supportive states | Reference | |||
| ACA-hybrid states | −1.039 (−2.813, .735) |
|||
| ACA-resistant states | −.984 (−2.598, .630) |
|||
| % Medicaid-insured residents | .356*** (.203, .509) |
|||
| Number of OTPs per 100,000 residents | 5.964*** (3.151, 8.777) |
|||
| Number of SUD treatment facilities per 100,000 residents | .288* (.045, .531) |
|||
| Intercept | 7.540 (6.210, 8.870) |
6.259 (4.424, 8.093) |
14.649 (12.444, 16.853) |
2.099 (−1.807, 6.004) |
|
Random-Effects Parameters | ||||
| State: Unstructured | ||||
| Variance(Month) | .003 (.002, .004) |
.003 (.002, .004) |
.002 (.001, .003) |
.002 (.001, .002) |
| Variance(Intercept) | 23.476 (15.923, 34.610) |
21.897 (14.852, 32.284) |
11.381 (7.719, 16.780) |
4.156 (2.778, 6.218) |
| Covariance(Month, Intercept) | .208 (.115, .300) |
.183 (.100, .265) |
.102 (.052, .152) |
.038 (.012, .064) |
| Variance(Residual) | .035 (.032, .037) |
.035 (.032, .037) |
.035 (.032, .037) |
.035 (.032, .037) |
| Log likelihood | 58.669 | 62.349 | 77.814 | 101.873 |
Notes. CI = confidence interval. The interpretation of the month coefficient and intercept varies based on the variables included in the model. In Model 1, the month coefficient represents the estimate for the average growth rate across all states, while the intercept represents the estimate for the average total buprenorphine physician supply at the start of the study. In subsequent models, the month coefficient represents the average growth rate for states in the lower prescription opioid overdose mortality group (Model 2), for states in the Northeast (Model 3), and for Northeastern states that are ACA-supportive and in the low prescription opioid overdose mortality group (Model 4). In Models 2 and 3, the intercept represents the estimate for the average buprenorphine physician supply at the start of the study for the lower prescription mortality group (Model 2) and for Northeastern states (Model 3); in Model 4, the intercept represents the average buprenorphine physician supply at the start of the study for Northeastern states that are ACA-supportive and in the low prescription opioid overdose mortality group if the other time-invariant state characteristics are set at zero. The Random Effects Parameters provide estimates of the variability between states in their intercepts and slopes (i.e., growth curves).
p<.05.
p<.01.
p<.001 (two-tailed tests).
The third model in Table 1 focused on region and its interaction with time. In Model 3, the coefficient for month represented the average rate of growth in the referent category, meaning the rate for Northeastern states. This positive rate of growth in Northeastern states significantly differed from zero (p<.001). The three other region-by-time interactions were statistically significant and negative in direction, indicating that compared to Northeastern states, states in the South, Midwest, and West experienced slower rates of growth in total buprenorphine physicians over the 32-month study period. In addition, these three regions had significantly lower numbers of buprenorphine physicians at the start of the study, as indicated by the significant coefficients for these variables on the intercept.
Model 4 presents the full model. The coefficient for month represented the average rate of growth when all of the interaction terms were equal to zero, which translates to the group of states that were in the Northeast and were ACA-supportive but had lower prescription opioid mortality. The month coefficient was positive, indicating an average rate of growth in such states that was significantly greater than zero.
The full model supported both of our study hypotheses. Consistent with Model 2 and our first hypothesis, states in the higher prescription opioid mortality group had a significantly greater rate of growth in total buprenorphine physicians, even after controlling for ACA implementation and region. These differences in growth, while adjusting for all other variables in the model, are presented in Figure 2a. Similarly, states in the South, Midwest, and West had significantly lower rates of growth than Northeastern states, which supported our second hypothesis (Figure 2b). In addition, ACA-resistant states had a significantly lower rate of growth when compared to ACA-supportive states in this final model. The difference between ACA-hybrid and ACA-supportive states did not achieve statistical significance (p=.065). Region was negatively correlated with the intercept, while the associations for Medicaid coverage, supply of OTPs, and supply of other SUD treatment facilities were positive, indicating that these three variables were associated with greater buprenorphine physician supply at the starting point of the growth curve (i.e., June, 2013).
Figure 2a.
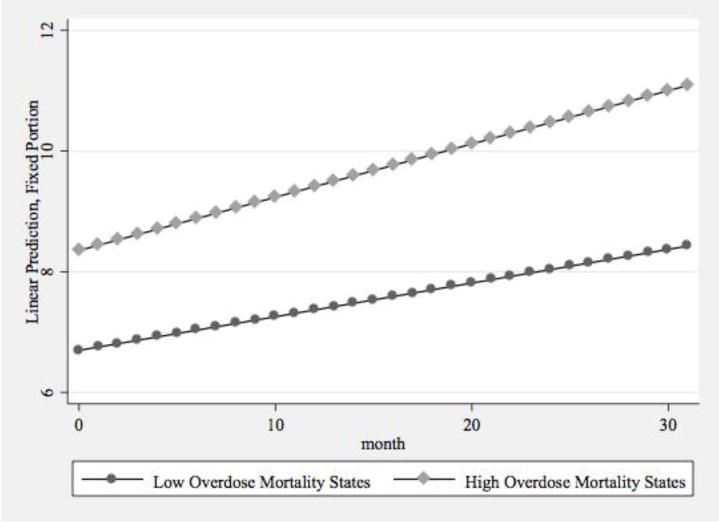
Predictive Margins of Total Buprenorphine Physician Supply by Prescription Opioid Overdose Mortality
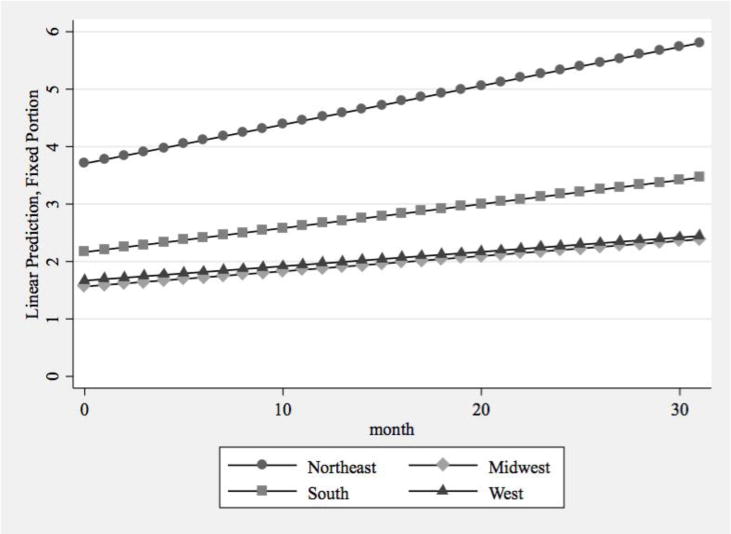
Figure 2b.
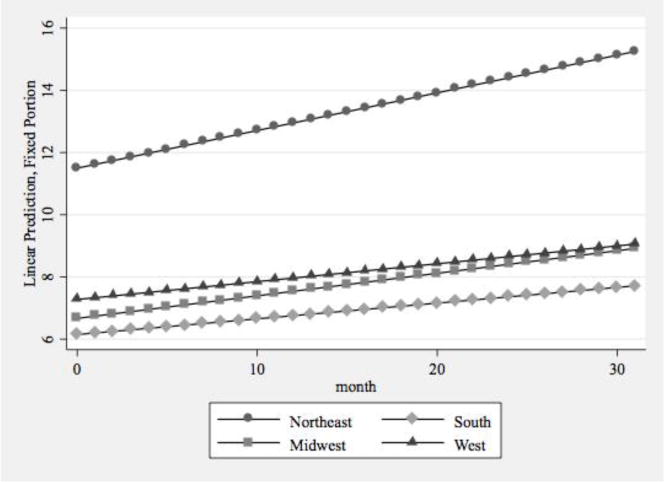
Predictive Margins of Total Buprenorphine Physician Supply by Region
Table 2 presents the results from applying the same model-building strategy to the supply of 100-patient physicians. As seen in Model 1, there was significant growth in the 100-patient physician supply over the 32-month study period. States with higher prescription opioid overdose death rates experienced significantly greater growth in the supply of 100-patient physicians, relative to states with lower overdose death rates, and also had a greater supply of 100-patient physicians at baseline (Model 2). Similar to total physician supply, states in the South, Midwest, and West had significantly lower rates of growth than Northeastern states, and these states outside the Northeast also had significantly fewer 100-patient physicians at the start of the observation period (Model 3).
Table 2.
Growth curve model estimates of physicians approved to treat up to 100 patients with buprenorphine
| Model 1 Unstandardized Coefficient (95% CI) |
Model 2 Unstandardized Coefficient (95% CI) |
Model 3 Unstandardized Coefficient (95% CI) |
Model 4 Unstandardized Coefficient (95% CI) |
|
|---|---|---|---|---|
| Month | .039*** (.031, .047) |
.026*** (.015, .037) |
.070*** (.054, .086) |
.061*** (.043, .078) |
| Prescription overdose mortality and region on the growth rate | ||||
| Month-by-high prescription opioid overdose state interaction | .025** (.010, .040) |
.022** (.009, .035) |
||
| Month-by-Midwestern state interaction | −.050*** (−.071, −.028) |
−.041*** (−.062, −.020) |
||
| Month-by-Southern state interaction | −.027** (−.047, −.008) |
−.026** (−.045, −.007) |
||
| Month-by-Western state interaction | −.041*** (−.062, −.020) |
−.043*** (−.062, −.023) |
||
| Month-by-ACA-hybrid state interaction | −.001 (−.020, .017) |
|||
| Month-by-ACA-resistant state interaction | −.008 (−.024, .008) |
|||
| Time-invariant characteristics on the intercept | ||||
| High prescription opioid overdose mortality (vs. low) | .982* (.225, 1.739) |
.747** (.311, 1.182) |
||
| Region | ||||
| Northeast | Reference | Reference | ||
| Midwest | −3.194*** (−4.064, −2.325) |
−2.141*** (−2.914, −1.368) |
||
| South | −2.192*** (−2.996, −1.387) |
−1.542*** (−2.217, −.866) |
||
| West | −2.655*** (−3.524, −1.786) |
−2.039*** (−2.776, −1.301) |
||
| Typology of Affordable Care | ||||
| Act implementation | ||||
| ACA-supportive states | Reference | |||
| ACA-hybrid states | .180 (−.442, .802) |
|||
| ACA-resistant states | −.106 (−.664, .452) |
|||
| % Medicaid-insured residents | .076** (.028, .125) |
|||
| Number of OTPs per 100,000 residents | 1.200** (.036, 2.093) |
|||
| Number of SUD treatment facilities per 100,000 residents | .083* (.006, .160) |
|||
| Intercept | 2.178 (1.776, 2.580) |
1.677 (1.137, 2.218) |
4.328 (3.671, 4.985) |
1.283 (.019, 2.548) |
|
Random-Effects Parameters | ||||
| State: Unstructured | ||||
| Variance(Month) | .0009 (.0006, .0013) |
.0007 (.0005, .0011) |
.0006 (.0004, .0009) |
.0005 (.0003, .0007) |
| Variance(Intercept) | 2.143 (1.454, 3.160) |
1.902 (1.290, 2.805) |
1.010 (.685, 1.490) |
.517 (.345, .775) |
| Covariance(Month, Intercept) | .035 (.020, .051) |
.029 (.016, .042) |
.018 (.009, .026) |
.010 (.004, .015) |
| Variance(Residual) | .009 (.008, 009) |
.009 (.008, .009) |
.009 (.008, .009) |
.009 (.008, .009) |
| Log likelihood | 1220.816 | 1225.627 | 1241.030 | 1256.989 |
Notes. CI = confidence interval. The interpretation of the month coefficient and intercept varies based on the variables included in the model. In Model 1, the month coefficient represents the estimate for the average growth rate across all states, while the intercept represents the estimate for the average 100-patient buprenorphine physician supply at the start of the study. In subsequent models, the month coefficient represents the average growth rate for states in the lower prescription opioid overdose mortality group (Model 2), for states in the Northeast (Model 3), and for Northeastern states that are ACA-supportive and in the low prescription opioid overdose mortality group (Model 4). In Models 2 and 3, the intercept represents the estimate for the average buprenorphine physician supply at the start of the study for the lower prescription mortality group (Model 2) and for Northeastern states (Model 3); in Model 4, the intercept represents the average buprenorphine physician supply at the start of the study for Northeastern states that are ACA-supportive and in the low prescription opioid overdose mortality group if the other time-invariant state characteristics are set at zero. The Random Effects Parameters provide estimates of the variability between states in their intercepts and slopes (i.e., growth curves).
p<.05.
p<.01.
p<.001 (two-tailed tests).
In Model 4, which included all study variables, the differences identified in Models 2 and 3 for 100-patient buprenorphine physician supply remained statistically significant, providing further support for our two hypotheses. States with higher rates of prescription opioid mortality experienced significantly greater growth in 100-patient physicians, even after controlling for the other variables (Figure 3a). The regional differences in growth rates remained statistically significant (Figure 3b). The ACA implementation typology was not associated with growth in the supply of physicians approved to treat 100 patients. The associations between the remaining state characteristics and the intercept for the 100-patient buprenorphine physician supply were consistent with the results from the model of total physician supply.
Figure 3a.
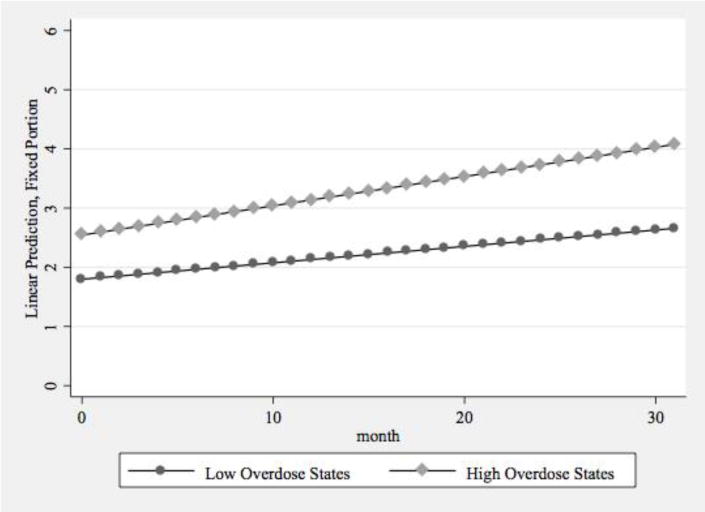
Predictive Margins of 100-Patient Buprenorphine Physician Supply by Prescription Opioid Overdose Mortality
Figure 3b.
Predictive Margins of 100-Patient Buprenorphine Physician Supply by Region
4. DISCUSSION
This study extends prior research on the supply of physicians able to prescribe buprenorphine by considering whether growth at the state-level was associated with the magnitude of the states’ prescription opioid overdose rates and region. Over a 32-month observation period, states with higher rates of prescription opioid overdose mortality (i.e., those with = 5.5 deaths per 100,000 residents) experienced greater growth in total buprenorphine physician supply and 100-patient physician supply than states with lower rates of prescription opioid overdose mortality. Furthermore, states in the South, Midwest, and West had significantly lower rates of growth than states in the Northeast.
The greater growth of buprenorphine physicians in states with higher rates of prescription opioid-related mortality could suggest that physicians are responding to the magnitude of the prescription opioid crisis. In a sense, overdose deaths represent the public face of the prescription opioid crisis. Previous research has documented greater media coverage over time as rates of opioid-related mortality have increased (Dasgupta et al., 2009; McGinty et al., 2016). In such an environment, physicians may perceive that there will be sufficient patients to warrant obtaining a buprenorphine waiver. However, the current study design could not directly test this aspect of physician behavior. Although previous large-scale surveys of buprenorphine physicians have documented some of the professional characteristics of buprenorphine prescribers (Arfken et al., 2010; Kissin et al., 2006; Netherland et al., 2009), there are scant data on the motivations of physicians for submitting their notification of intent to prescribe. Future studies should seek to expand our understanding of why physicians, particularly those in non-addiction specialties, adopt buprenorphine.
Regional differences, coupled with substantial differences at baseline, point to disparities faced by residents in the South, Midwest and West. To consider whether these differences reflect states’ variability in treatment need, we compared the rates of prescription opioid overdose mortality by these four US Census regions and found no significant differences. We also compared state-specific estimates of OUD in 2012, as reported by Jones et al. (2015), by these four regions. Although Midwestern states had a lower rate of OUD than Northeastern states, other pairwise regional comparisons were not significant (analyses available by request). Regional differences in buprenorphine physician supply do not appear to reflect major regional differences in the prevalence of OUD or the prescription opioid overdose crisis. Future research should continue to explore the mechanisms that are driving these regional differences. It is unknown whether regions vary in the amount of public funding available for OUD treatment, cultural and political norms about the causes and treatment of OUD, and the density of medical training programs that include SUD treatment in the curriculum. Testing whether these mechanisms account for some of the regional differences in buprenorphine physician supply is an important direction for future research.
These regional differences do suggest that efforts to support the diffusion of buprenorphine are still needed, particularly in states outside the Northeast. The Physician Clinical Support System-Buprenorphine (PCSS-B), now the Physician Clinical Support System for Medication-Assisted Treatment (http://pcssmat.org), has been one important mechanism for providing support to physicians (Egan et al., 2010). Recent work to expand buprenorphine in Massachusetts through technical assistance and the employment of nurse care managers in community health centers has shown promise (LaBelle et al., 2016) and may be beneficial in other states. Research on implementation strategies to increase the likelihood that physicians begin prescribing buprenorphine to opioid-dependent patients is still needed throughout the US (Ducharme et al., 2016; Molfenter et al., 2015; Ober et al., 2015), but our findings suggest the need for strategies to promote buprenorphine adoption is particularly acute outside the Northeast.
Continued growth in the supply of 100-patient physicians is significant because such physicians are particularly important for increasing access to treatment. Growth in 100-patient physicians has been a critical driver in explaining the increases in the amount of buprenorphine prescribed within US states (Stein et al., 2015b). However, it is important to acknowledge that even with significant growth in the number of buprenorphine physicians in the US, there remains a gap between the capacity of the buprenorphine treatment system and the number of Americans in need of OUD treatment (Jones et al., 2015). In 2014, NSDUH data indicated that 1.9 million Americans had pain reliever use disorder and 500,000 had heroin use disorder (Center for Behavioral Health Statistics and Quality, 2015). Our data from January, 2016 indicated that 19,228 physicians could treat up to 30 patients and 9,483 were approved to treat up to 100 patients, yielding a treatment capacity of approximately 1.5 million patients. Clearly, the supply of buprenorphine physicians is not increasing at a pace fast enough to fully address the size of the potential patient population in the US.
A recently released final rule, to be enacted in August, 2016, indicates that a new tier of patient limits will be added to the US’s regulatory system for buprenorphine treatment (Department of Health and Human Services, 2016). Physicians who have been approved to treat 100 patients for at least a year will be able to submit a third notification of intent to SAMHSA, which if approved, will allow them to treat up to 275 concurrent patients. To be approved for this higher limit, physicians are required to either meet standards of additional credentialing (e.g., board certification in an addiction specialty or certification from the American Society of Addiction Medicine, American Osteopathic Academy of Addiction Medicine, or the American Board of Addiction Medicine) or to provide buprenorphine in a qualified practice setting. Such settings must provide coverage for medical emergencies when practices are closed, provide access to case management (directly or through referral), use health information technology, be registered in the prescription drug monitoring program in their state, and accept third-party payments. Physicians must re-apply every three years to maintain their ability to treat up to 275 patients.
In describing the likely impact of this policy change, DHHS (2016) included projections that this policy change would result in approximately 40,000 additional patients receiving treatment in the first year and that about 2,000 physicians would likely apply for the 275-patient limit over a five-year period. Given the number of Americans in need of treatment as indicated by Jones et al. (2015), this increased capacity, while important, will still not fully address the treatment gap. Future research is needed to monitor the observed impacts of this policy change as well as the utility of other strategies for increasing the nation’s capacity for delivering medication-assisted treatment.
4.1 Limitations
This study has a number of limitations that warrant acknowledgement. First, this research relies upon an observational methodology that cannot firmly establish causality. Other unmeasured state characteristics may be associated with the two outcomes. Unmeasured efforts by key stakeholders, such as SAMHSA, the American Society of Addiction Medicine (ASAM), the American Academy of Addiction Psychiatry (AAAP), and others may have prompted some physicians to obtain the waiver, and such efforts cannot be controlled in the present study. Furthermore, state-level data cannot explain the motivations of physicians who have sought the buprenorphine waiver.
There are notable challenges when conducting analyses with secondary data. For example, there are not monthly state-level data available on prescription opioid overdose mortality, so this variable cannot be measured with the same timing as our measure of buprenorphine physician supply. Although the measures of prescription opioid overdose mortality from the CDC WONDER database draw from the National Vital Statistics System, which is the most comprehensive source of US mortality data, there are known limitations to these data. As noted by Rudd et al. (2016), state-level data on drug overdose mortality is subject to limitations, such as variability in the toxicological testing performed at autopsy and missing information about drug types on death certificates. In addition, we are unable to access data regarding physician supply before June, 2013; given that the prescription opioid epidemic began considerably earlier, this is another limitation of our design.
Also, our findings are specific to buprenorphine, which is regulated very differently in the US than the methadone dispensing system and the other SUD treatment medications (e.g., naltrexone) that can be prescribed in physician offices. This unique regulatory context, coupled with the distinct features of the US health care system, means that our findings are unlikely to generalize to other countries. In some countries, buprenorphine can be prescribed by any physician (Auriacombe et al., 2004; Fatseas and Auriacombe, 2007; Strang et al., 2007) or by pharmacists (Nielsen et al., 2007), which differs substantially from the US’s approach to this evidence-based treatment.
Our measure of buprenorphine physician supply also has substantial limitations in measuring the availability of buprenorphine treatment. Prior research has shown that many physicians hold the waiver but do not actually prescribe this medication to patients (Arfken et al., 2010), and this has been our experience in recruiting a nationally representative sample of prescribers who have at least one patient receiving buprenorphine for OUD.
4.2. Conclusions
The prescription opioid crisis in the United States is entrenched and, thus far, has shown little evidence of abating. Greater access to pharmacotherapy, such as buprenorphine, is greatly needed. The current study found that the supply of buprenorphine physicians has continued to grow, and that the rate of growth has been greater in states that have experienced higher rates of prescription opioid mortality. However, there are also substantial and persistent differences in growth between the Northeast and other regions of the country. Continued growth in the supply of buprenorphine physicians is critically important as part of a larger national strategy to address the prescription opioid epidemic.
Highlights.
Physicians may adopt buprenorphine in response to rising opioid mortality.
State-level prescription opioid mortality and buprenorphine physicians were studied.
States with greater overdose mortality had greater growth in buprenorphine physicians.
States in the West, Midwest, and South had slower growth than Northeastern states.
Acknowledgments
M. Lofwall has consulted for Orexo, received contract research funding from Braeburn Pharmaceuticals, and received honoraria from PCM Scientific, who receives unrestricted educational grant funds from Reckitt Benckiser (which manufactures the buprenorphine product, Suboxone®), for developing and giving educational talks on opioid dependence. Dr. Havens has received honoraria from Pinney Associates for serving on an external advisory board examining abuse and diversion of generic buprenorphine. S. Walsh has received research support for a project sponsored by Braeburn Pharmaceuticals, consulting fees from Camurus and Braeburn Pharmaceuticals, and honoraria from PCM Scientific through an arms-length unrestricted educational grant from Reckitt Benckiser as a speaker and organizer of conferences.
Role of Funding Source
The National Institute on Drug Abuse, an institute within the National Institutes of Health (NIH), funded this research (NIDA Grant R33DA035641). NIDA had no further role in study design; in the collection, analysis or interpretation of data; the writing of this manuscript; or the decision to submit it for publication. The authors are solely responsible for this content, and this manuscript does not represent the official views of the NIH or NIDA.
Footnotes
Publisher's Disclaimer: This is a PDF file of an unedited manuscript that has been accepted for publication. As a service to our customers we are providing this early version of the manuscript. The manuscript will undergo copyediting, typesetting, and review of the resulting proof before it is published in its final citable form. Please note that during the production process errors may be discovered which could affect the content, and all legal disclaimers that apply to the journal pertain.
Conflict of Interest
H. Knudsen and J. Studts have no conflicts of interest.
Contributors
All authors are responsible for this reported research. H. Knudsen designed the study, built the dataset, estimated the statistical models, and drafted the initial manuscript. M. Lofwall, S. Walsh, and J. Studts helped draft the manuscript and interpret the findings. J. Havens provided consultation on the statistical analyses and helped draft the manuscript. All authors have reviewed the manuscript, revised its content, and have approved the final manuscript as submitted.
References
- Aarons GA, Hurlburt M, Horwitz SM. Advancing a conceptual model of evidence-based practice implementation in public service sectors. Adm Policy Ment Health. 2011;38:4–23. doi: 10.1007/s10488-010-0327-7. [DOI] [PMC free article] [PubMed] [Google Scholar]
- Altice FL, Bruce RD, Lucas GM, Lum PJ, Korthuis PT, Flanigan TP, Cunningham CO, Sullivan LE, Vergara-Rodriguez P, Fiellin DA, Cajina A, Botsko M, Nandi V, Gourevitch MN, Finkelstein R, BHIVES Collaborative HIV treatment outcomes among HIV-infected, opioid-dependent patients receiving buprenorphine/naloxone treatment within HIV clinical care settings: results from a multisite study. J Acquir Immune Defic Syndr. 2011;56:S22–S32. doi: 10.1097/QAI.0b013e318209751e. [DOI] [PMC free article] [PubMed] [Google Scholar]
- Arfken CL, Johanson CE, di Menza S, Schuster CR. Expanding treatment capacity for opioid dependence with office-based treatment with buprenorphine: national surveys of physicians. J Subst Abuse Treat. 2010;39:96–104. doi: 10.1016/j.jsat.2010.05.004. [DOI] [PubMed] [Google Scholar]
- Auriacombe M, Fatseas M, Dubernet J, Daulouede P, Tignol J. French field experience with buprenorphine. Am J Addict. 2004;13:S17–S28. doi: 10.1080/10550490490440780. [DOI] [PubMed] [Google Scholar]
- Bachhuber MA, Saloner B, Cunningham C, Barry CL. Medical cannabis laws and opioid analgesic overdose mortality in the United States, 1999–2010. JAMA Intern Med. 2014;174:1668–1673. doi: 10.1001/jamainternmed.2014.4005. [DOI] [PMC free article] [PubMed] [Google Scholar]
- Barry CL, Kennedy-Hendricks A, Gollust SE, Niederdeppe J, Bachhuber MA, Webster DW, McGinty EE. Understanding Americans’ views on opioid pain reliever abuse. Addiction. 2016;111:85–93. doi: 10.1111/add.13077. [DOI] [PMC free article] [PubMed] [Google Scholar]
- Blumenthal D, Collins SR. Health care coverage under the Affordable Care Act–a progress report. N Engl J Med. 2014;371:275–281. doi: 10.1056/NEJMhpr1405667. [DOI] [PubMed] [Google Scholar]
- Buttorff C, Andersen MS, Riggs KR, Alexander GC. Comparing employer-sponsored and federal exchange plans: wide variations in cost sharing for prescription drugs. Health Aff. 2015;34:467–476. doi: 10.1377/hlthaff.2014.0615. [DOI] [PubMed] [Google Scholar]
- Center for Behavioral Health Statistics and Quality. Behavioral health trends in the United States: Results from the 2014 National Survey on Drug Use and Health. Substance Abuse and Mental Health Services Administration; Rockville, MD: 2015. (HHS Publication No. SMA 15 4927). [Google Scholar]
- Center for Substance Abuse Treatment. Clinical Guidelines for the Use of Buprenorphine in the Treatment of Opioid Addiction (Treatment Improvement Protocol #40) Substance Abuse and Mental Health Services Administration; Rockville, MD: 2004. [PubMed] [Google Scholar]
- Centers for Disease Control and Prevention. Multiple cause of death 1999–2014. 2016 https://web.archive.org/web/20160418041209/http://wonder.cdc.gov/wonder/help/mcd.html (accessed April 19 2016.)
- Centers for Disease Control and Prevention’s National Center for Health Statistics. Multiple cause of death 1999–2013 on CDC WONDER online database. 2015 http://wonder.cdc.gov/mcd-icd10.html (accessed January 29 2015)
- Cerda M, Santaella J, Marshall BD, Kim JH, Martins SS. Nonmedical prescription opioid use in childhood and early adolescence predicts transitions to heroin use in young adulthood: a national study. J Pediatr. 2015;167:605–612. e601–602. doi: 10.1016/j.jpeds.2015.04.071. [DOI] [PMC free article] [PubMed] [Google Scholar]
- Compton WM, Boyle M, Wargo E. Prescription opioid abuse: problems and responses. Prev Med. 2015;80:5–9. doi: 10.1016/j.ypmed.2015.04.003. [DOI] [PubMed] [Google Scholar]
- Compton WM, Volkow ND. Major increases in opioid analgesic abuse in the United States: concerns and strategies. Drug Alcohol Depend. 2006;81:103–107. doi: 10.1016/j.drugalcdep.2005.05.009. [DOI] [PubMed] [Google Scholar]
- Cooper RA. Regional variation and the affluence-poverty nexus. JAMA. 2009;302:1113–1114. doi: 10.1001/jama.2009.1222. [DOI] [PubMed] [Google Scholar]
- Damschroder LJ, Aron DC, Keith RE, Kirsh SR, Alexander JA, Lowery JC. Fostering implementation of health services research findings into practice: a consolidated framework for advancing implementation science. Implement Sci. 2009;4:50. doi: 10.1186/1748-5908-1184-1150. [DOI] [PMC free article] [PubMed] [Google Scholar]
- Damschroder LJ, Hagedorn HJ. A guiding framework and approach for implementation research in substance use disorders treatment. Psychol Addict Behav. 2011;25:194–205. doi: 10.1037/a0022284. [DOI] [PubMed] [Google Scholar]
- Dasgupta N, Mandl KD, Brownstein JS. Breaking the news or fueling the epidemic? Temporal association between news media report volume and opioid-related mortality. PLoS One. 2009;4:e7758. doi: 10.1371/journal.pone.0007758. doi: 7710.1371/journal.pone.0007758. [DOI] [PMC free article] [PubMed] [Google Scholar]
- Department of Health Human Services. 42 CFR Part 8, RIN 0930-AA22, Medication assisted treatment for opioid use disorders. Fed Regist. 2016;81:44712–44739. [Google Scholar]
- Dick AW, Pacula RL, Gordon AJ, Sorbero M, Burns RM, Leslie D, Stein BD. Growth in buprenorphine waivers for physicians increased potential access to opioid agonist treatment, 2002–11. Health Aff. 2015;34:1028–1034. doi: 10.1377/hlthaff.2014.1205. [DOI] [PMC free article] [PubMed] [Google Scholar]
- Ducharme LJ, Chandler RK, Harris AH. Implementing effective substance abuse treatments in general medical settings: mapping the research terrain. J Subst Abuse Treat. 2016;60:110–118. doi: 10.1016/j.jsat.2015.06.020. [DOI] [PMC free article] [PubMed] [Google Scholar]
- Egan JE, Casadonte P, Gartenmann T, Martin J, McCance-Katz EF, Netherland J, Renner JA, Weiss L, Saxon AJ, Fiellin DA. The Physician Clinical Support System-Buprenorphine (PCSS-B): a novel project to expand/improve buprenorphine treatment. J Gen Intern Med. 2010;25:936–941. doi: 10.1007/s11606-010-1377-y. [DOI] [PMC free article] [PubMed] [Google Scholar]
- Fatseas M, Auriacombe M. Why buprenorphine is so successful in treating opiate addiction in France. Curr Psychiatry Rep. 2007;9:358–364. doi: 10.1007/s11920-007-0046-2. [DOI] [PubMed] [Google Scholar]
- Fiellin DA, Moore BA, Sullivan LE, Becker WC, Pantalon MV, Chawarski MC, Barry DT, O’Connor PG, Schottenfeld RS. Long-term treatment with buprenorphine/naloxone in primary care: results at 2–5 years. Am J Addict. 2008;17:116–120. doi: 10.1080/10550490701860971. [DOI] [PubMed] [Google Scholar]
- Fixsen D, Naoom S, Blase K, Friedman R, Wallace F. Implementation Research: A Synthesis of the Literature University of South Florida. Louis de la Parte Florida Mental Health Institute; Tampa: 2005. [Google Scholar]
- Fudula PJ, Bridge TP, Herbert S, Williford WO, Chiang CN, Jones K, Collins J, Raisch D, Casadonte P, Goldsmith RJ, Ling W, Malkerneker U, McNicholas L, Renner J, Stine S, Tusel D. Office-based treatment of opiate addiction with a sublingual-tablet formulation of buprenorphine and naloxone. N Engl J Med. 2003;349:949–958. doi: 10.1056/NEJMoa022164. [DOI] [PubMed] [Google Scholar]
- Gluck AR. A legal victory for insurance exchanges. N Engl J Med. 2014;370:896–899. doi: 10.1056/NEJMp1400707. [DOI] [PubMed] [Google Scholar]
- Han B, Compton WM, Jones CM, Cai R. Nonmedical prescription opioid use and use disorders among adults aged 18 through 64 years in the United States, 2003–2013. JAMA. 2015;314:1468–1478. doi: 10.1001/jama.2015.11859. [DOI] [PubMed] [Google Scholar]
- Henry J, Kaiser Family Foundation State decisions for creating health insurance exchanges, as of May 28, 2013. 2013a https://web.archive.org/web/20130706084344/http://kff.org/health-reform/state-indicator/health-insurance-exchanges/ (accessed June 10 2013.)
- Henry J, Kaiser Family Foundation Status of state action on the Medicaid expansion decision, as of May 30, 2013. 2013b https://web.archive.org/web/20130603184217/http://kff.org/medicaid/state-indicator/state-activity-around-expanding-medicaid-under-the-affordable-care-act/ (accessed May 13 2014.)
- Henry J, Kaiser Family Foundation Health insurance coverage of the total population. 2014 https://web.archive.org/web/20140712184316/http://kff.org/other/state-indicator/total-population/ (accessed May 13 2014.)
- Jones CM. Heroin use and heroin use risk behaviors among nonmedical users of prescription opioid pain relievers - United States, 2002–2004 and 2008–2010. Drug Alcohol Depend. 2013;132:95–100. doi: 10.1016/j.drugalcdep.2013.01.007. [DOI] [PubMed] [Google Scholar]
- Jones CM, Campopiano M, Baldwin G, McCance-Katz E. National and state treatment need and capacity for opioid agonist medication-assisted treatment. Am J Public Health. 2015;105:e55–e63. doi: 10.2105/AJPH.2015.302664. [DOI] [PMC free article] [PubMed] [Google Scholar]
- Jones CM, Mack KA, Paulozzi LJ. Pharmaceutical overdose deaths, United States, 2010. JAMA. 2013;309:657–659. doi: 10.1001/jama.2013.272. [DOI] [PubMed] [Google Scholar]
- Kissin W, McLeod C, Sonnefeld J, Stanton A. Experiences of a national sample of qualified addiction specialists who have and have not prescribed buprenorphine for opioid dependence. J Addict Dis. 2006;25:91–103. doi: 10.1300/J069v25n04_09. [DOI] [PubMed] [Google Scholar]
- Knudsen HK. The supply of physicians waivered to prescribe buprenorphine for opioid use disorders in the United States: a state-level analysis. J Stud Alcohol Drugs. 2015;76:644–654. doi: 10.15288/jsad.2015.76.644. [DOI] [PMC free article] [PubMed] [Google Scholar]
- Knudsen HK, Lofwall MR, Havens JR, Walsh SL. States’ implementation of the Affordable Care Act and the supply of physicians waivered to prescribe buprenorphine for opioid dependence. Drug Alcohol Depend. 2015;157:36–43. doi: 10.1016/j.drugalcdep.2015.09.032. [DOI] [PMC free article] [PubMed] [Google Scholar]
- LaBelle CT, Han SC, Bergeron A, Samet JH. Office-based opioid treatment with buprenorphine (OBOT-B): statewide implementation of the Massachusetts collaborative care model in community health centers. J Subst Abuse Treat. 2016;60:6–13. doi: 10.1016/j.jsat.2015.06.010. [DOI] [PMC free article] [PubMed] [Google Scholar]
- Mattick RP, Breen C, Kimber J, Davoli M. Buprenorphine maintenance versus placebo or methadone maintenance for opioid dependence. Cochrane Database of System Rev. 2014;2 Art. No.: CD002207. [Google Scholar]
- McGinty EE, Kennedy-Hendricks A, Baller J, Niederdeppe J, Gollust S, Barry CL. Criminal activity or treatable health condition? News media framing of opioid analgesic abuse in the United States, 1998–2012. Psychiatr Serv. 2016;67:405–411. doi: 10.1176/appi.ps.201500065. [DOI] [PubMed] [Google Scholar]
- McLellan AT, Woodsworth AM. The Affordable Care Act and treatment for “substance use disorders:” implications of ending segregated behavioral healthcare. J Subst Abuse Treat. 2014;46:541–545. doi: 10.1016/j.jsat.2014.02.001. [DOI] [PubMed] [Google Scholar]
- Mechanic D. More people than ever before are receiving behavioral health care in the United States, but gaps and challenges remain. Health Aff. 2014;33:1416–1424. doi: 10.1377/hlthaff.2014.0504. [DOI] [PubMed] [Google Scholar]
- Mitchell MN. Interpreting and Visualizing Regression Models Using Stata. Stata Press; College Station, TX: 2012. [Google Scholar]
- Molfenter T, Sherbeck C, Zehner M, Starr S. Buprenorphine prescribing availability in a sample of Ohio specialty treatment organizations. J Addict Behav Ther Rehabil. 2015;4:1000140. doi: 10.4172/2324-9005.1000140. [DOI] [PMC free article] [PubMed] [Google Scholar]
- Netherland J, Botsko M, Egan JE, Saxon AJ, Cunningham CO, Finkelstein R, Gourevitch MN, Renner JA, Sohler N, Sullivan LE, Weiss L, Fiellin DA, the BHIVES Collaborative Factors affecting willingness to provide buprenorphine treatment. J Subst Abuse Treat. 2009;36:244–251. doi: 10.1016/j.jsat.2008.06.006. [DOI] [PMC free article] [PubMed] [Google Scholar]
- Nielsen S, Dietze P, Dunlop A, Muhleisen P, Lee N, Taylor D. Buprenorphine supply by community pharmacists in Victoria, Australia: perceptions, experiences and key issues identified. Drug Alcohol Rev. 2007;26:143–151. doi: 10.1080/09595230601146645. [DOI] [PubMed] [Google Scholar]
- Ober AJ, Watkins KE, Hunter SB, Lamp K, Lind M, Setodji CM. An organizational readiness intervention and randomized controlled trial to test strategies for implementing substance use disorder treatment into primary care: SUMMIT study protocol. Implement Sci. 2015;10:66. doi: 10.1186/s13012-13015-10256-13017. [DOI] [PMC free article] [PubMed] [Google Scholar]
- Paulozzi LJ, Mack KA, Hockenberry JM. Vital signs: variation among states in prescribing of opioid pain relievers and benzodiazapines–United States, 2012. MMWR. 2014;63:563–568. [PMC free article] [PubMed] [Google Scholar]
- Paulozzi LJ, Xi Y. Recent changes in drug poisoning mortality in the United States by urban-rural status and by drug type. Pharmacoepidemiol Drug Saf. 2008;17:997–1005. doi: 10.1002/pds.1626. [DOI] [PubMed] [Google Scholar]
- Rabe-Hesketh S, Skronkal A. Multilevel and Longitudinal Modeling Using Stata. 3rd. Vol. 1. Stata Press; College Station, TX: 2012. [Google Scholar]
- Rogers EM. Diffusion of Innovations. Free Press; New York: 2003. [Google Scholar]
- Roman PM, Abraham AJ, Knudsen HK. Using medication-assisted treatment for substance use disorders: evidence of barriers and facilitators of implementation. Addict Behav. 2011;36:584–589. doi: 10.1016/j.addbeh.2011.01.032. [DOI] [PMC free article] [PubMed] [Google Scholar]
- Rosenblatt RA, Andrilla CHA, Catlin M, Larson EH. Geographic and specialty distribution of US physicians trained to treat opioid use disorder. Ann Fam Med. 2015;13:23–26. doi: 10.1370/afm.1735. [DOI] [PMC free article] [PubMed] [Google Scholar]
- Rudd RA, Aleshire N, Zibbell JE, Gladden RM. Increases in drug and opioid overdose deaths - United States, 2000–2014. MMWR. 2016;64:1378–1382. doi: 10.15585/mmwr.mm6450a3. [DOI] [PubMed] [Google Scholar]
- StataCorp. Stata Multilevel Mixed-Effects Reference Manual: Release 13. Stata Press; College Station, TX: 2013. [Google Scholar]
- Stein BD, Gordon AJ, Dick AW, Burns RM, Pacula RL, Farmer CM, Leslie DL, Sorbero M. Supply of buprenorphine waivered physicians: the influence of state policies. J Subst Abuse Treat. 2015a;48:104–111. doi: 10.1016/j.jsat.2014.07.010. [DOI] [PMC free article] [PubMed] [Google Scholar]
- Stein BD, Pacula RL, Gordon AJ, Burns RM, Leslie DL, Sorbero M, Bauhoff S, Mandell T, Dick AW. Where is buprenorphine dispensed to treat opioid use disorders? The role of private offices, opiod treatment programs, and substance abuse treatment facilities in urban and rural counties. Milbank Q. 2015b;93:561–583. doi: 10.1111/1468-0009.12137. [DOI] [PMC free article] [PubMed] [Google Scholar]
- Strang J, Manning V, Mayet S, Ridge G, Best D, Sheridan J. Does prescribing for opiate addiction change after national guidelines? Methadone and buprenorphine prescribing to opiate addicts by general practitioners and hospital doctors in England, 1995–2005. Addiction. 2007;102:761–770. doi: 10.1111/j.1360-0443.2007.01762.x. [DOI] [PubMed] [Google Scholar]
- Substance Abuse and Mental Health Services Administration. Substance abuse treatment facility locator. 2013 http://findtreatment.samhsa.gov/TreatmentLocator/faces/geographicSearch.jspx (accessed June 12 2013.)
- United States Census Bureau. Census regions and divisions of the United States. 2015a https://web.archive.org/web/20150226213756/http://www.census.gov/geo/maps-data/maps/pdfs/reference/us_regdiv.pdf (accessed February 26 2015.)
- United States Census Bureau. State totals: Vintage 2014. 2015b https://web.archive.org/web/20150627072143/http://www.census.gov/popest/data/state/totals/2014/index.html (accessed August 12 2015.)
- Volkow ND, Frieden TR, Hyde PS, Cha SS. Medication-assisted therapies–tackling the opioid-overdose epidemic. N Engl J Med. 2014;370:2063–2066. doi: 10.1056/NEJMp1402780. [DOI] [PubMed] [Google Scholar]