

Abstract
Overactive bladder is often characterized by biomechanical changes in the bladder wall, but there is no established method to measure these changes in vivo. The goal of this study was to develop a novel method to determine detrusor wall biomechanical parameters during urodynamics through the incorporation of transabdominal ultrasound imaging. Individuals with overactive bladder (OAB) underwent ultrasound imaging during filling. The fill rate was 10% of the cystometric capacity per minute as determined by an initial fill. Transabdominal ultrasound images were captured in the midsagittal and transverse planes at 1 min intervals. Using image data and Pves, detrusor wall tension, stress, and compliance were calculated. From each cross−sectional image, luminal and wall areas along with inner perimeters were measured. In the sagittal and transverse planes, wall tension was calculated as Pves*luminal area, wall stress as tension/wall area, and strain as the change in perimeter normalized to the perimeter at 10% capacity. Elastic modulus was calculated as stress/strain in the medial-lateral and cranial-caudal directions. Patient-reported fullness sensation was continuously recorded. Data from five individuals with OAB showed that detrusor wall tension, volume, and strain had the highest correlations to continuous bladder sensation of all quantities measured. This study demonstrates how detrusor wall tension, stress, strain, and elastic modulus can be quantified by adding ultrasound imaging to standard urodynamics. This technique may be useful in diagnosing and better understanding the biomechanics involved in OAB and other bladder disorders.
Keywords: 2D transabdominal ultrasound, urinary urgency, bladder wall geometry, detrusor overactivity, detrusor wall biomechanics
Introduction
Overactive bladder (OAB) is a chronic filling-phase condition that adversely affects an estimated 17% of men and 30% of women (Coyne et al., 2013), but there is limited understanding of how bladder wall biomechanics influences OAB. Multi-channel urodynamics is considered the gold standard for evaluating all forms of voiding dysfunction, including OAB. However, pressure generally increases little during bladder filling (Fig. 1) (Frenkl et al., 2011) and does not reflect detrusor wall tension nor predict urgency. Because increased detrusor wall tension is likely a key factor in OAB pathophysiology in some patients (Drake et al., 2005), true filling phase physiology cannot be evaluated during standard clinical urodynamics and improved diagnostics are necessary.
Figure 1.
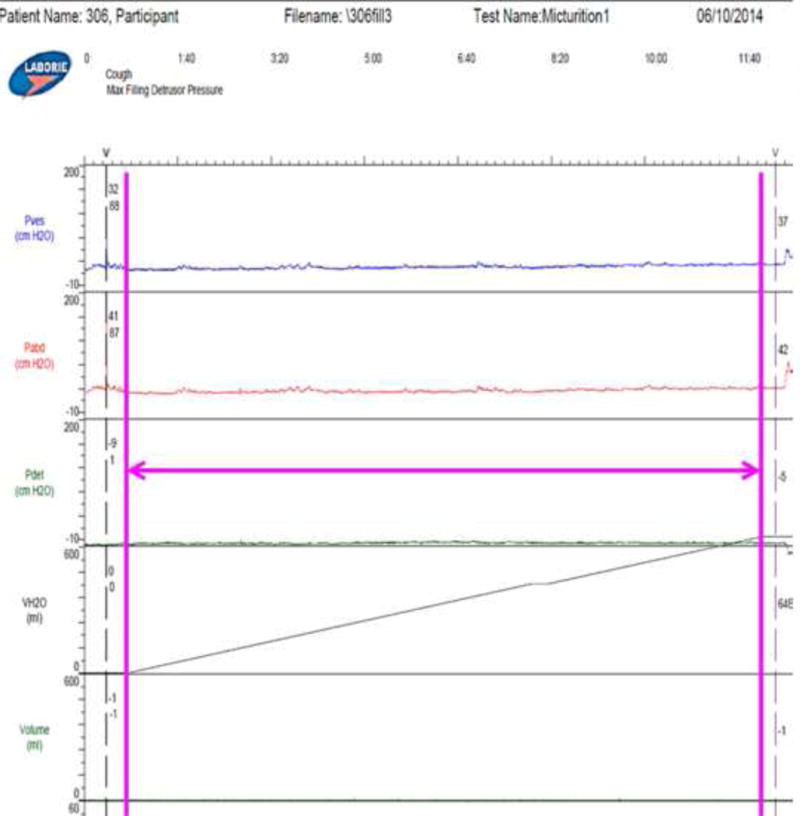
Output of the Laborie urodynamic system during the fill for the representative participant used as an example throughout this paper showing Pves (intravesical pressure), Pabd (intraabdominal pressure), Pdet (Pves-Pabd), and VH2O (volume of water infused). The magenta arrow shows duration of filling which is the data analyzed in this study.
Tension-sensitive afferent nerves in the bladder wall convey fullness sensation to the brain (Morrison, 1999), while bladder compliance affects the tension sensor load during filling (De Wachter et al., 2012). Bladder compliance has been shown to depend on shape (Damaser and Lehman, 1995). Bladder tension and stress have been estimated in animals by assuming a spherical shape (Le Feber et al., 2004; Watanabe et al., 1981), but bladder shape in humans can be highly variable (Bih et al., 1998; Lotz et al., 2004). For any volume of fluid, the shape with the smallest surface area is a sphere, so for a bladder that fills with a somewhat spherical shape when unconstrained, conditions making the bladder less spherical increase surface area and strain on the tension sensor. Laplace’s law states that in thin-walled vessels, such as the bladder, wall tension is proportional to the product of pressure and radius, and therefore, an increase in radius alone, with little or no change in pressure is sufficient to increase wall tension significantly (Watanabe et al., 1981).
The International Continence Society (ICS) defines compliance as the ratio of total volume change to pressure change (Abrams et al., 2002), but this can vary greatly depending on which initial and final points are used for volumes and pressures (Smith et al., 2012). This study demonstrates a method to use transabdominal ultrasound to gather bladder geometric information during urodynamics. This information along with pressure was used to compute novel urodynamic metrics of bladder filling mechanics including wall tension, stress, strain, and elastic modulus. These data are correlated with continuous patient-reported real-time sensation recorded throughout filling using a novel sensation meter (Nagle et al., 2016). These novel metrics will facilitate important new insights into the pathophysiology of bladder disorders. In particular, quantifying tension may be important in sub-characterizing a new form of bladder-wall-tension-mediated OAB. Additionally, the imaging techniques could be used to develop non-invasive means of characterizing OAB.
Materials and Methods
Theory
Extending work by (Watanabe et al., 1981), the bladder was modeled as a container with a thin, elastic, homogeneous wall which was theoretically cut into two sections in the transverse (medial-lateral direction) and sagittal (cranial-caudal direction) planes (Fig. 2a). The force (F) perpendicular to the cut acting to separate these halves is
| Eqn. 1 |
where Pves is vesical pressure and Alumen is the luminal area in the plane of the cut (Fig. 2b). This force is equal to the opposing wall tension (Tw) at the cut (Fig. 2b). The bladder wall stress (σw) is
| Eqn. 2 |
where Aw is the wall area (Fig 2b). The areas of the transverse image (Fig. 3a) were used to calculate cranial-caudal tension (TCC) and stress (σSS), and the areas of the sagittal image (Fig. 3b) were used to calculate medial-lateral tension (TML) and stress (σML).
Figure 2.
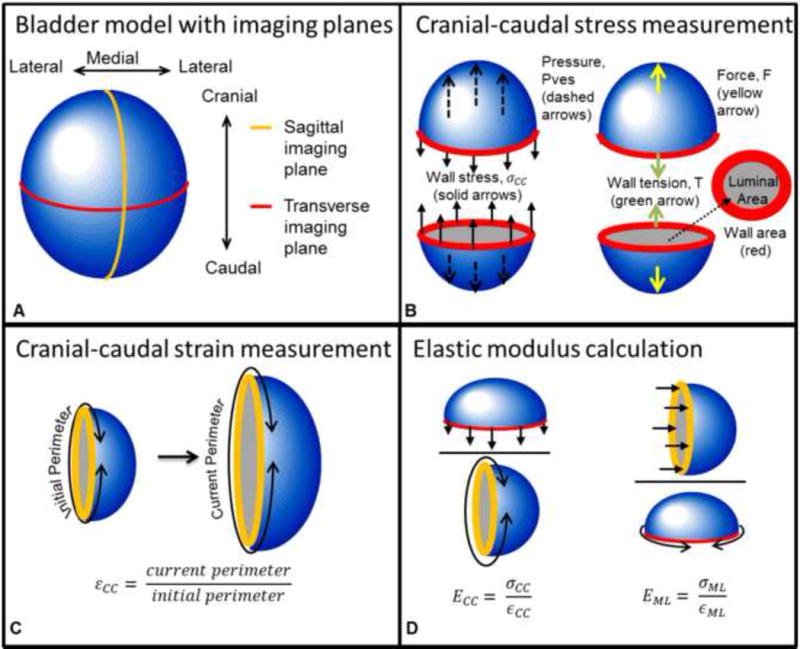
Bladder model used to demonstrate calculation of tension-based wall compliance. A) The bladder with transverse and sagittal cross-sectional planes and anatomical directions. B) Pressure (Pves, blue line from Fig. 1) in the cranial-caudal direction (dashed arrows) acts on the luminal area (gray) in the transverse plane and is opposed by the wall stress (solid arrows) acting on the wall cross-sectional area (red). Pves results in force, F, which is opposed by wall tension, T. C) Strain was calculated as the ratio of the current perimeter divided by the initial perimeter. D) Elastic modulus was calculated as the current stress divided by the current strain in each direction.
Figure 3.
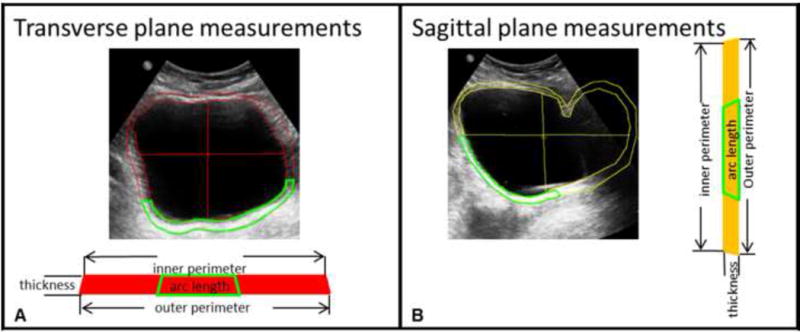
Ultrasound images in the transverse plane used to calculate cranial-caudal stress and medial-lateral strain (A) and sagittal plane analogous used to calculate medial-lateral strain and cranial-caudal stress (B) showing Digimizer tracings of the luminal (inner) area, bladder wall (outside) area, height, and width. The green segments represent the location in which the bladder wall is visible in each ultrasound image. The wall area was calculated as the area inside the green segment times the ratio of the inner perimeter of the bladder to the arc length of the segment.
The local wall strain for each plane was assumed to be approximated by the global perimeter strain and was calculated as the ratio of the perimeter to the perimeter at 10% capacity (Fig. 2c). The sagittal image perimeter (Fig. 3b) was used to calculate strain in the cranial-caudal direction (εCC) and the transverse image perimeter (Fig. 3a) was used to calculate strain in the medial-lateral direction (εML).
The bladder wall’s elastic modulus Ew was computed at each volume as
| Eqn. 3 |
where σw is the wall stress in one direction (cranial-caudal or medial-lateral) and εw is the strain in the wall in that direction (Fig. 2d).
Experimental Protocol
To demonstrate how the theoretical methods can be applied to clinical data, bladder wall biomechanical properties were calculated using ultrasound images and urodynamic data obtained from individuals with OAB who were recruited into an IRB-approved comparative-fill urodynamic protocol (Colhoun et al., 2016b). After giving informed consent, participants underwent a series of fillings with a Laborie Aquarius TT system at an infusion rate of 10% estimated cystometric capacity (based on an initial clinical urodynamic fill) per minute. A certified ultrasound technologist held a Philips Epiq-7 system 1–5 MHz transabdominal probe against the abdomen throughout filling and obtained two-dimensional (2D) ultrasound images of the bladder (Fig. 3) in the sagittal and transverse directions every minute. Detrusor overactivity (DO) was diagnosed by a urologist based on the initial fill. Throughout urodynamics, participants used a handheld sensation meter (Nagle et al., 2016) to track their perceptions of bladder filling in real-time on a 0–100% scale (Fig. 4, green). Infusion was stopped when the participant reached 100% on the sensation meter.
Figure 4.
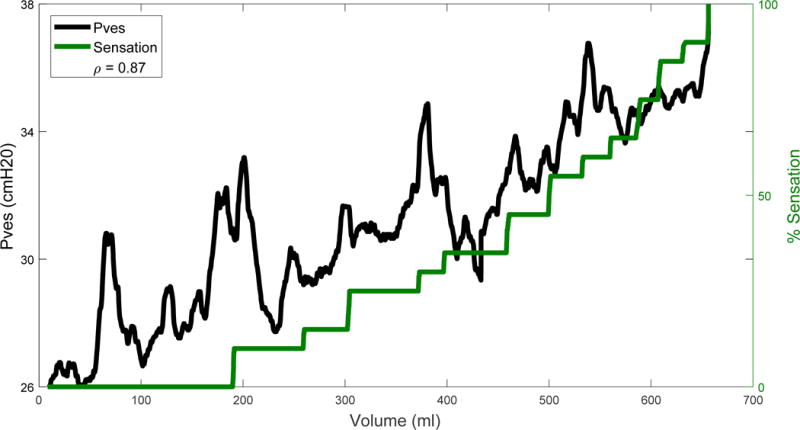
Readout of the sensation meter overlaid on the Pves measurement (blue line in Fig. 1) zoomed into the duration of filling (magenta arrow in Fig. 1) after being smoothed by a 10-second moving average. The correlation coefficient, ρ, between smoothed Pves and sensation was 0.87 and is displayed in the legend.
Images were analyzed using Digimizer software. Inner and outer perimeter edges of the bladder wall were manually traced, and bladder height and width were measured in the sagittal and transverse planes (Fig. 3). Due to low contrast of the bladder wall sides in the images, technicians estimated their location based on the visible anterior and posterior bladder walls assuming a near-constant thickness. The bladder wall cross-sectional area was calculated using a subtraction method as
| Eqn. 4 |
where Ao is the outer perimeter and Ai is the inner perimeter. Because some portions of the bladder wall were challenging to visualize, a ratio method was also used to estimate the bladder wall area. The wall thickness was most clearly visualized in the posterior portion of the image, therefore a segment of posterior wall was traced (Fig. 3, green) and used to estimate the full bladder wall area calculated as
| Eqn. 5 |
where Aarc is the area of the selected segment, Larc is the arc length of the inner perimeter of that segment, and Pi is the inner bladder perimeter. The bladder wall area loop in each cross-section can be cut and straightened into a rectangle with a length equal to the mean of the inner and outer perimeter and a thickness equal to the average wall thickness (Fig. 3). Wall thickness was calculated as
| Eqn. 6 |
where Po is the outer perimeter, using a method previously used to calculate fetal membrane thickness (Nunes et al., 2016).
So that interobserver reliability of tracing the ultrasound images could be assessed, the 2D images were analyzed by four evaluators ranging in experience from the ultrasound technologist who obtained the images to an individual who had never previously worked with ultrasound or bladder images. The values obtained by the evaluators were averaged to provide representative results for geometric and biomechanical parameters.
Bladder volume (V) was calculated using Equation 7, described in (Bih et al., 1998), in the sagittal plane using the sagittal height (h) and width (w) with the transverse width as the depth (d) and in the transverse plane using the transverse height and width with the sagittal width as the depth
| Eqn. 7 |
Pves was smoothed by a 100-point (10s) moving average filter, and zeroed by subtracting the pressure measurement at the moment of the first image (Pves at time=60s). Wall tension, stress, and strain in each direction were calculated using the smoothed, zeroed Pves at the moment that each image was obtained. Strain was the inner perimeter normalized to the inner perimeter at time=60s. A first-order Ogden model was fit to stress-strain data using the method described in (Habteyes et al., 2017).
Statistical Analyses
Statistical analyses were performed using MATLAB. To compare the wall area methods (subtraction vs ratio methods), a linear function was fit to each as a function of %capacity in each plane. The 95% confidence interval of the difference in fit parameters was calculated; if this interval did not cross through zero for at least one of the two fit parameters, the lines were considered statistically different (Schenker and Gentleman, 2001). The same method was used to compare image-based volume to the infused volume (VH2O). To test correlation between the sensation measurements and other parameters, the Pearson correlation coefficient was calculated. Pves, Pdet, and VH2O were correlated to sensation three ways: using the raw urodynamics (raw), the smoothed data (smoothed), and the smoothed data sampled at the times images were taken (smoothed-sampled). To test agreement between the image evaluators, the interclass correlation coefficient (ICC) was calculated for Ai and Ao in each image as the criterion-referenced reliability. To measure the precision of measurement between the four observers, the coefficient of variation for Ai and Ao of each image was measured as the standard deviation divided by the mean of the area measurements.
Results
Demographic Data
Demographic data from five individuals with OAB were obtained, including sex, race, BMI, cystometric capacity, and ICS-defined compliance (Table 1). DO was diagnosed all five participants and transient rises in pressure tended to be associated with increases in bladder sensation (Colhoun et al., 2016a). Average Pves during the initial fill and fill with ultrasound were 54.0±11.4 and 42.7±11.4 cmH2O. Image resolution ranged from 0.2 to 0.23 mm/pixel. Data from a representative participant are shown as an example (Figs. 1, 3–7, and 8b).
Table 1.
Demographic information on the five participants in age order. Sex is categorized as F for female and M for male. Race is categorized as C for Caucasian and AA for African American. Capacity is the bladder volume when the participant reported 100% filling sensation. Throughout this paper, images and results from participant #2 will be shown as a representative example.
| Patient # | Sex/Race | Age (years) | BMI (kg/m2) | Capacity (ml) | Compliance |
|---|---|---|---|---|---|
| 1 | F/C | 32 | 34 | 449 | 12 |
| 2 | F/C | 42 | 28 | 656 | 77 |
| 3 | M/C | 47 | 28 | 434 | 362 |
| 4 | F/AA | 51 | 40 | 223 | 7 |
| 5 | F/C | 57 | 31 | 496 | 33 |
| Mean | 4F/4C | 48.8±4.2 | 32±2.2 | 452±70 | 98±67 |
Figure 7.
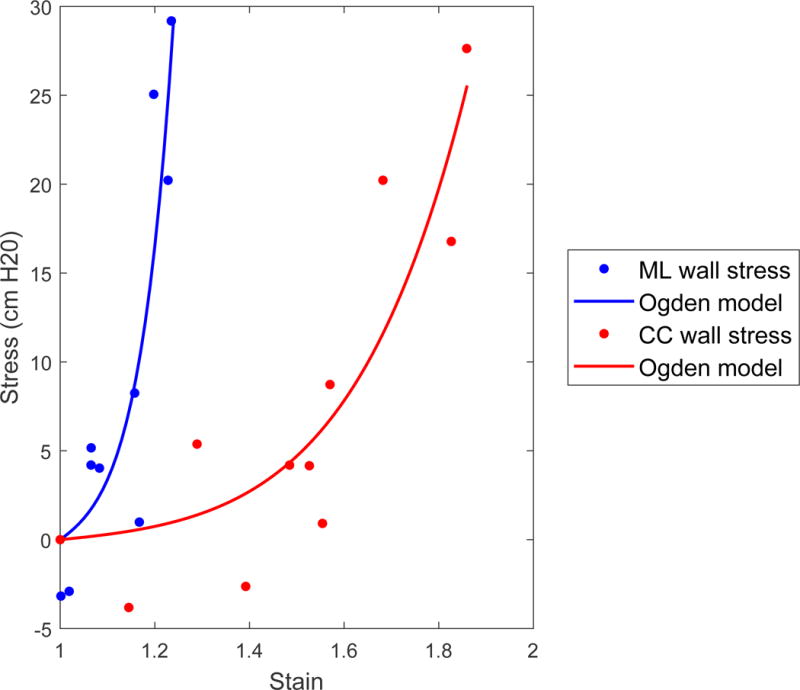
Stress strain curve with Ogden model fitted to points. The fit parameters were a=0.20 and b=8.84 in the medial-lateral direction and a=0.69 cmH2O and b=18.4 in the cranial-caudal direction.
Figure 8.
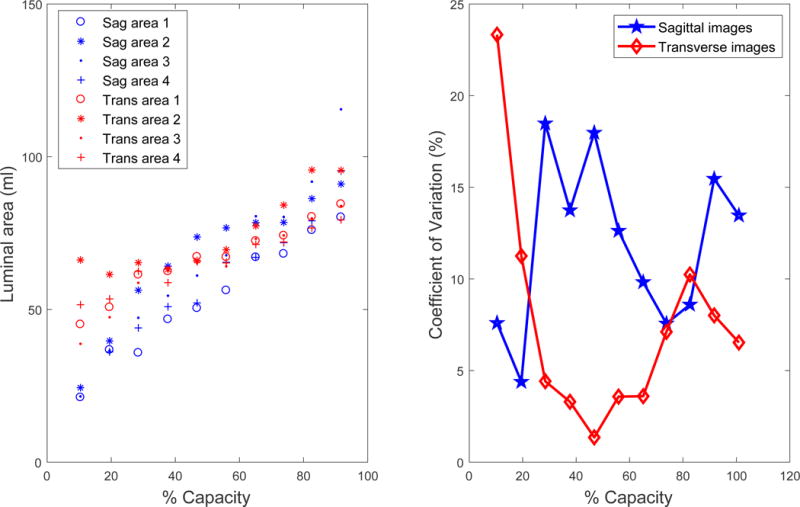
A) Luminal area of the bladder as judged by four different observers numbered 1 through 4 with decreasing expertise in bladder imaging. The interobserver correlation coefficient (ICC) was 0.88 in the sagittal (sag) and 0.82 in the transverse (trans) planes. B) The coefficient of variation as a percentage varied throughout filling differently for images in the two planes for the representative individual.
Geometric Parameters
Geometric parameters are those defined purely by image analysis and include volume, wall area, wall thickness, and perimeter. These parameters from the transverse and sagittal images are plotted against %capacity as a normalized volume measure (Fig. 5). These data demonstrate that sagittal image volume (Fig. 5a, blue) was a good estimate of bladder volume because it was not significantly different from the infused volume (Fig. 5a, magenta) in 80% of participants. In contrast, the transverse image volume (Fig. 5a, red) was a poor estimate of volume because it significantly overestimated the infused volume at low bladder capacities in 80% of participants. The wall areas measured by the ratio and subtraction methods were not significantly different (Fig. 5b–c, solid/dashed lines) in 90% of measurements.
Figure 5.
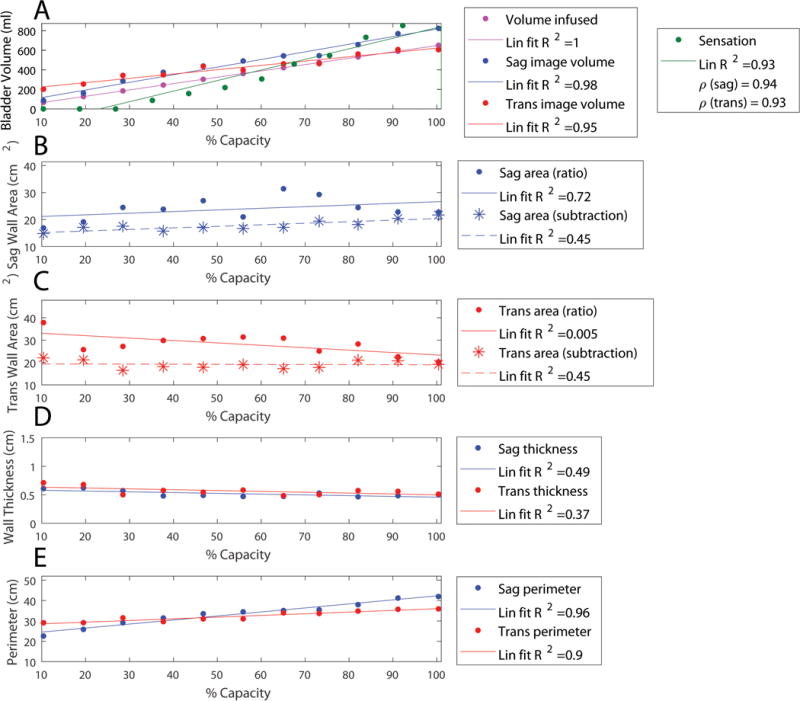
Geometric results from a representative individual based on analysis of ultrasound images with lines of best fit. Legends include R-squared value of the linear fit (Lin fit R2). A) The volume infused is shown in magenta, sagittal-image based volume is shown in blue, and transverse-image based volume is shown in red. Sensation is overlaid in green with correlation coefficient (ρ) between image based volumes and sensation shown in the legend. B) Sagittal wall area (Sag area) is shown as estimated by the ratio method (equation 5, dots with solid line fit) and subtraction method (equation 4, stars with dashed line fit). C) Transverse wall area (Trans area) is shown as estimated by the ratio method (dots with solid line fit) and subtraction method (stars with dashed line fit). D) Using the wall areas estimated by the subtraction method, the sagittal wall thickness is shown in blue and the transverse wall thickness in red. E) The inner bladder wall perimeter in the sagittal (blue) and transverse (red) planes is shown.
Biomechanical Parameters
Biomechanical parameters are those derived through a combination of image and pressure measurements and include pressure, wall tension, wall stress, and elastic modulus. Strain was calculated only using image analysis, but was included in Fig. 6d to illustrate that elastic modulus was calculated as stress divided by strain. These parameters in the cranial-caudal and medial-lateral directions are plotted against %capacity as a normalized measure of volume (Fig. 6). Patient-reported bladder sensation is overlaid in green to show how these parameters correlate with sensation. Ogden model parameters (Fig. 7) averaged a=3.03±2.55 cmH2O and b=8.77±1.47 in the cranial-caudal direction and a=3.58±1.38 cmH2O and b=14.13±3.72 in the medial-lateral direction.
Figure 6.
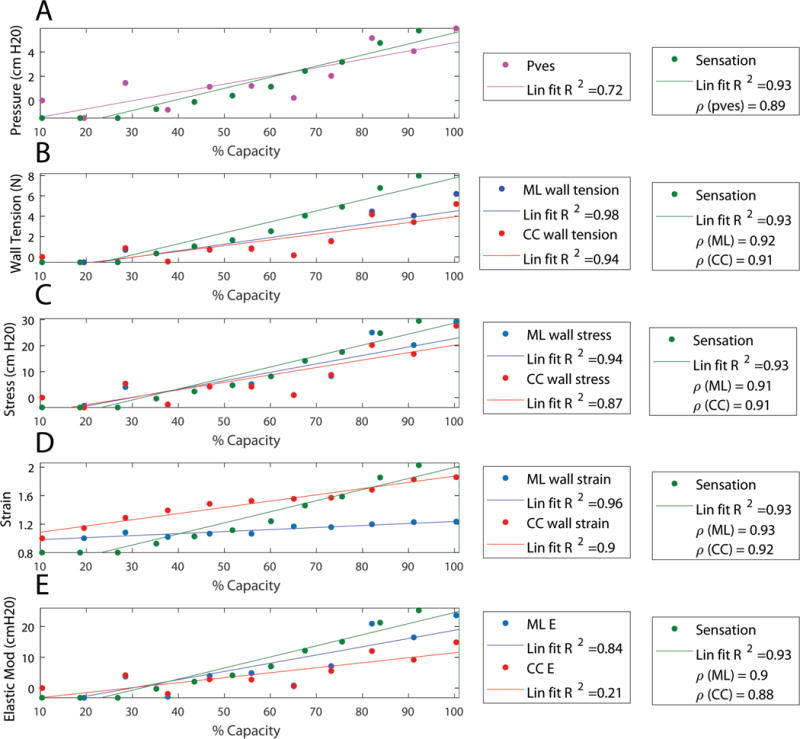
Calculated parameters from the same representative individual overlaid with real-time sensation (green) with lines of best fit. Legends include R-squared value of the linear fit (Lin fit R2) and correlation coefficient (ρ) between each quantity and sensation. A) Pressure (Pves) from the urodynamics system after being smoothed and sampled at the times where images were obtained is shown in magenta. B) Wall tension is shown for the medial-lateral (ML) direction in blue and in the cranial-caudal (CC) in red. C) Wall stress calculated using the wall area measured by the subtraction method (stars in Fig. 5) is shown for the medial-lateral (ML) direction in blue and in the cranial-caudal (CC) in red. D: Wall strain calculated as the perimeter normalized to the initial perimeter is shown for the medial-lateral (ML) direction in blue and in the cranial-caudal (CC) in red. E) Elastic modulus (Elastic Mod and E) is shown for the medial-lateral (ML) direction in blue and in the cranial-caudal (CC) in red.
Sensation Correlations
In Table 2, bladder geometric, biomechanical, and urodynamic properties were each correlated to patient-reported sensation. Correlations that approached 1.0 were considered best. As shown in Table 2, tension, volume, and perimeter strain correlated best with sensation and were far superior to the standard urodynamic parameter of Pdet. This suggests that Pdet may not reliably reflect the state of the detrusor wall during urodynamics and that the novel geometric and biomechanical parameters developed in this study may offer methodologic improvements.
Table 2.
Pearson correlation coefficients for urodynamic, geometric, and biomechanical parameters. Each quantity shows the average and standard error (Mean±SEM) of all correlation coefficients for the five participants. All correlations had p-values less than 0.05. The urodynamic parameters have correlations to urgency using the raw data, to data smoothed by a 100-point (10-second) moving average, and the smoothed data sampled at the moments at which the images were obtained.
| Data source | Parameter | Raw | Smoothed | Smoothed-sampled |
|---|---|---|---|---|
| Urodynamics | Pves | 0.63±0.05 | 0.72±0.05 | 0.89±0.02 |
| Pdet | 0.27±0.18 | 0.30±0.22 | 0.36±0.31 | |
| VH20 | 0.94±0.02 | 0.94±0.02 | 0.96±0.02 | |
| Data source | Parameter | Sagittal | Transverse | |
| Image analysis | Volume | 0.96±0.01 | 0.93±0.02 | |
| Strain | 0.94±0.02 | 0.90±0.02 | ||
| Data source | Parameter | Medial-lateral | Cranial-caudal | |
| Image analysis combined with smoothed and sampled Pves | Tension | 0.94±0.02 | 0.93±0.02 | |
| Stress | 0.92±0.03 | 0.90±0.02 | ||
| Elastic Modulus | 0.89±0.03 | 0.78±0.10 |
Measurement reliability
Figure 8a shows the luminal (cross-sectional) area of the fluid inside the bladder determined by the four evaluators for the images from the example participant. Some disagreement is seen at very small volumes where the bladder walls were less defined and at the highest volume where the edge of the bladder was not fully captured in the image. The Mean±SEM ICC for the inner and outer areas of the five sets of images were 0.90±0.04 and 0.88±0.04 for the sagittal images and 0.90±0.05 and 0.83±0.07 for the transverse images. The coefficient of variation (Fig. 8b) for the inner and outer areas averaged 11.8±5.3% and 11.2±3.1% for the sagittal plane and 6.4±4.3% and 6.4±2.8% for the transverse plane. The high ICC and the low coefficients of variation suggest that even those with limited image analysis experience can effectively perform bladder geometric measurements necessary to derive the geometric and biomechanical parameters described in this study.
Discussion
This study presents a novel method to clinically investigate bladder wall biomechanics and quantify wall stress, perimeter strain, and more using geometric data from ultrasound images and urodynamic pressure data. This is the first study to quantify these biomechanical properties in humans, and represents a potential advance over standard urodynamics which provides little information about the true state of the detrusor wall.
In standard urodynamics, bladder compliance is measured as the change in volume divided by the change in pressure for an entire fill. Alterations in compliance determined by this method have been linked to several conditions (Madersbacher et al., 1999); however, these measurements do not provide any specific and clinically useful information about detrusor wall function (Coolsaet, 1985; Smith et al., 2012). This single measurement does not provide data on dynamic elasticity or other short-term changes in bladder properties. The elastic modulus calculated in this study is analogous to the inverse of compliance, and measuring it at multiple points during filling provides a mechanistic assessment of how the bladder wall becomes less compliant at higher volumes. The non-linear Ogden model may provide improved constitutive modeling capabilities. The fit-parameter “a” in this study was significantly higher than what was found in rabbit bladder strips (Habteyes et al., 2017), perhaps due to differences in species, setup, or because this methodology assumes negligible external pressure on the bladder.
Preclinical studies on human detrusor strips and whole bladders from animal models established that repeat passive fill-empty cycles strain soften the bladder wall, a process that is reversed after active contraction at short muscle lengths (Colhoun et al., 2015; Speich et al., 2005; Speich et al., 2007). Reversible strain softening (identified as reversible pressure changes and termed dynamic elasticity) has been identified during comparative-fill urodynamics (Colhoun et al., 2016b). Importantly, reversible strain softening is altered in a model of DO and is regulated via Rho-kinase (Speich et al., 2005; Speich et al., 2012); Therefore, methods directly quantifying bladder wall biomechanics in vivo may provide important information for bladder disorder diagnosis and evaluation of treatment effectiveness.
This methodology has the advantage of non-invasivity. Urodynamic studies are often uncomfortable, costly, and increase the risk of urinary tract infection (Nager et al., 2012). Transabdominal ultrasound is non-invasive and well tolerated by patients. Although many of the biomechanical properties require both urodynamic (pressure) and ultrasound (geometric) data, volume and perimeter strain only require geometric data and had the best correlation to sensation. These parameters can be measured by taking serial ultrasound measurements throughout filling induced by non-invasive oral hydration (De Wachter et al., 2014; Heeringa et al., 2012; Heeringa et al., 2012; Nagle et al., 2016). Measuring perimeter strain only requires the luminal area to be traced, which could potentially be accomplished automatically using edge detection; therefore, this parameter has high potential to be developed as a stand-alone noninvasive test or screening tool used before urodynamics.
In this study, real-time sensation had higher correlation to volume, tension, strain, and stress than to any measure of pressure. The high correlation with stress is consistent with studies in rats where afferent nerve signaling had higher correlation to wall stress than to pressure, although the high correlation with volume was not observed (Le Feber et al., 2004). When the present data were used in Le Feber’s function of Pves times infused volume to approximate stress (Le Feber et al., 2004), which assumes a thin-walled spherical bladder and a large ratio of bladder volume to bladder wall volume, the correlation between sensation and stress rose to 0.96±0.03, similar to the correlation between sensation and volume. While these assumptions are likely valid for rat bladders, this study’s imaging data confirm that human bladders are not spherical nor do they fill evenly in all directions, as can be seen in the animated gifs included online as supplemental information. Furthermore, the perception of bladder sensation in humans has more confounding psychological factors than afferent nerve activity in rats.
Bladder pressure (Pdet in Fig. 1) is often calculated as Pves minus the intra-abdominal pressure to eliminate transient fluctuations (Colhoun et al., 2016b). In addition to the reasons described in Colhoun et. al., this study used Pves instead of Pdet because Pves consistently had a much higher correlation with sensation than Pdet (Table 2). Pves data was zeroed by subtracting Pves at 10% capacity corresponding to the first image obtained. Likewise, strain was measured as the bladder perimeter normalized to the perimeter at 10% capacity. This was a more preferable initial point than 0% capacity because the bladder borders lack contrast in the images at very low volumes and are difficult to identify accurately.
The clinical usefulness of this ultrasound-based methodology depends on the ability of an evaluator to accurately trace the bladder wall, and in the present study excellent ICCs were identified despite widely different experience with image analysis. Two methods to measure bladder wall area (ratio and subtraction) were employed in this study. Their results were not significantly different in nearly all cases, and because the subtraction method is faster and easier, it is recommended for future studies. It was expected that the wall area would decrease in each plane during filling, but this was only measured in 20% of the cases using either method. This may be due to uneven filling, non-homogenous or non-isotropic wall properties, or a limitation in the measurement technique. The method of modeling the bladder wall as a straightened, rectangular shape assumed a constant thickness, but in the ultrasound images, the wall appears wider in the anterior bladder, possibly due to enhanced reflection of the ultrasound signal at this location. The average wall thickness in this study was 5 mm (range 4–10 mm), just above the ladder wall thicknesses ranging from 1.1 to 4.5 mm reported by Blatt et al. in a group of men and women (Blatt et al., 2008). More data are necessary to determine if this discrepancy is due to natural variations in wall thickness between different regions of the bladder wall or other reasons. The present study may have overestimated wall thickness because measurements focused on the bladder posterior where the ultrasound signal is amplified.
The current study is limited by small sample size, by relying on only Pves to quantify all changes in bladder pressure, and by simply defining a methodology rather than showing that this methodology can truly impact clinical practice. Although this method has only been demonstrated on five individuals, their demographic and urologic parameters were diverse and show broad feasibility for this method. The present data were obtained in a comparative-fill study in which external pressures did not significantly change over the study duration (Colhoun et al., 2016b). This indicates that analysis of relative changes in biomechanical parameters during filling may be valid. Because external forces are unknown, direct comparisons of parameter magnitudes between patients may not always be useful; however, relative changes, identified within a single fill or between comparative fills, may permit the development of techniques to sub-categorize patients with tension-mediated and shape-mediated OAB. As a result, this study may represent a significant step forward in the development of novel and objective bladder diagnostics.
Several challenges arose during the process of defining the current techniques. Ultrasound determinations of bladder volume (as compared to infused volumes), appeared more accurate when imaging in the sagittal plane as compared to the transverse plane. This is consistent with data obtained from (Bih et al., 1998). It is possible that pressure induced from the ultrasound probe itself may affect pressure measurements and sensations of urgency, but since the probe was held against the bladder constantly to maintain its position, any contribution to additional pressure should have been relatively constant. Pressures tended to be higher in the initial fill than the fill with ultrasound, demonstrating that the additional pressure of the probe was small enough to be obscured by dynamic elasticity (Colhoun et al., 2016b). Finally, our methodology makes assumptions that may not be valid in the presence of bladder diverticula, which were identified in two participants. Stresses in locations near diverticula are expected to be higher than in the rest of the bladder and their value could only be calculated using numerical approximation methods rather than the closed form solutions utilized in this study (Young and Budynas, 2002).
In conclusion, transabdominal ultrasound imaging can be incorporated with clinical urodynamics to measure bladder biomechanical parameters including wall tension, stress, strain, and elastic modulus. The present study demonstrates the feasibility of applying ultrasound during urodynamics and provides a methodologic roadmap that could be used to improve upon the information currently obtained during standard urodynamic testing. Future work using this methodology may provide improved insight into the pathophysiology of OAB and other forms of voiding dysfunction.
Supplementary Material
Acknowledgments
Research funding for this study was provided by the Virginia Commonwealth University Presidential Research Quest Fund, the Dean’s Undergraduate Research Initiative, and NIH grant R01DK101719. The authors would like to thank Sandy Smith, Rachel Wilbur, Kimberly Bradley, Zachary Cullingsworth, Stefan Harris, and Paul Ratz for their technical contributions to this work.
Footnotes
Publisher's Disclaimer: This is a PDF file of an unedited manuscript that has been accepted for publication. As a service to our customers we are providing this early version of the manuscript. The manuscript will undergo copyediting, typesetting, and review of the resulting proof before it is published in its final citable form. Please note that during the production process errors may be discovered which could affect the content, and all legal disclaimers that apply to the journal pertain.
Conflict of Interest statement
The authors have no conflicts of interest associated with this manuscript.
Supplementary Material. Animated gifs of the sagittal and transverse cross-sectional images of the bladder throughout filling of the representative individual.
References
- Abrams P, Cardozo L, Fall M, Griffiths D, Rosier P, Ulmsten U, van Kerrebroeck P, Victor A, Wein A. The standardisation of terminology of lower urinary tract function: report from the Standardisation Sub-committee of the International Continence Society. American Journal of Obstetrics and Gynecology. 2002;187:116–126. doi: 10.1067/mob.2002.125704. [DOI] [PubMed] [Google Scholar]
- Bih L, Ho C, Tsai S, Lai Y, Chow W. Bladder shape impact on the accuracy of ultrasonic estimation of bladder volume. Archives of Physical Medicine and Rehabilitation. 1998;79:1553–1556. doi: 10.1016/s0003-9993(98)90419-1. [DOI] [PubMed] [Google Scholar]
- Blatt AH, Titus J, Chan L. Ultrasound measurement of bladder wall thickness in the assessment of voiding dysfunction. The Journal of Urology. 2008;179:2275–2279. doi: 10.1016/j.juro.2008.01.118. [DOI] [PubMed] [Google Scholar]
- Colhoun AF, Speich JE, Dolat MT, Habibi JR, Guruli G, Ratz PH, Barbee RW, Klausner AP. Acute length adaptation and adjustable preload in the human detrusor. Neurourology and Urodynamics. 2015 doi: 10.1002/nau.22820. [DOI] [PubMed] [Google Scholar]
- Colhoun A, Klausner A, Dolat M, Bell E, Nagle A, Ratz P, Barbee R, Speich J. Low amplitude rhythmic contractions influence sensation of urgency in patients with overactive bladder syndrome. The Journal of Urology. 2016a;4:e1017. [Google Scholar]
- Colhoun AF, Klausner AP, Nagle AS, Carroll AW, Barbee RW, Ratz PH, Speich JE. A pilot study to measure dynamic elasticity of the bladder during urodynamics. Neurourology and Urodynamics. 2016b doi: 10.1002/nau.23043. [DOI] [PMC free article] [PubMed] [Google Scholar]
- Coolsaet B. Bladder compliance and detrusor activity during the collection phase. Neurourology and Urodynamics. 1985;4:263–273. [Google Scholar]
- Coyne KS, Sexton CC, Bell JA, Thompson CL, Dmochowski R, Bavendam T, Chen C, Quentin Clemens J. The prevalence of lower urinary tract symptoms (LUTS) and overactive bladder (OAB) by racial/ethnic group and age: Results from OAB‐POLL. Neurourology and Urodynamics. 2013;32:230–237. doi: 10.1002/nau.22295. [DOI] [PubMed] [Google Scholar]
- Damaser MS, Lehman SL. The effect of urinary bladder shape on its mechanics during filling. Journal of Biomechanics. 1995;28:725–732. doi: 10.1016/0021-9290(94)00169-5. [DOI] [PubMed] [Google Scholar]
- De Wachter S, Smith P, Tannenbaum C, Van Koeveringe G, Drake M, Wyndaele J, Chapple C. How should bladder sensation be measured?: ICI‐RS 2011. Neurourology and Urodynamics. 2012;31:370–374. doi: 10.1002/nau.22214. [DOI] [PubMed] [Google Scholar]
- De Wachter SG, Heeringa R, Van Koeveringe GA, Winkens B, Van Kerrebroeck PE, Gillespie JI. “Focused introspection” during naturally increased diuresis: Description and repeatability of a method to study bladder sensation non‐invasively. Neurourology and Urodynamics. 2014;33:502–506. doi: 10.1002/nau.22440. [DOI] [PubMed] [Google Scholar]
- Digesu GA, Khullar V, Cardozo L, Salvatore S. Overactive bladder symptoms: do we need urodynamics? Neurourology and Urodynamics. 2003;22:105–108. doi: 10.1002/nau.10099. [DOI] [PubMed] [Google Scholar]
- Drake MJ, Harvey IJ, Gillespie JI, Van Duyl WA. Localized contractions in the normal human bladder and in urinary urgency. BJU International. 2005;95:1002–1005. doi: 10.1111/j.1464-410X.2005.05455.x. [DOI] [PubMed] [Google Scholar]
- Frenkl TL, Railkar R, Palcza J, Scott BB, Alon A, Green S, Schaefer W. Variability of urodynamic parameters in patients with overactive bladder. Neurourology and Urodynamics. 2011;30:1565–1569. doi: 10.1002/nau.21081. [DOI] [PubMed] [Google Scholar]
- Habteyes FG, Komari SO, Nagle AS, Klausner AP, Heise RL, Ratz PH, Speich JE. Modeling the influence of acute changes in bladder elasticity on pressure and wall tension during filling. Journal of the Mechanical Behavior of Biomedical Materials. 2017 doi: 10.1016/j.jmbbm.2017.02.020. [DOI] [PMC free article] [PubMed] [Google Scholar]
- Heeringa R, van Koeveringe G, Winkens B, van Kerrebroeck P, de Wachter S. Do patients with OAB experience bladder sensations in the same way as healthy volunteers? A focus group investigation. Neurourology and Urodynamics. 2012;31:521–525. doi: 10.1002/nau.21232. [DOI] [PubMed] [Google Scholar]
- Le Feber J, van Asselt E, van Mastrigt R. Afferent bladder nerve activity in the rat: a mechanism for starting and stopping voiding contractions. Urological Research. 2004;32:395–405. doi: 10.1007/s00240-004-0416-8. [DOI] [PubMed] [Google Scholar]
- Lotz HT, Remeijer P, van Herk M, Lebesque JV, de Bois JA, Zijp LJ, Moonen LM. A model to predict bladder shapes from changes in bladder and rectal filling. Medical Physics. 2004;31:1415–1423. doi: 10.1118/1.1738961. [DOI] [PubMed] [Google Scholar]
- Madersbacher S, Pycha A, Klingler CH, Mian C, Djavan B, Stulnig T, Marberger M. Interrelationships of bladder compliance with age, detrusor instability, and obstruction in elderly men with lower urinary tract symptoms. Neurourology and Urodynamics. 1999;18:3–13. doi: 10.1002/(sici)1520-6777(1999)18:1<3::aid-nau2>3.0.co;2-4. [DOI] [PubMed] [Google Scholar]
- Morrison J. The activation of bladder wall afferent nerves. Experimental Physiology. 1999;84:131–136. doi: 10.1111/j.1469-445x.1999.tb00078.x. [DOI] [PubMed] [Google Scholar]
- Nager CW, Brubaker L, Litman HJ, Zyczynski HM, Varner RE, Amundsen C, Sirls LT, Norton PA, Arisco AM, Chai TC. A randomized trial of urodynamic testing before stress-incontinence surgery. New England Journal of Medicine. 2012;366:1987–1997. doi: 10.1056/NEJMoa1113595. [DOI] [PMC free article] [PubMed] [Google Scholar]
- Nagle AS, Speich JE, De Wachter SG, Ghamarian PP, Le DM, Colhoun AF, Ratz PH, Barbee RW, Klausner AP. Non-invasive characterization of real-time bladder sensation using accelerated hydration and a novel sensation meter: an initial experience. Neurourology and Urodynamics. 2016 doi: 10.1002/nau.23137. [DOI] [PMC free article] [PubMed] [Google Scholar]
- Nunes V, Cross J, Speich JE, Morgan DR, Strauss JF, Ramus RM. Fetal membrane imaging and the prediction of preterm birth: a systematic review, current issues, and future directions. BMC Pregnancy and Childbirth. 2016;16:387. doi: 10.1186/s12884-016-1176-5. [DOI] [PMC free article] [PubMed] [Google Scholar]
- Schenker N, Gentleman JF. On judging the significance of differences by examining the overlap between confidence intervals. The American Statistician. 2001;55:182–186. [Google Scholar]
- Smith PP, DeAngelis AM, Kuchel GA. Evidence of central modulation of bladder compliance during filling phase. Neurourology and Urodynamics. 2012;31:30–35. doi: 10.1002/nau.21223. [DOI] [PMC free article] [PubMed] [Google Scholar]
- Speich JE, Borgsmiller L, Call C, Mohr R, Ratz PH. ROK-induced cross-link formation stiffens passive muscle: reversible strain-induced stress softening in rabbit detrusor. American Journal of Physiology. Cell Physiology. 2005;289:C12–21. doi: 10.1152/ajpcell.00418.2004. [DOI] [PubMed] [Google Scholar]
- Speich JE, Dosier C, Borgsmiller L, Quintero K, Koo HP, Ratz PH. Adjustable passive length-tension curve in rabbit detrusor smooth muscle. Journal of Applied Physiology (Bethesda, Md: 1985) 2007;102:1746–1755. doi: 10.1152/japplphysiol.00548.2006. [DOI] [PubMed] [Google Scholar]
- Speich JE, Southern JB, Henderson S, Wilson CW, Klausner AP, Ratz PH. Adjustable passive stiffness in mouse bladder: regulated by Rho kinase and elevated following partial bladder outlet obstruction. American Journal of Physiology. Renal Physiology. 2012;302:F967–76. doi: 10.1152/ajprenal.00177.2011. [DOI] [PMC free article] [PubMed] [Google Scholar]
- Watanabe H, AKIYAMA K, SAITO T, OKI F. A finite deformation theory of intravesical pressure and mural stress of the urinary bladder. The Tohoku Journal of Experimental Medicine. 1981;135:301–307. doi: 10.1620/tjem.135.301. [DOI] [PubMed] [Google Scholar]
- Young WC, Budynas RG. Roark’s formulas for stress and strain. McGraw-Hill; New York: 2002. [Google Scholar]
Associated Data
This section collects any data citations, data availability statements, or supplementary materials included in this article.