

In older individuals with or at risk for osteoarthritis of the knee, superolateral Hoffa fat pad edema at MR imaging is significantly associated with a more anterior lateral femoral trochlear facet, lateral patellar translation, and increased patellar height.
Abstract
Purpose
To determine the relationship of patellofemoral joint alignment and trochlear morphology to superolateral Hoffa fat pad (SHFP) edema on magnetic resonance (MR) images in older adults with or at risk for osteoarthritis of the knee.
Materials and Methods
Institutional review board approval and written informed consent were obtained from all subjects. The Multicenter Osteoarthritis Study is a prospective cohort study of older adults with or at risk for osteoarthritis of the knee. Subjects were recruited from Birmingham, Alabama, and Iowa City, Iowa. In this cross-sectional study, patellofemoral joint alignment (bisect offset, patellar tilt angle, and Insall-Salvati ratio), trochlear morphology (sulcus angle, lateral and medial trochlear inclination, and trochlear angle) and SHFP edema were assessed on MR images of the knee. Measures of alignment and morphology were divided into quartiles, and SHFP was determined to be present or absent. Separate logistic regression models were used to determine the relationship of each measure of alignment and morphology to the presence of SHFP edema, with adjustments for age, sex, and body mass index.
Results
SHFP edema was present in 152 (13.4%) of the 1134 knees that were included. When compared with knees with measurements in the lowest quartile, knees with measurements in the highest quartile for trochlear angle, bisect offset, and Insall-Salvati ratios were 1.6 (95% confidence interval [CI]: 1.0, 2.6), 2.3 (95% CI: 1.3, 4.0), and 8.9 (95% CI: 4.7, 16.9) times more likely to show SHFP edema, respectively. No relationship was found between other measures and SHFP edema.
Conclusion
A more anterior trochlear facet, a more laterally displaced patella, and knees with patella alta were significantly associated with SHFP edema on MR images in subjects with or at risk for osteoarthritis of the knee.
© RSNA, 2017
Introduction
The infrapatellar or Hoffa fat pad is a highly innervated intracapsular extrasynovial tissue. Inflammation in the Hoffa fat pad is evident as signal hyperintensity on T2-weighted magnetic resonance (MR) images and is a marker of synovitis, albeit a nonspecific one (1,2). In a retrospective study of 42 patients with chronic anterior and lateral knee pain, Chung et al (3) highlighted the importance of a specific area of hyperintensity on images in the superolateral Hoffa fat pad (SHFP). SHFP edema is hypothesized to be caused by friction between the patellar tendon and the lateral femoral condyle and by patellofemoral joint malalignment, which may lead to impingement of the fat pad. This hypothesis led to further investigations of specific morphologic features that relate to SHFP edema in young adults with knee pain.
Results of previous studies have shown that measures of patellofemoral joint (PFJ) alignment (ie, lateral displacement and patellar height) and trochlear morphology (ie, sulcus angle, trochlear inclination angle) are related to SHFP edema (4–8). In general, these studies included young patients (< 40 years old) who underwent MR imaging for knee pain. Subhawong et al (4) found no relationship between patellar lateral displacement and SHFP edema, while patellar height and patellar tilt were associated with SHFP edema. Conversely, authors of other studies (6,7) reported that patellar lateral displacement is associated with SHFP edema. Age, sex (SHFP edema is more common in women [4,7]) and body mass index (BMI), which may be important confounders, were not taken into account in these studies.
Changes in signal intensity in the Hoffa fat pad (ie, a surrogate marker of synovitis on MR images without administration of intravenous contrast material) in patients with osteoarthritis of the knee have shown associations with longitudinal structural damage and manifestations of symptoms in elderly adults (9,10). However, the prevalence of SHFP edema and the relationship of PFJ alignment and trochlear morphology to SHFP edema in older adults are unknown, to our knowledge. Thus, the objective of our study was to determine the prevalence of SHFP edema and the relationship of measures of trochlear morphology and patellofemoral joint alignment to SHFP edema in a large cohort of older adults with or at risk for osteoarthritis of the knee. We hypothesized that abnormal alignment and trochlear morphology would be associated with increased odds of SHFP edema at MR imaging.
Materials and Methods
Study Population
The Multicenter Osteoarthritis (MOST) Study is a National Institutes of Health–funded prospective study of older individuals with or at risk for knee osteoarthritis at baseline. Subjects were recruited in Birmingham, Alabama, and Iowa City, Iowa. The details of MOST have been described in several previous studies (11–13). Institutional review board approval was obtained at the University of California, San Francisco; the University of Alabama, Birmingham; the University of Iowa; and Boston University. Written informed consent was obtained from all subjects.
MOST included 3026 individuals aged 50–79 years. MOST subjects were recruited and enrolled between 2003 and 2005. Subjects considered to be at high risk for developing knee osteoarthritis included those who were overweight or obese; had knee pain, aching, or stiffness for most of the past 30 days; had a history of knee injury that made it difficult to walk for at least 1 week, or had undergone previous knee surgery. Subjects were not eligible to participate in the MOST study if they had rheumatoid arthritis, ankylosing spondylitis, psoriatic arthritis, reactive arthritis, renal insufficiency that required hemodialysis or peritoneal dialysis, or a history of cancer (except for nonmelanoma types of skin cancer); underwent or planned to undergo bilateral knee replacement surgery; were unable to walk without assistance; or were planning to move out of the area in the next 3 years. In our current study, we used data from one of the visits during which all eligible subjects underwent knee MR imaging to assess for other structural features of knee osteoarthritis.
Subjects from the MOST study who underwent MR imaging of structural features of osteoarthritis and in whom other studies were performed as part of the main aims of the MOST study were evaluated for eligibility in our study, and 1185 subjects were included. One randomly selected knee per subject was chosen (1185 knees) (Fig 1). We assessed trochlear morphology and patellofemoral joint alignment (exposure variables) on axial MR images and patellar height on lateral radiographs. SHFP edema (outcome variable) was assessed on sagittal MR images.
Figure 1:

Flowchart shows subject and knee selection. Final analysis included 1134 knees.
MR Image Acquisition
Knee MR images were obtained by using a 1.0-T dedicated extremity unit (OrthOne; GE Healthcare, formerly Oni Medical Systems, Wilmington, Mass) with a circumferential extremity coil. The choice of pulse sequences for the parent MOST study was based on a time-efficient sequence protocol. Fat-suppressed fast spin-echo proton density–weighted sequences were performed on two planes: sagittal (repetition time msec/echo time msec, 4800/35; section thickness, 3 mm; intersection gap, 0 mm; number of sections, 32; matrix, 288 × 192; field of view, 140 mm2; echo train length, eight) and axial (4680/13; section thickness, 3 mm; intersection gap, 0 mm; number of sections, 20; matrix, 288 × 192; field of view, 140 mm2; echo train length, eight). Examinations were performed at the University of Alabama, Birmingham, and the University of Iowa.
Assessment of Trochlear Morphology
Trochlear morphology was assessed by R.W. (with 1 year of experience). He was trained by J.S. (with 10 years of experience reading PFJ alignment and morphology from MR images) and A.G. (with 17 years of experience). We first chose the section from the axial MR imaging series in which the medial and lateral posterior femoral condyles were the most posterior. On this section,FJ the posterior condylar line (PCL) was drawn by connecting the medial and lateral posterior femoral condyles (Fig 2) (14). All of the following measures of trochlear morphology were assessed on this section (15–17). For all measurements, when osteophytes were present, the bone was measured as if there was no osteophyte by following the osseous contour.
Figure 2:

Drawing shows choice of section for measurement of morphology and patellar alignment. Morphology measurements were based on section with the most posterior condyle, while patellar measurements were based on section with the widest patellar width.
First, the sulcus angle was defined as the angle between the medial and lateral trochlear facets (18) (Fig 3a). The lateral trochlear inclination angle was defined as the angle between the line along the lateral facet and the PCL (18). The medial trochlear inclination angle was defined as the angle between the line along the medial facet and the PCL. Finally, the trochlear angle was defined as the angle between a line along the most anterior points of medial and lateral trochlear facets and the PCL (18) (Fig 3b).
Figure 3a:

Axial MR images show assessment of trochlear morphology and PFJ alignment. (a) PCL and sulcus angle (SA) were drawn (14,18). Lateral and medial trochlear inclination angles (LTI and MTI) were determined from SA and PCL, (b) trochlear angle (TA) was drawn with vertex on medial side, and (c) patellar width was drawn on section with greatest patellar width (17,19) from most lateral point to most medial point. Patellar tilt angle (PTA) was determined as angle between patellar width line and PCL. Bisect offset (BO) was defined as percentage of patella width lateral to midline.
Figure 3b:

Axial MR images show assessment of trochlear morphology and PFJ alignment. (a) PCL and sulcus angle (SA) were drawn (14,18). Lateral and medial trochlear inclination angles (LTI and MTI) were determined from SA and PCL, (b) trochlear angle (TA) was drawn with vertex on medial side, and (c) patellar width was drawn on section with greatest patellar width (17,19) from most lateral point to most medial point. Patellar tilt angle (PTA) was determined as angle between patellar width line and PCL. Bisect offset (BO) was defined as percentage of patella width lateral to midline.
Assessment of PFJ Alignment
PFJ alignment on MR images was also assessed by R.W. After trochlear morphology was assessed, we determined the axial MR imaging section with the maximum patellar width for the measures of PFJ alignment (Fig 2) (17). A line was drawn connecting the medial and lateral margins of the patella. A line perpendicular to the PCL that passed through the center of the trochlear groove was drawn on the same section as that of the PCL. Both lines were copied to the section with maximum patellar width. The patellar tilt angle was the angle between the PCL and the line defining the maximal patellar width (19). The bisect offset was defined as the percentage of the patella lateral to the midline (19) (Fig 3c).
Figure 3c:

Axial MR images show assessment of trochlear morphology and PFJ alignment. (a) PCL and sulcus angle (SA) were drawn (14,18). Lateral and medial trochlear inclination angles (LTI and MTI) were determined from SA and PCL, (b) trochlear angle (TA) was drawn with vertex on medial side, and (c) patellar width was drawn on section with greatest patellar width (17,19) from most lateral point to most medial point. Patellar tilt angle (PTA) was determined as angle between patellar width line and PCL. Bisect offset (BO) was defined as percentage of patella width lateral to midline.
The vertical position of the patella or patellar height was assessed by M.R. (with 3 years of experience, trained by A.G.). The Insall-Salvati ratio (ISR) was measured on the lateral sagittal radiograph of the semiflexed knee (20). We used the lateral radiograph of the weight-bearing flexed knee as opposed to the sagittal MR image, because the patellar position can change with knee flexion and quadriceps contraction. The sagittal MR imaging was performed with full knee extension and the quadriceps relaxed, and in this position, the patellar tendon is slackened. With the use of the lateral radiograph of the weight-bearing flexed knee, the slack in the patellar tendon was removed. The radiographic procedure was standardized throughout all patients and study sites (21). The ISR is the ratio between the length of the patellar tendon and length of the patella. PFJ alignment and trochlear morphologic readings from MR imaging were performed (R.W.) by using software (OsiriX version 7.0; Pixmeo SARL, Geneva, Switzerland). Measurement of patellar height on lateral knee radiographs was performed (M.R.) by using a digital imaging and communications in medicine viewer (RadiAnt DICOM Viewer 3.2.3; Medicant, Poznan, Poland).
Assessment of SHFP
A musculoskeletal radiologist (M.J., with 5 years of experience in standardized semiquantitative MR imaging assessments of knee osteoarthritis), who was blinded to all other measures, evaluated sagittal fat-suppressed proton-density images for SHFP edema by using a 0–3 scale on the basis of the size of edema between the lateral femoral condyle and the lateral aspect of the patellar tendon (grade 0, absent; grade 1, mild [10% or less of the length of the patellar tendon]; grade 2, moderate [10%–30% of the length of the patellar tendon]; grade 3, severe [more than 30% of the length of the patellar tendon]) (22) (Fig 4).
Figure 4a:
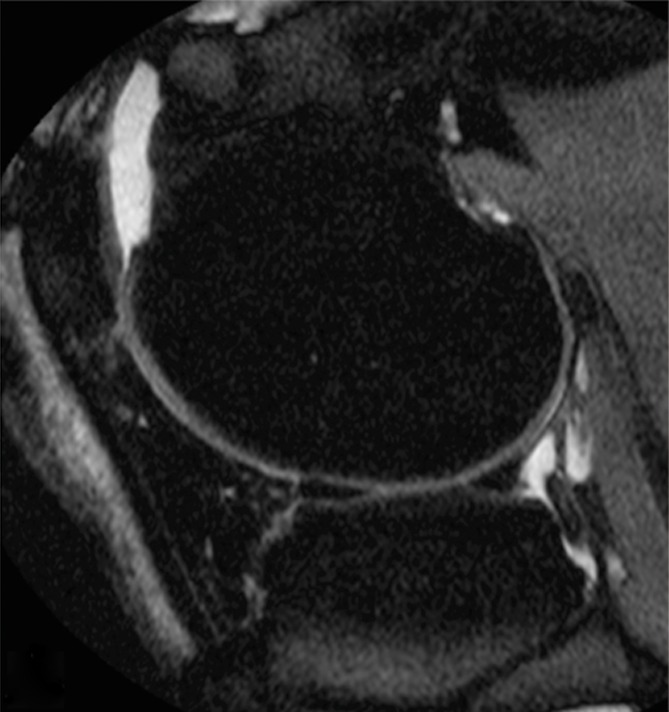
Sagittal MR images of the knee show SHFP scoring system for (a) normal, (b) mild or grade 1, (c) moderate or grade 2, and (d) severe or grade 3 SHFP. Location of SHFP edema is marked by arrows.
Figure 4b:
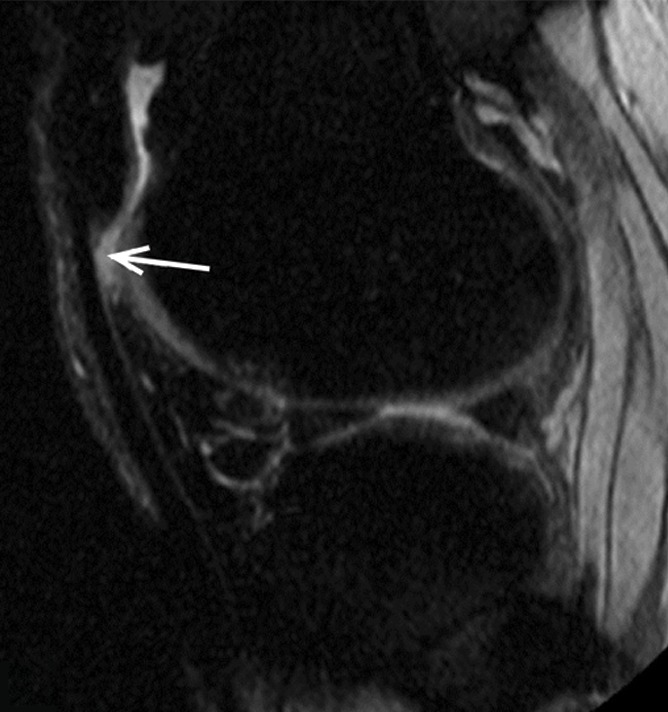
Sagittal MR images of the knee show SHFP scoring system for (a) normal, (b) mild or grade 1, (c) moderate or grade 2, and (d) severe or grade 3 SHFP. Location of SHFP edema is marked by arrows.
Figure 4c:
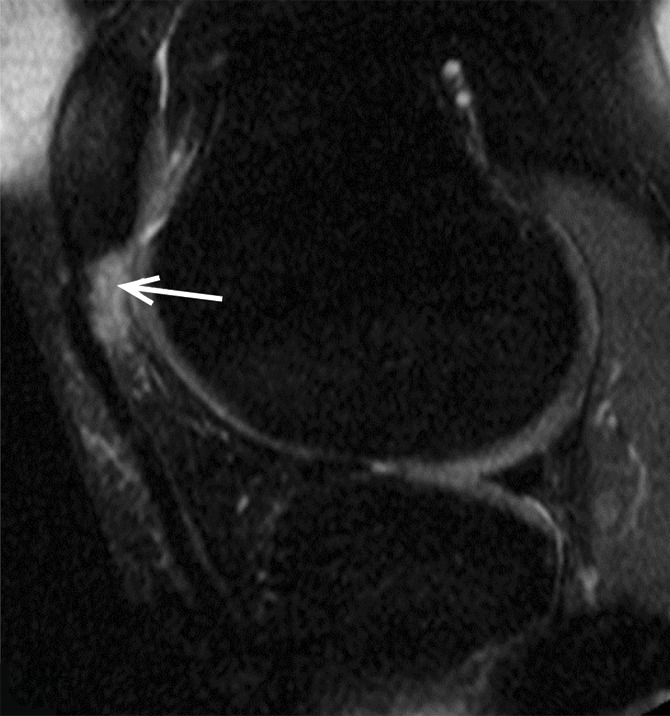
Sagittal MR images of the knee show SHFP scoring system for (a) normal, (b) mild or grade 1, (c) moderate or grade 2, and (d) severe or grade 3 SHFP. Location of SHFP edema is marked by arrows.
Figure 4d:
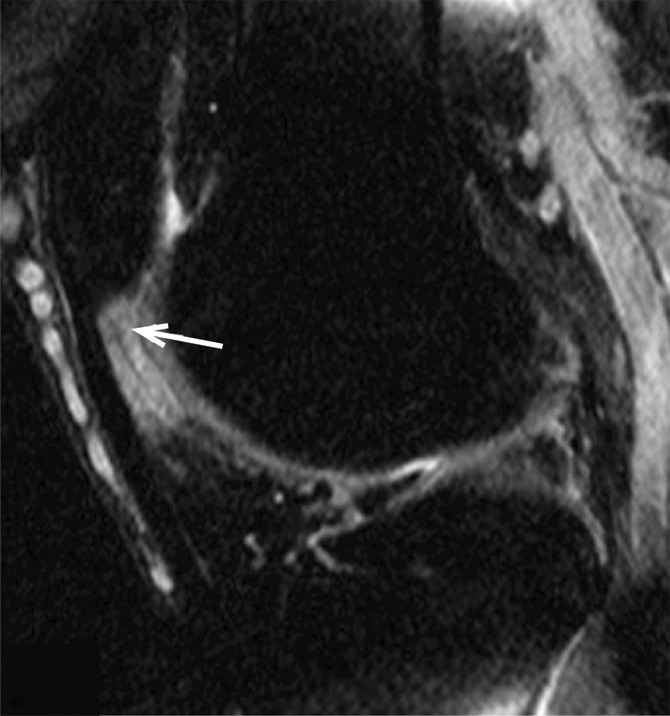
Sagittal MR images of the knee show SHFP scoring system for (a) normal, (b) mild or grade 1, (c) moderate or grade 2, and (d) severe or grade 3 SHFP. Location of SHFP edema is marked by arrows.
In a separate session 60 days after the original assessments were completed, 50 participants’ images were rescored (M.J.) for intrareader reproducibility without knowledge of the original assessments. Another musculoskeletal radiologist (A.G., with 17 years of experience in standardized semiquantitative MR imaging assessments of knee osteoarthritis) assessed 50 knees blinded to M.J.’s readings for interreader reproducibility. Intra- and interreader reliability (weighted κ) (23) for presence of SHFP edema was 1.0 (95% confidence interval [CI]: 1.0, 1.0) and 0.90 (95% CI: 0.7, 1.0), respectively.
Statistical Analysis
We first calculated descriptive statistics for all variables (exposure, outcome, and covariates) used in the study. These statistics were the mean, standard deviation, and range for continuous variables and frequency counts for categorical variables. We also determined the prevalence of SHFP among age (50–59, 60–69, > 69 years), sex (male vs female), and BMI (< 25, 25–30, > 30 kg/m2) categories. To determine the relationship of measures of PFJ alignment and trochlear morphology to SHFP edema, we used separate logistic regression models for each measure of alignment and morphology (exposure variable), adjusting for age, sex, and BMI. PFJ alignment and trochlear morphologic variables were divided into quartiles, and SHFP edema was dichotomized as presence or absence. Because patellar height and trochlear morphology likely influence PFJ alignment, models with bisect offset and patellar tilt angle as the primary exposure were also adjusted for trochlear morphology and ISR. In a separate model, each exposure variable was entered as a continuous variable to assess its linear relationship to SHFP edema (P value for linear trend). All analyses were performed (J.S.) by using software (SAS 9.4; SAS Institute, Cary, NC).
Results
MR images of 1185 subjects were assessed as part of the parent MOST study. In our study, 51 knees were excluded because of poor quality MR images on which trochlear morphology, alignment, and/or SHFP edema could not be determined. Thirty-seven knees were removed because the posterior lateral and medial posterior condyles were two or more sections apart, and we could not draw a horizontal PCL. Eight knees were removed because of large osteophytes that limited our ability to determine the normal osseous anatomy. Six knees were removed because of poor MR image quality and inability to determine SHFP edema. Thus, 1134 knees were included in our analysis. The mean age ± standard deviation was 66.8 years ± 7.6 and mean BMI was 29.6 kg/m2 ± 4.8, and 62.9% of the subjects were women (Table 1). There were no differences in age, sex, and BMI distributions between the original MOST sample population and those included in our study (11). The prevalence of SHFP edema was 13.4% and was more common in women (14.7%) than in men (11.2%). SHFP edema was similar throughout the BMI categories (< 25, 15.4%; 25–30, 13.3%; and > 30, 12.7%) and age categories (50–59, 15.5%; 60–69, 13.2%; > 69, 12.1%).
Table 1.
Descriptive Statistics of Sample Population

Note.—Unless otherwise indicated, data are means ± standard deviation, with the range in parentheses.
*Number in parentheses is the percentage.
†Data are number of knees with SHFP edema, with percentages in parentheses and 95% CI in brackets.
‡Bisect offset indicates percentage of patella lateral to midline.
Compared with those with measurements in the lowest trochlear angle quartile, those with measurements in the highest quartile (eg, lateral trochlear facet most anterior) had 1.6 (95% CI: 1.0, 2.6) times the odds of having SHFP edema (P = .002 for linear trend) (Table 2). We found no association of sulcus angle, lateral trochlear inclination, and medial trochlear inclination angle with SHFP edema. Compared with knees with measurements in the lowest bisect offset quartile, those with measurements in the highest quartile had 2.3 (95% CI: 1.3, 4.0) times the odds of having SHFP edema. There was a strong linear trend for increasing prevalence of SHFP edema throughout all quartiles of bisect offset measures (P ≤ .001 for linear trend) (Table 3). There was no association between patellar tilt angle and SHFP edema. We found the highest quartile of ISR measurements to have the strongest association with SHFP edema. Compared with knees in the lowest quartile, those in the highest had 8.9 (95% CI: 4.7, 16.9) times the odds of having SHFP edema (Table 3). In addition, knees with a moderate increase in ISR (ie, 1.1–1.2) had 3.9 (95% CI: 2.0, 7.5) times the odds of showing SHFP edema compared with those with measurements in the lowest ISR quartile. A strong linear trend was found for increasing prevalence of SHFP edema throughout ISR quartiles (P ≤ .0001 for linear trend).
Table 2.
Association of Trochlear Morphology Measurements according to Quartile with SHFP Edema

Note.—Unless otherwise indicated, data in parentheses are percentages. REF = reference value.
*Data in parentheses are 95% CIs. Odds ratios were adjusted for age, BMI, and sex.
Table 3.
Association of Measurements of PFJ Alignment and ISR according to Quartile with SHFP Edema

Note.—Unless otherwise indicated, data in parentheses are percentages. All odds ratios were adjusted for age, BMI, and sex. REF = reference value.
*Data in parentheses are 95% CIs.
†Also adjusted for ISR and trochlear angle.
Discussion
Our findings indicate that trochlear angle, bisect offset, and ISR were associated with the presence of SHFP edema. A small increase in trochlear angle and bisect offset was not strongly associated with SHFP edema, while knees with measurements in the highest quartiles demonstrated significantly increased odds of SHFP edema. In addition, we found a strong linear trend throughout quartiles of measurements of trochlear angle, bisect offset, and ISR. Knees with patella alta (ISR > 1.2; our highest quartile) demonstrated the strongest relationship to SHFP edema, with almost nine times the odds of having SHFP edema compared with knees with lowest ISR. Our findings suggest that these morphologic and alignment features may allow prediction of the risk of SHFP edema in an older population. From a biologic perspective, it is unlikely that SHFP edema occurs before or causes abnormal trochlear morphology and PFJ malalignment. Therefore, we argue that these abnormal morphologic features and maltracking are likely to cause SHFP edema, because reverse causation is unlikely. We recognize that there may be other factors or morphologic features that we did not measure in this study that may be part of the causal pathway.
Neither sulcus angle nor trochlear inclination angles were associated with SHFP edema. This finding suggests that the flatness of the trochlear groove may not be a risk factor for impingement of the SHFP. Matcuk et al (8) found similar results for sulcus angle (mean, 137.8 and 136.3 in those with SHFP edema and control subjects, respectively; P = .24), but conflicting results for lateral trochlear inclination (mean, 22.1 and 24.4 in those with SHFP edema and control subjects, respectively; P = .02). In their study, they measured morphologic features at 3 cm above the joint line, which was different from our method of measuring PCL. On the other hand, the anterior aspect of the trochlea, measured according to trochlear angle, may be a more important risk factor. Knees with measurements in the highest quartile for trochlear angle, representing a more anterior lateral trochlear facet, had greater odds of showing SHFP edema in our study. Because of the more anterior lateral trochlea in these knees, the fat pad may be more likely to get impinged and lead to SHFP edema. To our knowledge, our study is the first in which trochlear angle as a risk factor for SHFP edema has been investigated.
We found that lateral patellar displacement was associated with SHFP edema, while patellar tilt was not. Authors of previous studies also have found a similar association between bisect offset and SHFP edema, but others found conflicting results with patellar tilt angle (6,7). This may have been due to different methods used to assess patellar tilt and lateral displacement. However, Matcuk et al (8), who used a different method of determining lateral displacement of the patella, found that lateral patellar displacement was associated with SHFP edema as well. On the other hand, Barbier-Brion et al (7), who used the same method for patellar tilt angle but a different method for bisect offset, found that patellar tilt angle had a stronger association with SHFP edema than did bisect offset.
Patella alta has consistently been shown to be related to SHFP edema (4–7) and our findings are consistent with those of previous studies. Authors of these studies compared the prevalence of SHFP edema in knees with and without patella alta by using an ISR of 1.2 as a cut point. In our study, we divided ISRs into quartiles and found that not only did those with patella alta (ISR > 1.2) have increased odds of SHFP edema, but also those with a moderate increase in patellar height (ISR 1.08–1.18) had almost four times the odds of SHFP edema. It is possible that other patellar alignment measures than those used in our study may be associated with SHFP edema. Overall, our findings suggest that a more laterally displaced patella, patella alta, and knees with a more anterior lateral trochlear facet may have greater impingement of the SHFP, leading to SHFP edema.
We found no differences in the prevalence of SHFP edema among age and BMI categories. This result contrasts with those of Campagna et al (5), who found SHFP edema to be more common in younger patients and hypothesized that it was because they were more active (eg, activities with repeated terminal knee extension). Authors of other studies (3,4,6,7,24) did not report or account for age in their analyses. Because our study population included older individuals, it is difficult to compare our results directly with those of other studies. In addition, we also adjusted for sex and BMI, two common covariates included in knee osteoarthritis studies. Our study results concur with those of previous studies in which investigators found SHFP edema to be more common in women.
There were limitations to our study. First, because this was a cross-sectional study, we cannot conclude that the trochlear morphology and patellar malalignment causes SHFP edema. However, we believe reverse causation is unlikely. Second, our measurements were performed on static MR images and we did not assess whether there was impingement of the SHFP during dynamic activities. We also recognize that we do not know the clinical significance (eg, relationship to pain, structural damage in the PFJ or knee replacement) of SHFP edema in older adults with or at risk for knee osteoarthritis.
In summary, in older individuals with or at risk for osteoarthritis of the knee, SHFP edema on MR images is significantly associated with a more anterior-lateral femoral trochlear facet, lateral patellar translation, and increased patellar height. Our findings suggest that SHFP edema can be used as a sign for underlying abnormal morphology or alignment and can help identify those who may be at risk for patellofemoral osteoarthritis.
Advances in Knowledge
■ Superolateral Hoffa fat pad (SHFP) edema was present on MR images of 152 of 1134 (13.4%) subjects aged 50–79 years with or at risk for osteoarthritis of the knee; this prevalence was similar among age, sex, and body mass index categories.
■ Compared with knees with measurements in the lowest quartile, knees with measurements in the highest quartile for trochlear angle, bisect offset, and Insall-Salvati ratio were 1.6 (95% confidence interval [CI]: 1.06, 2.6), 2.3 (95% CI: 1.3, 4.0), and 8.9 (95% CI: 4.7, 16.9) times more likely to have SHFP edema, respectively.
Implication for Patient Care
■ The findings of this study suggest that SHFP edema on MR images can be used as a sign of underlying abnormal morphology and alignment.
Received October 11, 2016; revision requested December 14 and received December 22; accepted January 24, 2017; final version accepted January 31.
J.J.S. supported by the Rheumatology Research Foundation Investigator Award. Study supported by the National Institutes of Health (P60-AR47785, U01-AG18820, U01-AG18832, U01-AG18947, U01-AG19069).
Current address: Department of Radiology, Mercy Catholic Medical Center, Darby, Pa.
A.G. and J.J.S. contributed equally to this work.
Disclosures of Conflicts of Interest: R.W. disclosed no relevant relationships. M.R. disclosed no relevant relationships. M.J. disclosed no relevant relationships. F.W.R. Activities related to the present article: disclosed no relevant relationships. Activities not related to the present article: chief medical officer and shareholder for Boston Imaging Core Lab. Other relationships: disclosed no relevant relationships. T.N. disclosed no relevant relationships. J.A.L. Activities related to the present article: disclosed no relevant relationships. Activities not related to the present article: personal fees from Flexion Therapeutics. Other relationships: disclosed no relevant relationships. C.E.L. disclosed no relevant relationships. J.C.T. disclosed no relevant relationships. D.T.F. Activities related to the present article: disclosed no relevant relationships. Activities not related to the present article: consultancy for Zimmer Knee Creations. Other relationships: disclosed no relevant relationships. A.G. Activities related to the present article: disclosed no relevant relationships. Activities not related to the present article: consultancy for AstraZeneca, GE Healthcare, Genzyme, Merck Serono, OrthoTrophix, Pfizer, and TissueGene; stock/stock options from Boston Imaging Core Lab. Other relationships: disclosed no relevant relationships. J.J.S. disclosed no relevant relationships.
Abbreviations:
- BMI
- body mass index
- CI
- confidence interval
- ISR
- Insall-Salvati ratio
- MOST
- Multicenter Osteoarthritis Study
- PCL
- posterior condylar line
- PFJ
- patellofemoral joint
- SHFP
- superolateral Hoffa fat pad
References
- 1.Hayashi D, Guermazi A, Kwoh CK. Clinical and translational potential of MRI evaluation in knee osteoarthritis. Curr Rheumatol Rep 2014;16(1):391. [DOI] [PMC free article] [PubMed] [Google Scholar]
- 2.Roemer FW, Jarraya M, Felson DT, et al. Magnetic resonance imaging of Hoffa’s fat pad and relevance for osteoarthritis research: a narrative review. Osteoarthritis Cartilage 2016;24(3):383–397. [DOI] [PubMed] [Google Scholar]
- 3.Chung CB, Skaf A, Roger B, Campos J, Stump X, Resnick D. Patellar tendon-lateral femoral condyle friction syndrome: MR imaging in 42 patients. Skeletal Radiol 2001;30(12):694–697. [DOI] [PubMed] [Google Scholar]
- 4.Subhawong TK, Eng J, Carrino JA, Chhabra A. Superolateral Hoffa’s fat pad edema: association with patellofemoral maltracking and impingement. AJR Am J Roentgenol 2010;195(6):1367–1373. [DOI] [PMC free article] [PubMed] [Google Scholar]
- 5.Campagna R, Pessis E, Biau DJ, et al. Is superolateral Hoffa fat pad edema a consequence of impingement between lateral femoral condyle and patellar ligament? Radiology 2012;263(2):469–474. [DOI] [PubMed] [Google Scholar]
- 6.Jibri Z, Martin D, Mansour R, Kamath S. The association of infrapatellar fat pad oedema with patellar maltracking: a case-control study. Skeletal Radiol 2012;41(8):925–931. [DOI] [PubMed] [Google Scholar]
- 7.Barbier-Brion B, Lerais J-M, Aubry S, et al. Magnetic resonance imaging in patellar lateral femoral friction syndrome (PLFFS): prospective case-control study. Diagn Interv Imaging 2012;93(3):e171–e182. [DOI] [PubMed] [Google Scholar]
- 8.Matcuk GR, Jr, Cen SY, Keyfes V, Patel DB, Gottsegen CJ, White EA. Superolateral hoffa fat-pad edema and patellofemoral maltracking: predictive modeling. AJR Am J Roentgenol 2014;203(2):W207–W212. [DOI] [PubMed] [Google Scholar]
- 9.Fernandez-Madrid F, Karvonen RL, Teitge RA, Miller PR, An T, Negendank WG. Synovial thickening detected by MR imaging in osteoarthritis of the knee confirmed by biopsy as synovitis. Magn Reson Imaging 1995;13(2):177–183. [DOI] [PubMed] [Google Scholar]
- 10.Roemer FW, Guermazi A, Zhang Y, et al. Hoffa’s fat pad: evaluation on unenhanced MR images as a measure of patellofemoral synovitis in osteoarthritis. AJR Am J Roentgenol 2009;192(6):1696–1700. [DOI] [PubMed] [Google Scholar]
- 11.Segal NA, Nevitt MC, Gross KD, et al. The Multicenter Osteoarthritis Study: opportunities for rehabilitation research. PM R 2013;5(8):647–654. [DOI] [PMC free article] [PubMed] [Google Scholar]
- 12.Crema MD, Roemer FW, Felson DT, et al. Factors associated with meniscal extrusion in knees with or at risk for osteoarthritis: the Multicenter Osteoarthritis study. Radiology 2012;264(2):494–503. [DOI] [PMC free article] [PubMed] [Google Scholar]
- 13.Multicenter Osteoarthritis Study Operations manual : recruitment and sampling (version 1.0p, May 2009). Multicenter Osteoarthritis Study Website. http://most.ucsf.edu/docs/RecruitSampling1.0pMay2009.pdf. Accessed August 9, 2016.
- 14.Brossmann J, Muhle C, Schröder C, et al. Patellar tracking patterns during active and passive knee extension: evaluation with motion-triggered cine MR imaging. Radiology 1993;187(1):205–212. [DOI] [PubMed] [Google Scholar]
- 15.Delgado-Martínez AD, Rodríguez-Merchán EC, Ballesteros R, Luna JD. Reproducibility of patellofemoral CT scan measurements. Int Orthop 2000;24(1):5–8. [DOI] [PMC free article] [PubMed] [Google Scholar]
- 16.Alemparte J, Ekdahl M, Burnier L, et al. Patellofemoral evaluation with radiographs and computed tomography scans in 60 knees of asymptomatic subjects. Arthroscopy 2007;23(2):170–177. [DOI] [PubMed] [Google Scholar]
- 17.Powers CM, Shellock FG, Pfaff M. Quantification of patellar tracking using kinematic MRI. J Magn Reson Imaging 1998;8(3):724–732. [DOI] [PubMed] [Google Scholar]
- 18.Stefanik JJ, Roemer FW, Zumwalt AC, et al. Association between measures of trochlear morphology and structural features of patellofemoral joint osteoarthritis on MRI: the MOST study. J Orthop Res 2012;30(1):1–8. [DOI] [PMC free article] [PubMed] [Google Scholar]
- 19.Stefanik JJ, Zumwalt AC, Segal NA, Lynch JA, Powers CM. Association between measures of patella height, morphologic features of the trochlea, and patellofemoral joint alignment: the MOST study. Clin Orthop Relat Res 2013;471(8):2641–2648. [DOI] [PMC free article] [PubMed] [Google Scholar]
- 20.Insall J, Salvati E. Patella position in the normal knee joint. Radiology 1971;101(1):101–104. [DOI] [PubMed] [Google Scholar]
- 21.LaValley MP, McLaughlin S, Goggins J, Gale D, Nevitt MC, Felson DT. The lateral view radiograph for assessment of the tibiofemoral joint space in knee osteoarthritis: its reliability, sensitivity to change, and longitudinal validity. Arthritis Rheum 2005;52(11):3542–3547. [DOI] [PubMed] [Google Scholar]
- 22.Hunter DJ, Guermazi A, Lo GH, et al. Evolution of semi-quantitative whole joint assessment of knee OA: MOAKS (MRI Osteoarthritis Knee Score). Osteoarthritis Cartilage 2011;19(8):990–1002. [DOI] [PMC free article] [PubMed] [Google Scholar]
- 23.Cohen J. Weighted kappa: nominal scale agreement with provision for scaled disagreement or partial credit. Psychol Bull 1968;70(4):213–220. [DOI] [PubMed] [Google Scholar]
- 24.De Smet AA, Davis KW, Dahab KS, Blankenbaker DG, del Rio AM, Bernhardt DT. Is there an association between superolateral Hoffa fat pad edema on MRI and clinical evidence of fat pad impingement? AJR Am J Roentgenol 2012;199(5):1099–1104. [DOI] [PubMed] [Google Scholar]