Average regional myocardial function is worse in individuals with greater left ventricle trabeculation.
Abstract
Purpose
To determine if excess greater left ventricle (LV) trabeculation is associated with decreased average regional myocardial function, diffuse fibrosis, or both.
Materials and Methods
This was a HIPAA-compliant institutional board approved multicenter study, and all participants provided written informed consent. Participants in the Multi-Ethnic Study of Atherosclerosis (MESA) underwent a comprehensive cardiac magnetic resonance (MR) examination. LV trabeculation was measured with the maximal apical fractal dimension (FD), which is a marker of endocardial complexity. Demographic covariates, cardiovascular risk factors, and cardiac MR measurements were compared across quartiles of FD. Associations between FD and peak regional systolic circumferential strain (Ecc) and T1 time, a surrogate for diffuse myocardial fibrosis, were assessed with multivariable linear regression models.
Results
A total of 1123 subjects (593 [52.8%] female; mean age, 67.1 years ± 8.7 [standard deviation]) underwent FD and Ecc measurement, and 992 (521 [52.5%] female; mean age, 67.1 years ± 8.7) underwent FD and T1 measurement. Mean FD was 1.2 ± 0.07 in both groups, and mean Ecc was −18.3 ± 2.27 in the subjects who underwent FD and Ecc measurement. Global volumes and ejection fraction showed no differences between FD quartiles. However, with increasing FD quartile, Ecc was greater (indicating worse average regional function) (P < .001). After adjustment, greater trabeculation was associated with 21% worse myocardial strain (relative to the mean) per unit change in FD (regression coefficient = 4.0%; P < .001). There was no association between the degree of trabeculation and diffuse fibrosis measured with T1 mapping.
Conclusion
Average regional LV function was worse in individuals with greater LV trabeculation, supporting the concept of hypertrabeculation being an epiphenomenon of disease.
© RSNA, 2017
Introduction
The trabeculae carneae are a network of slim columns of myocardial cells covered by endocardial cells at the luminal surface of the left ventricle (LV) and right ventricle. During embryonic cardiac development, trabeculae form by invagination of cardiomyocytes into the lumen (1). Trabeculated myocardium increases cardiac output and facilitates oxygen supply prior to coronary vascularization. As the myocardium develops, trabeculae compact, leading to increased thickness of the compact myocardium that represents the major part of the myocardial mass of the mature heart. Simultaneously, coronary vessels develop (1).
Abnormal trabecular compaction is a diagnostic imaging feature of LV noncompaction cardiomyopathy (LVNC), which is a rare primary genetic cardiomyopathy characterized by excess myocardial trabeculation more than twice as thick as the underlying myocardial wall (2). LVNC is associated with heart failure, regional wall motion abnormalities, and myocardial fibrosis (3–11). However, patients without overt cardiovascular disease and with normal cardiac function frequently show excess trabeculation; more than 30% of healthy individuals have a ratio of noncompacted to compacted myocardium greater than 2.3 (12). In such individuals, the clinical importance of excess trabeculation as a sign of current or future disease expression is not currently understood. Mechanistically, it would seem likely that regions of hypertrabeculated myocardium may have lower contractility compared with that in regions of normal myocardium. However, the relationship of hypertrabeculated myocardium to contractile function and fibrosis in individuals without LVNC disease is currently unknown.
Calculation of the ratio of the thickness of noncompacted to compacted myocardium (NCC) is a simple and fast way to quantify trabeculation that is currently the most widely used technique (13). A more comprehensive measure of LV trabeculation can be performed with fractal analysis (14). The fractal dimension (FD) is a unitless index used to assess endocardial complexity (14,15). The maximal FD in the apical half of the LV is higher in patients with LVNC than in healthy volunteers (14). When compared with calculation of NCC, the fractal method has been shown to be more accurate and reproducible (14).
Although the importance of detecting excess trabeculation is reasonably well understood in patients with overt LVNC disease, the importance of this common finding is not understood in individuals who do not have overt clinical cardiomyopathy. Our hypothesis was that myocardial strain is impaired in subjects with greater trabeculation and may be associated with diffuse fibrosis. Thus, the purpose of our study was to determine if excess greater LV trabeculation is associated with decreased average regional myocardial function, diffuse fibrosis, or both.
Materials and Methods
The contrast material used in this study was provided by Bayer Healthcare Pharmaceuticals (Montville, NJ). The authors had control of all data submitted for publication.
Study Participants
This study was approved by the institutional review boards of each of the participating field sites in the United States (Wake Forest Univeristy, Winston-Salem, NC; Columbia University, New York, NY; Johns Hopkins University, Baltimore, Md; University of Minnesota, Minneapolis, Minn; Northwestern University, Evanston, Ill; University of California, Los Angeles), and all participants provided written informed consent. All sites were compliant with the Health Insurance Portability and Accountability Act.
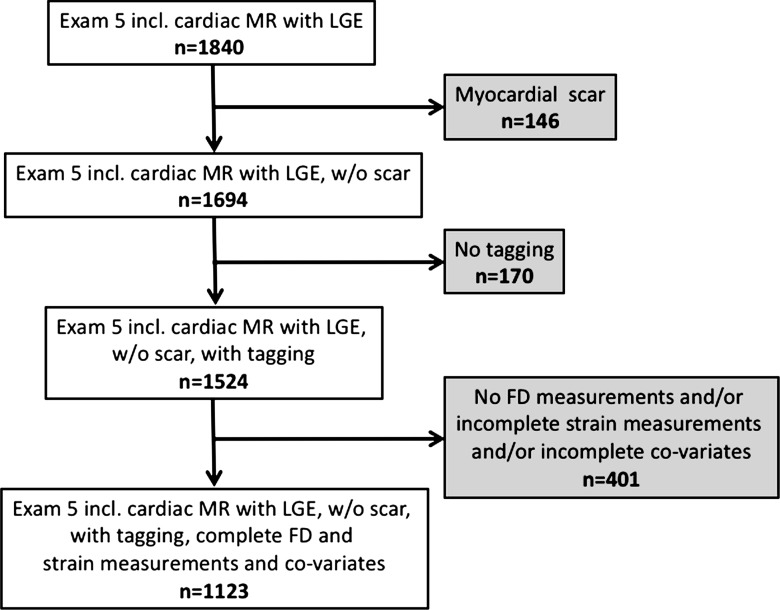
The Multi-Ethnic Study of Atherosclerosis (MESA) is an ongoing population-based longitudinal study that was initiated in July 2000. At enrollment, study participants were free of clinically recognized cardiovascular disease (16). Ten years after baseline examination, 3015 subjects underwent an additional cardiac magnetic resonance (MR) examination, and a subset of these subjects underwent regional function assessment (using MR imaging tagging), late gadolinium enhancement (LGE) imaging, and T1 mapping. Participants with a focal myocardial scar on LGE images were excluded since focal LGE is associated with regional myocardial dysfunction, which would otherwise confound the analysis. In addition, participants with missing data and inadequate MR image quality that hampered analysis also were excluded (Fig 1).
Figure 1:
Flowchart shows participant enrollment. Incl. = including, w/o = without.
In a previous publication (17), the range of FD and its determinants were described in 2547 subjects in the MESA population. The current study focuses on analysis of the relationship between FD and average regional myocardial function and that between FD and diffuse myocardial fibrosis in a subset of these participants.
Cardiovascular MR Imaging
Cardiac MR examinations were performed at the six MESA field centers with 1.5-T MR imagers, as described previously (18,19). In brief, electrocardiographically gated long- and short-axis cine images were acquired by using a steady-state free precession sequence (repetition time msec/echo time msec, 2.2/1.1; temporal resolution, ≤40 msec; 8-mm section thickness; 2-mm section gap; 45°–70° flip angle). Tagged images were obtained with a segmented k-space electrocardiographically gated fast low-angle shot pulse sequence performed in three short-axis sections with two orthogonally oriented parallel striped tags by using spatial modulation of magnetization (3.5–7.2/2.5, 360 × 360 mm field of view, 10° flip angle, 256 × 128 matrix, 10-mm section thickness, nine phase-encoding views per segment, 1.4 × 2.8 × 10.0 mm spatial resolution, 25-msec temporal resolution, 7-mm tag spacing). Participants without contraindications underwent LGE imaging 15 minutes after intravenous bolus injection of gadopentetate dimeglumine (0.15 mmol per kilogram of body weight, Magnevist; Bayer Healthcare Pharmaceuticals) to identify myocardial scar. As described previously (19), T1 mapping sequences included unenhanced and delayed images 12 and 25 minutes after contrast material injection by using a modified Look-Locker sequence consisting of 11 source images in 17 heartbeats (2.2/1.1; 35° flip angle; 360 × 360 mm field of view; 192 × 183 matrix; 8-mm section thickness; generalized autocalibrating partially parallel acquisitions factor, two).
Image Evaluation
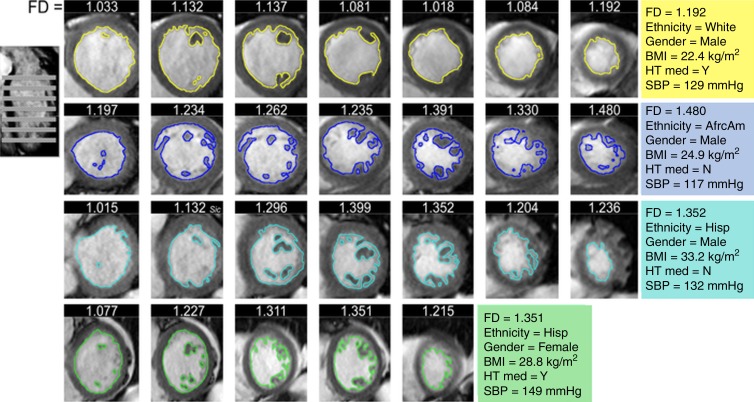
LV volumes and function were measured by using Cardiac Image Modeller software (version 6.2; University of Auckland, Auckland, New Zealand) (20). FD was measured on short-axis cine steady-state free precession images (Fig 2) (G.C., 6 years of experience in cardiac MR imaging), as described previously (17). In brief, after image segmentation to identify the endocardial border, FD of the endocardial border was calculated by using a box counting method. Maximal apical FD was the maximum value derived from the apical half of the LV stack. Thickness of the compact and noncompact (trabeculated) LV myocardium was measured at end diastole on long-axis steady-state free precession images in the middle of eight LV regions (F.Z., N.K.; 6 and 8 years of experience in cardiac MR imaging, respectively) (12). Maximal NCC was calculated as the maximum value of the eight segments in patients in whom measurements were performed for all eight segments.
Figure 2:
Analysis of MR images of FD. FD was measured via fractal analysis of short-axis cine steady-state free precession images in four exemplar subjects from the MESA cohort: one subject with low FD (top) and three subjects with high FD (rows 2, 3, and 4). Colored lines show contouring of endocardial borders. FD indicates how extensively the contour fills two-dimensional space. The image on the left shows planning of the short-axis cine stack. Numbers on top of each short-axis image indicate the FD of the respective section. Colored panels on the right give characteristics of the four subjects. AfrcAm = African American, BMI = body mass index, Hisp = Hispanic, HT med = hypertension medication, N = no, SBP = systolic blood pressure, Y = yes.
T1 mapping data were evaluated by using MASS research software (MASS V2010-EXP; Leiden University Medical Center, Leiden, the Netherlands) (C.Y.L., B.A.; 13 and 12 years of experience in cardiac MR imaging, respectively). Extracellular volume (ECV) was calculated as follows (21):
where
and
Tagged short-axis sections were analyzed by using Harmonic Phase software (Diagnosoft, Palo Alto, Calif) (22). Peak regional systolic circumferential strain (Ecc) was calculated for 12 segments: the anterior, inferior, septal, and lateral segments at the basal, midcavity, and apical levels (23). Mean peak Ecc was calculated as the mean of the 12 segments in patients in whom measurements were performed in all 12 segments. Ecc is a negative value; therefore, lower (more negative) values indicate greater circumferential strain and thus better regional function.
Statistical Analyses
Demographic indexes, cardiovascular risk factors, and cardiac MR measurements of volume and function were evaluated for the entire cohort and were compared across quartiles of FD by using one-way analysis of variance for continuous covariates and the χ2 test for categorical covariates. Continuous variables are presented as mean ± standard deviation, and categorical variables are given as frequencies and percentages.
The missing data approach was complete case analysis, which uses only participants who have all variables observed. To avoid bias when calculating mean Ecc, only those patients in whom it was feasible to measure Ecc in all 12 segments were included.
Associations between the independent variable FD and the dependent variables Ecc, T1 time, and ECV were assessed by using linear regression in univariate and multivariable models per subject. Additionally, regression analysis was performed with NCC instead of FD as an independent variable. Normality of dependent variables was assessed with the Shapiro-Wilk test. Multivariable models were adjusted for demographic covariates (model 1), including age, sex, ethnicity, height, and weight, Additionally, for traditional cardiovascular risk factors (model 2: systolic blood pressure, hypertension, smoking, diabetes mellitus, high-density lipoprotein level, lipid-lowering medication use, and total cholesterol level) and for cardiac MR measures (model 3, LV end-diastolic volume and LV ejection fraction). Models including precontrast T1 time were additionally adjusted for heart rate.
P < .05 was considered to indicate a significant difference. Statistical analysis was performed by using SPSS (version 23; SPSS, Cary, NC) and STATA (version 14.0; STATA, College Station, Tex) statistical software.
Results
Participant Characteristics
Table 1 shows the population characteristics, traditional cardiovascular risk factors, and mean ± standard deviation of cardiac MR variables for subjects included in the analysis of the relationship between trabeculation and strain and that between trabeculation and T1 time. There were no clinically relevant differences in demographics between the subsets of subjects included in the analysis and the 1840 subjects in the MESA 5 cohort who underwent a cardiac MR examination including LGE imaging. Mean FD was 1.2 ± 0.07. Mean NCC was 2.1 ± 0.68. Mean Ecc was −18.3 ± 2.27. Mean T1 times were 974.7 msec ± 42.1 before contrast material administration, 455.3 msec ± 40.0 at 12 minutes after contrast material administration, and 518.8 msec ± 40.2 at 25 minutes after contrast material administration. Mean ECV was 0.27 ± 0.3.
Table 1.
Characteristics of the MESA Study Cohort
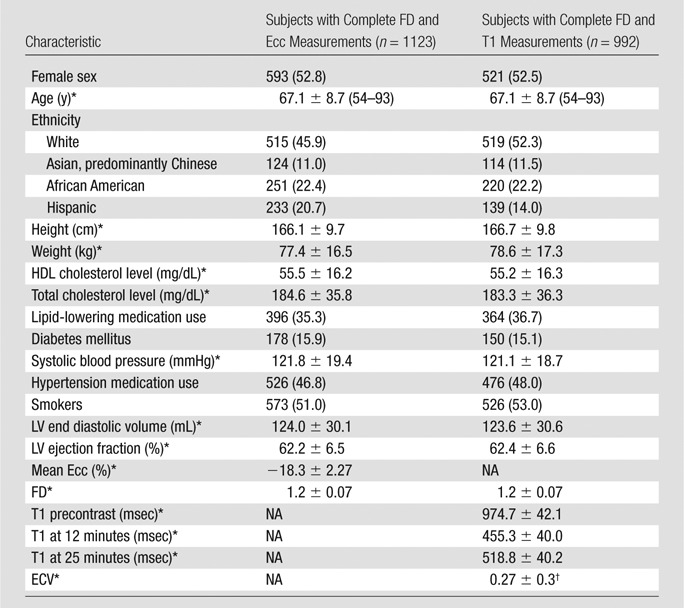
Note.—Unless otherwise indicated, data are number of subjects, with the percentage in parentheses. HDL = high-density lipoprotein, NA = not applicable, T1 precontrast = myocardial T1 time prior to contrast material administration, T1 at 12 minutes = myocardial T1 time 12 minutes after contrast material administration, T1 at 25 minutes = myocardial T1 time 25 minutes after contrast material administration.
*Data are means ± standard deviation.
†n = 544.
A total of 230 (20.5%) of 1123 subjects had an FD of 1.3 or higher, which was considered the threshold for LVNC when using fractal analysis (14). For comparison, 247 (33.2%) of 745 subjects had an NCC greater than 2.3, which was considered the cutoff for LVNC at cardiac MR imaging (13).
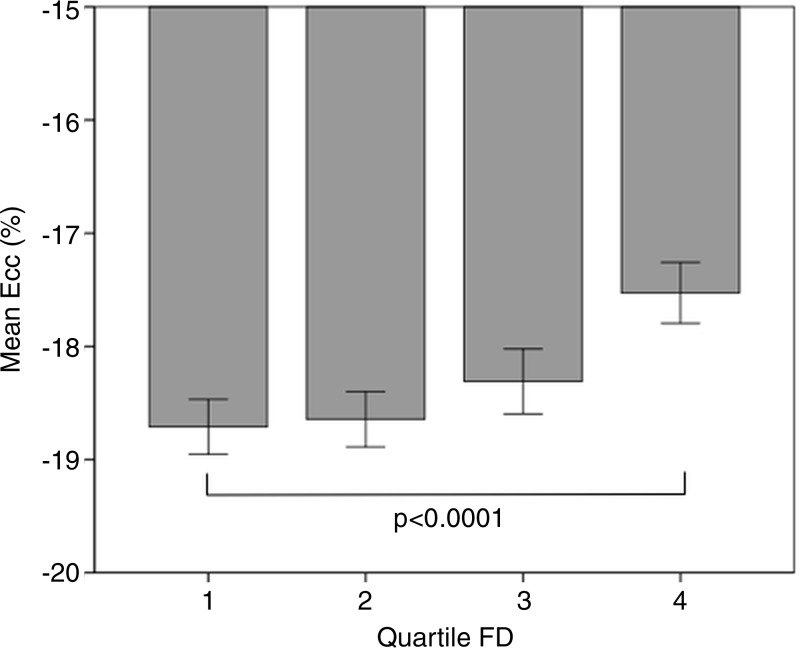
Table 2 shows patient characteristics, traditional risk factors, and cardiac MR measures stratified by FD. Participants with a higher FD were more likely to be male and of African American or Hispanic ethnicity, while the proportion of Asian (predominantly of Chinese descent) participants was higher in the lower quartiles. Subjects in the quartiles with higher FD were taller, had a higher body weight, were more likely to have diabetes, had higher systolic blood pressure on average, and were more likely to be smokers. In quartiles with higher FD, mean high-density lipoprotein cholesterol level tended to be lower. There were no significant differences in LV end diastolic volume and LV ejection fraction between quartiles of FD. Circumferential strain tended to be more positive (indicating worse regional function) with increasing FD quartile (Fig 3).
Table 2.
Characteristics of the MESA Study Cohort for Quartiles of Maximal Apical FD
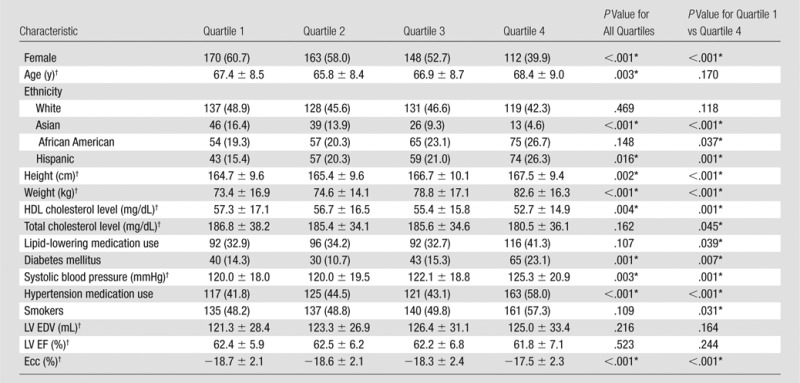
Note.—Unless otherwise indicated, data are number of subjects, with the percentage in parentheses. We had complete data for 1123 subjects. Quartile 1, FD = 1.01–1.15; quartile 2, FD = 1.15–1.12; quartile 3, FD = 1.12–1.24; and quartile 4, FD = 1.24–1.4. EDV = end-diastolic volume, EF = left ventricular ejection fraction, HDL = high-density lipoprotein.
*Difference was significant.
†Data are means ± standard deviation.
Figure 3:
Graph shows circumferential strain by quartiles of FD. Quartile 1, FD = 1.01–1.15; quartile 2, FD = 1.15–1.12; quartile 3, FD = 1.12–1.24; and quartile 4, FD = 1.24–1.4. Error bars indicate the 95% confidence interval.
Relationship between Trabeculation and Circumferential Strain
In univariate analysis, a higher maximal apical FD was associated with more positive peak global circumferential strain (indicating worse average regional function) (regression coefficient [B] = 6.6%, P < .001). The association persisted after adjustment for demographic covariates (B = 4.0%, P < .001) and traditional cardiovascular risk factors (B = 3.6%, P < .001) and after adjustment for cardiac MR measures of LV volume and function (B = 2.8%, P = .002) (Table 3). In the fully adjusted model, age, male sex, weight, diabetes mellitus, and systolic blood pressure also were associated with more positive (worse) circumferential strain (Table 4).
Table 3.
Relationship of Maximal Apical FD to Mean Ecc
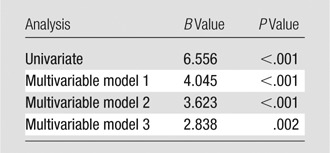
Note.—Dependent variable, Ecc; B, unstandardized regression coefficient indicating the absolute difference in Ecc (%) related to a change of one unit of maximal apical FD. Model 1 was adjusted for age, sex, ethnicity, height, and weight. Model 2 was additionally adjusted for systolic blood pressure, hypertension, smoking, diabetes mellitus, high-density lipoprotein level, lipid-lowering medication use, and total cholesterol level. Model 3 was additionally adjusted for LV end-diastolic volume and LV ejection fraction. For detailed analysis of the relationship between all covariates and circumferential strain, see Table 4.
Table 4.
Relationship of Maximal Apical FD and Covariates to Ecc in the Fully Adjusted Multivariable Model
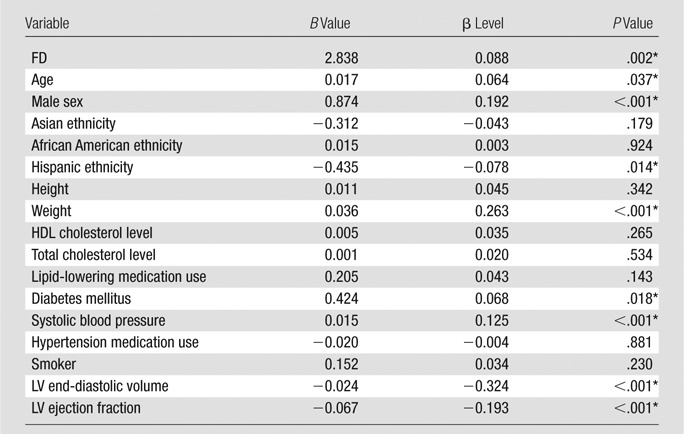
Note.—Dependent variable, Ecc; B, unstandardized regression coefficient indicating the absolute difference in Ecc (%) related to a change of one unit of the independent variables. HDL = high-density lipoprotein.
*Difference was significant.
In an analysis parallel to that performed for FD, in 745 individuals with complete data, there was no relationship between the conventional measure of trabeculation (NCC) in the fully adjusted model (P = .073).
Relationship between FD and T1 Time and between FD and ECV
In univariate analysis and multivariable models (n = 992), maximal apical FD was not associated with unenhanced T1 time, nor was it associated with T1 time at 12 or 25 minutes after contrast material administration. There was no association of FD with ECV persisting in multivariable analysis.
NCC was not associated with unenhanced or contrast-enhanced T1 times (n = 650) or ECV (n = 372) (P > .05 for all).
Discussion
Steady-state free precession cine cardiac MR images readily depict variations in the degree of trabeculation of the LV. In patients with genetic LVNC disease, the degree of trabeculation seems to be related to disease severity. By using fractal analysis, we have shown that average regional myocardial function is worse in subjects with greater LV trabeculation. Interestingly, greater trabeculation was not associated with diffuse myocardial fibrosis, as measured by alteration in T1 time. These results suggest a mechanical link between LV trabeculation and the effectiveness of myocardial function.
Relationship between LV Trabeculation and Average Regional Myocardial Function
The present study supports the hypothesis that LV function is at least in part dependent on the degree of trabeculated myocardium. In the MESA cohort, subjects with highly trabeculated LV myocardium had worse average regional function. This relationship was found even after adjustment for demographic and clinical factors and global LV function. Of interest, greater NCC did not enable us to detect these relationships. This supports accumulating evidence that, although NCC is easy to measure in the clinic, it is not specific (33.2% [247 of 745] of subjects in the MESA cohort with NCC > 2.3). In addition, NCC is a one-dimensional measurement at a single point in the LV that does not comprehensively describe myocardial trabeculation. FD reflects myocardial complexity in a region of the myocardium in a fashion similar to the concept of average regional myocardial strain.
Zemrak et al (24) found that subjects with an abnormal NCC had no deterioration of ejection fraction in the prior 10 years. However, it is well known that ejection fraction can be normal while myocardial strain is impaired (eg, as in the case of heart failure with preserved ejection fraction). It remains unknown if a subject with hypertrabeculation and impaired strain will subsequently develop deterioration of global function and clinical symptoms or if myocardial dysfunction will remain stable and subclinical.
In this cohort, average FD in the myocardial apex was 1.2. Captur et al (14) previously reported patients with LVNC disease have an FD greater than 1.3, indicating small changes in FD may be clinically meaningful. Similarly, myocardial strain is a sensitive measure of LV function, and strain is highly conserved in healthy subjects (25). In the current study, the mean circumferential strain was −18.3%. In our unadjusted analysis, a 0.1-unit increase in FD was associated with an absolute increase of 0.6% strain or approximately 3% of the mean value. Our sample size was sufficient to account for 14 additional variables that might affect regional function in multivariable models. Even in fully adjusted models, the association of greater trabeculation with worse average regional function remained significant. Not surprisingly, less sensitive measures of trabeculation and function (NCC and ejection fraction, respectively) did not reveal these associations.
Relationship between LV Trabeculation and Measures of Diffuse Myocardial Fibrosis
In previous publications, focal myocardial fibrosis has been described as a feature of LVNC (4,5,8,10). Besides these reports of focal fibrosis or scars in patients with LVNC, Jenni et al (26) revealed interstitial fibrosis as a finding in six of seven hearts with a diagnosis of LVNC. Zhou et al (27) recently reported subjects with a diagnosis of LVNC had a significantly longer native T1 time (used as surrogate of diffuse myocardial fibrosis) than did healthy volunteers, independent of the presence of LGE.
In this context, our aim was to investigate the relationship between extent of trabeculation and diffuse myocardial fibrosis by using T1 time and ECV, respectively, measured with cardiac MR imaging as a surrogate. However, in our subset of study participants without known cardiovascular disease at enrollment, there was no association between trabeculation and native or contrast-enhanced T1 time or ECV.
Participants in our population-based study had a broad spectrum of trabeculation. The FD in the highest quartile was between 1.24 and 1.45. A total of 230 (20.5%) of the 1123 subjects had an FD of 1.3 or greater, previously defined as the threshold for LVNC, and 247 (33.2%) of 745 had an NCC greater than 2.3, still widely used as a cutoff for LVNC at cardiac MR imaging. This discrepancy is explained by a lack of diagnostic criteria for an LVNC with high specificity. The current criteria focus on thickness or amount of trabeculation. Given the overlap with normal population and the results of this study, improved LVNC criteria may incorporate some measurement of systolic function (28) or morphologic criteria, such as the presence of a layer of tissue between the noncompacted myocardium and the ventricular cavity (29). The current study shows once more that revision of the current criteria is required to distinguish between LVNC disease as a genetic disorder and morphologically hypertrabeculated LV.
A limitation of this study was the cross-sectional design, which precluded a causal interpretation of the results. It remains unclear if hypertrabeculation leads to a deterioration of average regional function or if increased trabeculation might be an adaptive process resulting from impaired function. The latter would be of biologic interest, as it would suggest that LV trabecular patterning imprinted at birth is modulated throughout life as a consequence of cardiac loading and other hemodynamic conditions. The present data indicate that hypertrabeculation might be an epiphenomenon of disease associated with impaired average regional function.
Advances in Knowledge
■ In the Multi-Ethnic Study of Atherosclerosis (MESA) cohort, greater trabeculation of the left ventricle (LV) is associated with worse myocardial strain (regression coefficient = 4.0% per unit fractal dimension [FD] increase in trabeculation, P < .001).
■ In the MESA cohort, greater LV trabeculation is not associated with myocardial fibrosis as measured with native and contrast material—enhanced T1 mapping cardiac MR imaging.
Implications for Patient Care
■ A total of 230 (21%) MESA participants have excess LV trabeculation exceeding the current diagnostic threshold for LV noncompaction disease when using fractal analysis with an FD cutoff of 1.3 or more.
■ Excess greater LV trabeculation is associated with decreased average regional myocardial function, as measured by myocardial strain.
Acknowledgments
Acknowledgment
The authors thank the other investigators, the staff, and the participants of the MESA study for their valuable contributions. A full list of participating MESA investigators and institutions can be found at www.mesa-nhlbi.org.
Received September 3, 2016; revision requested November 21; revision received January 1, 2017; accepted January 13; final version accepted January 31.
Supported by the National Heart, Lung, and Blood Institute (N01-HC-95159, N01-HC-95160, N01-HC-95161, N01-HC-95162, N01-HC-95163, N01-HC-95164, N01-HC-95165, N01-HC-95166, N01-HC-95167, N01-HC-95168, N01-HC-95169), National Center for Research Resources (UL1-TR-000040, UL1-TR-001079), National Institute for Health Research Rare Diseases Translational Research Collaboration (171603), University College London Hospitals NIHR Biomedical Research Centre, and Biomedical Research Unit at Barts Hospital.
Disclosures of Conflicts of Interest: N.K. disclosed no relevant relationships. R.L.M. disclosed no relevant relationships. F.Z. disclosed no relevant relationships. G.C. disclosed no relevant relationships. W.G.H. Activities related to the present article: disclosed no relevant relationships. Activities not related to the present article: received a grant or research support from Prova, Albus, Bracco, and Siemens; is a stock shareholder or owner of Prova and Albus. Other relationships: disclosed no relevant relationships. C.Y.L. disclosed no relevant relationships. J.C.M. disclosed no relevant relationships. S.E.P. disclosed no relevant relationships. B.A. disclosed no relevant relationships. J.A.C.L. disclosed no relevant relationships. D.A.B. disclosed no relevant relationships.
Abbreviations:
- Ecc
- peak regional systolic circumferential strain
- ECV
- extracellular volume
- FD
- fractal dimension
- LGE
- late gadolinium enhancement
- LV
- left ventricle
- LVNC
- LV noncompaction cardiomyopathy
- MESA
- Multi-Ethnic Study of Atherosclerosis
- NCC
- ratio of noncompacted to compacted myocardium
References
- 1.Samsa LA, Yang B, Liu J. Embryonic cardiac chamber maturation: trabeculation, conduction, and cardiomyocyte proliferation. Am J Med Genet C Semin Med Genet 2013;163C(3):157–168. [DOI] [PMC free article] [PubMed] [Google Scholar]
- 2.Maron BJ, Towbin JA, Thiene G, et al. Contemporary definitions and classification of the cardiomyopathies: an American Heart Association Scientific Statement from the Council on Clinical Cardiology, Heart Failure and Transplantation Committee; Quality of Care and Outcomes Research and Functional Genomics and Translational Biology Interdisciplinary Working Groups; and Council on Epidemiology and Prevention. Circulation 2006;113(14):1807–1816. [DOI] [PubMed] [Google Scholar]
- 3.Bellavia D, Michelena HI, Martinez M, et al. Speckle myocardial imaging modalities for early detection of myocardial impairment in isolated left ventricular non-compaction. Heart 2010;96(6):440–447. [DOI] [PMC free article] [PubMed] [Google Scholar]
- 4.Burke A, Mont E, Kutys R, Virmani R. Left ventricular noncompaction: a pathological study of 14 cases. Hum Pathol 2005;36(4):403–411. [DOI] [PubMed] [Google Scholar]
- 5.Dursun M, Agayev A, Nisli K, et al. MR imaging features of ventricular noncompaction: emphasis on distribution and pattern of fibrosis. Eur J Radiol 2010;74(1):147–151. [DOI] [PubMed] [Google Scholar]
- 6.Kalapos A, Domsik P, Forster T, Nemes A. Left ventricular strain reduction is not confined to the noncompacted segments in noncompaction cardiomyopathy: insights from the three-dimensional speckle tracking echocardiographic MAGYAR-path study. Echocardiography 2014;31(5):638–643. [DOI] [PubMed] [Google Scholar]
- 7.Niemann M, Liu D, Hu K, et al. Echocardiographic quantification of regional deformation helps to distinguish isolated left ventricular non-compaction from dilated cardiomyopathy. Eur J Heart Fail 2012;14(2):155–161. [DOI] [PubMed] [Google Scholar]
- 8.Nucifora G, Aquaro GD, Pingitore A, Masci PG, Lombardi M. Myocardial fibrosis in isolated left ventricular non-compaction and its relation to disease severity. Eur J Heart Fail 2011;13(2):170–176. [DOI] [PubMed] [Google Scholar]
- 9.Pacileo G, Baldini L, Limongelli G, et al. Prolonged left ventricular twist in cardiomyopathies: a potential link between systolic and diastolic dysfunction. Eur J Echocardiogr 2011;12(11):841–849. [DOI] [PubMed] [Google Scholar]
- 10.Wan J, Zhao S, Cheng H, et al. Varied distributions of late gadolinium enhancement found among patients meeting cardiovascular magnetic resonance criteria for isolated left ventricular non-compaction. J Cardiovasc Magn Reson 2013;15:20. [DOI] [PMC free article] [PubMed] [Google Scholar]
- 11.Wang C, Deng YB, Zhu Y, Liu YN, Bi XJ. Evaluation of subtle myocardial noncompaction by contrast echocardiography in patients with hypertrophic cardiomyopathy and its relationship with regional ventricular systolic dysfunction. J Ultrasound Med 2012;31(10):1551–1557. [DOI] [PubMed] [Google Scholar]
- 12.Kawel N, Nacif M, Arai AE, et al. Trabeculated (noncompacted) and compact myocardium in adults: the multi-ethnic study of atherosclerosis. Circ Cardiovasc Imaging 2012;5(3):357–366. [DOI] [PMC free article] [PubMed] [Google Scholar]
- 13.Petersen SE, Selvanayagam JB, Wiesmann F, et al. Left ventricular non-compaction: insights from cardiovascular magnetic resonance imaging. J Am Coll Cardiol 2005;46(1):101–105. [DOI] [PubMed] [Google Scholar]
- 14.Captur G, Muthurangu V, Cook C, et al. Quantification of left ventricular trabeculae using fractal analysis. J Cardiovasc Magn Reson 2013;15:36. [DOI] [PMC free article] [PubMed] [Google Scholar]
- 15.Captur G, Karperien AL, Li C, et al. Fractal frontiers in cardiovascular magnetic resonance: towards clinical implementation. J Cardiovasc Magn Reson 2015;17(1):80. [DOI] [PMC free article] [PubMed] [Google Scholar]
- 16.Bild DE, Bluemke DA, Burke GL, et al. Multi-Ethnic Study of Atherosclerosis: objectives and design. Am J Epidemiol 2002;156(9):871–881. [DOI] [PubMed] [Google Scholar]
- 17.Captur G, Zemrak F, Muthurangu V, et al. Fractal analysis of myocardial trabeculations in 2547 study participants: multi-ethnic study of atherosclerosis. Radiology 2015;277(3):707–715. [DOI] [PMC free article] [PubMed] [Google Scholar]
- 18.Donekal S, Venkatesh BA, Liu YC, et al. Interstitial fibrosis, left ventricular remodeling, and myocardial mechanical behavior in a population-based multiethnic cohort: the Multi-Ethnic Study of Atherosclerosis (MESA) study. Circ Cardiovasc Imaging 2014;7(2):292–302. [DOI] [PMC free article] [PubMed] [Google Scholar]
- 19.Liu CY, Liu YC, Wu C, et al. Evaluation of age-related interstitial myocardial fibrosis with cardiac magnetic resonance contrast-enhanced T1 mapping: MESA (Multi-Ethnic Study of Atherosclerosis). J Am Coll Cardiol 2013;62(14):1280–1287. [DOI] [PMC free article] [PubMed] [Google Scholar]
- 20.Young AA, Cowan BR, Thrupp SF, Hedley WJ, Dell’Italia LJ. Left ventricular mass and volume: fast calculation with guide-point modeling on MR images. Radiology 2000;216(2):597–602. [DOI] [PubMed] [Google Scholar]
- 21.Arheden H, Saeed M, Higgins CB, et al. Reperfused rat myocardium subjected to various durations of ischemia: estimation of the distribution volume of contrast material with echo-planar MR imaging. Radiology 2000;215(2):520–528. [DOI] [PubMed] [Google Scholar]
- 22.Garot J, Bluemke DA, Osman NF, et al. Fast determination of regional myocardial strain fields from tagged cardiac images using harmonic phase MRI. Circulation 2000;101(9):981–988. [DOI] [PubMed] [Google Scholar]
- 23.Donekal S, Ambale-Venkatesh B, Berkowitz S, et al. Inter-study reproducibility of cardiovascular magnetic resonance tagging. J Cardiovasc Magn Reson 2013;15:37. [DOI] [PMC free article] [PubMed] [Google Scholar]
- 24.Zemrak F, Ahlman MA, Captur G, et al. The relationship of left ventricular trabeculation to ventricular function and structure over a 9.5-year follow-up: the MESA study. J Am Coll Cardiol 2014;64(19):1971–1980. [DOI] [PMC free article] [PubMed] [Google Scholar]
- 25.Moore CC, Lugo-Olivieri CH, McVeigh ER, Zerhouni EA. Three-dimensional systolic strain patterns in the normal human left ventricle: characterization with tagged MR imaging. Radiology 2000;214(2):453–466. [DOI] [PMC free article] [PubMed] [Google Scholar]
- 26.Jenni R, Oechslin E, Schneider J, Attenhofer Jost C, Kaufmann PA. Echocardiographic and pathoanatomical characteristics of isolated left ventricular non-compaction: a step towards classification as a distinct cardiomyopathy. Heart 2001;86(6):666–671. [DOI] [PMC free article] [PubMed] [Google Scholar]
- 27.Zhou H, Lin X, Fang L, et al. Characterization of compacted myocardial abnormalities by cardiac magnetic resonance with native T1 mapping in left ventricular non-compaction patients: a comparison with late gadolinium enhancement. Circ J 2016;80(5):1210–1216. [DOI] [PubMed] [Google Scholar]
- 28.Captur G, Syrris P, Obianyo C, Limongelli G, Moon JC. Formation and malformation of cardiac trabeculae: biological basis, clinical significance, and special yield of magnetic resonance imaging in assessment. Can J Cardiol 2015;31(11):1325–1337. [DOI] [PubMed] [Google Scholar]
- 29.Freedom RM, Yoo SJ, Perrin D, Taylor G, Petersen S, Anderson RH. The morphological spectrum of ventricular noncompaction. Cardiol Young 2005;15(4):345–364. [DOI] [PubMed] [Google Scholar]


