

Abstract
Traumatic brain injury (TBI) results in learning and memory dysfunction. Cognitive deficits result from cellular and metabolic dysfunction after injury, including decreased cerebral glucose uptake and inflammation. This study assessed the ability of intranasal insulin to increase cerebral glucose uptake after injury, reduce lesion volume, improve memory and learning function and reduce inflammation. Adult male rats received a controlled cortical impact (CCI) injury followed by intranasal insulin or saline treatment daily for 14 days. PET imaging of [18F]-FDG uptake was performed at baseline and at 48 h and 10 days post-injury and MRI on days three and nine post injury. Motor function was tested with the beam walking test. Memory function was assessed with Morris water maze. Intranasal insulin after CCI significantly improved several outcomes compared to saline. Insulin-treated animals performed better on beam walk and demonstrated significantly improved memory. A significant increase in [18F]-FDG uptake was observed in the hippocampus. Intranasal insulin also resulted in a significant decrease in hippocampus lesion volume and significantly less microglial immunolabeling in the hippocampus. These data show that intranasal insulin improves memory, increases cerebral glucose uptake and decreases neuroinflammation and hippocampal lesion volume, and may therefore be a viable therapy for TBI.
Keywords: Glucose uptake, intranasal insulin, microglia, positron emission tomography, traumatic brain injury
Introduction
Traumatic brain injury (TBI) is a serious public health concern that results in long-term cognitive deficits for which there is no current treatment.1 TBI results in a triphasic metabolic response: an initial hypermetabolic state, a significant reduction in cerebral glucose uptake and a slow increase over time back to normal glycemic uptake values.2 A chronic state of reduced cerebral glucose uptake is directly correlated with negative long-term patient outcome.2–4
This metabolic response has been examined in animal studies using several methods including microdialysis of metabolic byproducts and in vivo positron emission tomography (PET) imaging.5,6 Byproducts of metabolism include lactate and pyruvate, which can give information about CMRglc; [18F]-FDG PET imaging shows the accumulation of glucose in specific regions of the brain. These methodologies contribute to the body of knowledge that shows a period of hypermetabolism acutely after injury followed by a significant reduction in metabolic function which is not solely a product of ischemia.5 The reduction in glucose uptake chronically after injury is often attributed to neuronal cell death.2,7
The brain consumes 60% of the body’s total glucose, and it is thought that this is primarily used to maintain membrane potential and for neurotransmitter production.8 Glucose relies on the presence of GLUTs in the membrane for its facilitated diffusion into cells.9,10 GLUT membrane translocation in the periphery is primarily dictated by the presence of insulin; insulin in the brain promotes metabolism, glycogen synthesis, neurotransmitter synthesis, cell survival and proliferation (for review, see11,12). Together, these effects of insulin in the brain are thought to significantly promote learning and memory function.13
The movement of insulin into the brain, like many substrates, is limited and tightly regulated by transporter expression on the BBB.14 Therefore, systemic insulin administration with the goal of increasing glucose uptake in the brain is limited by its ability to pass the BBB and carries the risk of inducing hypoglycemia. Intranasal administration of insulin to the brain bypasses the BBB by using olfactory and trigeminal neurons that pass through the cribriform plate.15–17 Intranasal insulin administration has been shown to promote glucose uptake, cognitive function, and verbal memory in memory impaired adults.18 Intranasal insulin has also been shown to reverse age-related cognitive deficits in the Morris water maze task, a test of memory.19 Additionally, one study has shown that intranasal insulin administration in a model Alzheimer’s disease to improve memory function, increase synaptic proteins, and significantly reduce the presence of pro-inflammatory microglia in the brain.20 Taken together, these data suggest that intranasal insulin is an appropriate therapy to increase glucose uptake after brain injury and improve cognitive function.
This study therefore examined the efficacy of intranasal insulin to increase cerebral glucose uptake after injury, improve motor and cognitive function and reduce the pathological effects of controlled cortical impact (CCI) injury in adult male Sprague Dawley rats.
Materials and methods
Study design
The study includes three cohorts of adult male Sprague Dawley rats (Taconic, Germantown, NY 250–400 g). Cohorts are outlined in Table 1. All animals were weighed prior to injury and regularly throughout the course of the study. The first cohort received a moderate CCI or no injury and intranasal insulin or vehicle treatment followed by motor and cognitive testing and assessment of tissue at 21 days post injury (see Figure 1(a) for a timeline). This cohort included four groups: (1) moderate CCI with intranasal insulin treatment (n = 9), (2) moderate CCI with saline treatment (n = 10), (3) uninjured with insulin treatment (n = 6), and (4) uninjured with saline treatment (n = 6). Treatment groups were randomly assigned and the experimenter was blinded to treatment. Two animals in the uninjured saline cohort received only isoflurane exposure without intranasal saline but were not found to be different than the saline treated and their results were grouped with the rest of the group. A sub-group of this cohort (n = 10; n = 5/group moderate CCI with intranasal insulin or saline) received PET/CT scans with [18F]-FDG at prior to injury and 2 and 10 days post injury. Of these PET animals, six of these animals (n = 3/group moderate CCI with intranasal insulin or saline) underwent magnetic resonance imaging (MRI) scan at three and nine days post injury. The second cohort (n = 4) received a moderate CCI and was treated with intranasal [125I] insulin 4 h after injury. This group was euthanized 15 min after the conclusion of treatment. The third cohort (n = 4/per group) received a moderate CCI and intranasal insulin or saline treatment with blood glucose testing at baseline, 4 h after injury/immediately before treatment and 3 h after treatment. This group was euthanized after the final blood glucose sample. For all studies, animals were dual housed on standard wood chip bedding. Bedding was changed to diamond soft for the week following injury. Animals were given free access to food and water and a 12-h light/12-h dark cycle. Animal baseline weight was obtained prior to injury and weight was monitored throughout the course of the study. All experiments complied fully with the principles set forth in the “Guide for the Care and Use of Laboratory Animals” and were approved by the Uniformed Services University IACUC. Experiments were reported based on ARRIVE guidelines.
Table 1.
Animal cohorts and experimental outcomes.
| Cohort | Groups | Experimental outcomes |
|---|---|---|
| 1 | (1) CCI with intranasal insulin (n = 9) (2) CCI with intranasal saline (n = 10) (3) Uninjured with intranasal insulin (n = 6) (4) Uninjured with intranasal saline (n = 6) | Morris water maze Beam walking/peg board task Lesion volume IBA1 and GFAP PET with [18F]-FDG MRI |
| 2 | (1) CCI with intranasal [125I] insulin (n = 4) | Quantification of [125I]-insulin distribution in brain |
| 3 | (1) CCI with intranasal insulin (n = 4) (2) CCI intranasal saline (n = 4) | Blood glucose testing at baseline, post-injury and 3 h after treatment |
Figure 1.

Intranasal insulin delivery after CCI acts primarily in the CNS. The timeline displays times at which animals underwent surgery, behavior training, PET/CT imaging, and sacrifice.(a) The dose of intranasal insulin given was not sufficient to cause a significant change in blood glucose following CCI in intranasal insulin-treated animals (n = 4) compared to saline-treated injured controls (n = 4) as measured by tail vein blood draws at baseline, after injury/immediately prior to treatment and 3 h after treatment.(b) There was also no effect of intranasal insulin on body weight, measured through 21 days post-injury with 14 days of daily administration (n = 7/group injured n = 4/group uninjured; (c). CCI injury does not inhibit the pathway of intranasal administration to brain regions. (d) There was no significant difference between the ipsilateral and contralateral brain region and insulin was detected in the olfactory bulb, cerebellum, brain stem, hippocampus, and cortex 45 min after administration (n = 4). Data are represented as mean ± SEM.
Moderate TBI
Moderate CCI was performed as previously described.21 Briefly, rats were anesthetized with isoflurane (4% induction, 2.5% maintenance) and temperature was measured rectally and maintained at 36.5–37.5℃. The animal was placed in a standard rodent stereotaxic frame and positioned using ear and incisor bars. A 5-mm circular craniotomy was performed over the left motor cortex at −2.5 mm lateral and −3.0 mm posterior from Bregma. Following the craniotomy, the CCI device (Impact One™, Leica Microsystems, Buffalo Grove, IL) with a 3-mm flat impactor tip was placed in the center of the craniotomy site and a moderate injury was induced with 5 m/s speed, 200 ms dwell time, and 2 mm deformation depth. The skull flap removed in the craniotomy was not replaced after injury. The incision site was closed with surgical staples or sutures if the animal was receiving a PET/CT scan. Animals were placed in a heated chamber and monitored after injury until anesthesia effects had worn off and the animal was returned to home cage.
Intranasal insulin treatment
Humulin R-100 insulin (6 IU per daily treatment, Eli Lilly, Indianapolis, IN) or an equal volume of saline (60 µL) was administered to the nasal cavity using a 10-µL pipettor dose based on previous research.22 Animals were placed in a supine position in an anesthesia chamber, while drug was administered in 6 µL droplets to alternating nares with each administration occurring 2 min apart. The first dose was administered 4 h post-injury and continued daily for 14 days. Animals were anesthetized during treatment with 2.5% isoflurane and temperature was maintained using a heating pad. Treatment groups were randomly assigned using a block randomization approach with almost an even number of control and treatment rats represented in each block. Treatment groups were randomized and the experimenter was blinded to treatment.
Intranasal administration of [125I] insulin
Four hours after injury, rats were anesthetized with 2.5% isoflurane and received approximately 10 μCi of insulin intranasally. A 50 μCi lot of [125I] insulin (Perkin Elmer, specific activity = 2200 Ci/mmol 378.8 μCi/µgl, molecular weight = 5931.6) powder was aliquoted in equal volumes (125 µL) of Humulin R (Eli Lilly) and sterile saline. This dilution allowed for the delivery of approximately 10 µCi of insulin in 50 µL (10, 5 µL drops administered to alternating nares, 2 min apart). Following the final dose, the animal remained in a supine position for 15 min under anesthesia before euthanasia (sodium pentobarbital Euthasol solution, 0.1 ml/g) followed by transcardial perfusion with 1 × PBS. The brain was then divided into the ipsilateral and contralateral hemispheres and the following regions were collected: cortex, hippocampus, olfactory bulb, brainstem, and cerebellum. A gamma counter (Perkin Elmer, Model WALLAC Wizard 3″ 1480-011) was used to calculate total radioactive content of each brain region. Samples were weighed and radioactivity was calculated by normalization to sample weight, calculation of specific activity of control and gamma counter efficiency (82%).
Blood glucose
Blood glucose levels were obtained via tail vein blood using an Accu Chek Aviva Plus blood glucose system (Roche Diagnostics, USA) in non-fasted rats anesthetized with 2.5% isoflurane. A baseline blood glucose level was obtained prior to injury. Animals received a moderate CCI and one treatment of intranasal insulin 4 h after injury. Blood glucose was collected immediately before beginning treatment. Three hours after treatment, a final blood glucose level was obtained.
Beam walking assay
Animals were trained for three days prior to injury on a beam/peg board walking motor function test as previously described.23 Briefly, rats were trained to walk across beams of decreasing width (4, 3, 2, and 1 cm) and a pegboard, a 2-cm wide board with circular pegs projecting from the top, to return to their home cage (as previously described24). Time to cross the beam/peg board and number of footfalls were measured at baseline, and at 1, 7, 14 and 21 days post injury by an investigator blinded to group. The post-injury measurements were averaged for each trial and compared to baseline values collected. Animals were tested on beam/peg board walking assay immediately before treatment as to avoid adverse residual effects of isoflurane exposure.
Morris water maze
Animals in the second cohort underwent testing in the Morris water maze with minor modifications to the protocol as described by Morris et al.25 on days 11–14 post injury. Animals were tested immediately before treatment as to avoid adverse residual effects of isoflurane exposure. The testing paradigm included four training sessions on four consecutive days during which the animal was placed in each of the four quadrants of the pool and had 60 s to locate a hidden platform located in the Northwest quadrant of the pool. Four large visual cues were posted outside of the pool to guide the subject to the correct quadrant. Animals that did not find the platform within the 60-s window were directed to it at the end of the trial. One hour after the training session on the fourth day, animals underwent the probe trial. In this trial, the platform was removed from the pool and animals were placed in the pool for 60 s. Data were collected using AnyMaze™ Video Tracking System version 4.70 (Stoelting Co. Wood Dale IL). Swim speed and latency to platform were collected. Island crosses during the probe trial were counted by a blinded investigator with the requirement that the head of the rat must pass through the island region to count as a cross. Search strategy analysis was conducted on traces collected during the probe trial by two blinded experimenters using a scoring method previously described.26
PET/CT with [18F]-FDG imaging
Serial [18F]-FDG PET/CT scans were obtained in 10 rats (n = 5/group; CCI with intranasal insulin or saline) prior to injury (baseline) and at 2 and 10 days post injury. Animals were scanned within 3 h of their treatment on that day. PET and CT images were acquired using an Inveon multimodality preclinical scanner (Siemens Medical Solutions, Erlangen, Germany) in the small-animal PET/CT facility of the Translational Imaging Core, Center for Neuroscience and Regenerative Medicine, Uniformed Services University. Under 1–2% isoflurane anesthesia in oxygen at 2 L/min, rats were injected with 1.5–2 mCi [18F]-FDG via the lateral tail vein. Rats were maintained under anesthesia for a 45-min uptake period and for the duration of the imaging session. Physiologic monitoring included measurements of temperature, respiration rate, heart rate and oxygen saturation. A brief CT scan was acquired for attenuation correction and anatomical localization (80 kvP, 500 μAs, 420 ms, 195° rotation in 120° steps) and reconstructed in real time using a modified-Feldkamp algorithm (down sample 2, bin 4) with a Shepp-Logan filter and beam hardening correction applied. The CT image matrix was 352 × 352 × 592 with isotropic voxel dimensions of 0.23 mm3. A 30-min static PET scan was acquired in list mode (350–650 keV, 3.432 ns) with an axial field of view of 12.7 cm.
PET data were reconstructed with Inveon Acquisition Workplace software, version 1.5 (Siemens Medical Solutions, Erlangen, Germany). Corrections were applied for dead-time, decay, attenuation and scatter and a requested resolution smoothing setting of 0.5 mm was used. The reconstruction algorithm was a three-dimensional ordered-subset expectation maximization/maximum a posteriori (OSEM 3D/MAP) iterative protocol (2 OSEM3D iterations and 18 MAP iterations). The image matrix was 256 × 256 with final voxel dimensions of 0.39 × 0.39 × 0.80 mm3mm. The intrinsic resolution of the system was 1.4 mm full width half maximum at the center of the field of view.
PET/CT image processing
Processing and analysis of [18F]-FDG PET data was performed using Vivoquant software version 1.22 (inviCRO, LLC Boston, MA). PET data were resampled to match reference CT voxel size (0.23 mm3 isotropic) and dimensions (352 × 352 × 536). Pre-processing of image data, including PET unit conversion, PET to CT image registration, and image cropping, was achieved via a scripted process. PET data were converted to units of activity (μCi) and registered to the CT image using an automatic algorithm (six parameter, rigid-fast). The coregistered PET/CT image was cropped to a region surrounding the brain (170 × 170 × 240) and an additional automatic registration (six parameter, rigid-fine) was applied post-cropping. The coregistered, cropped dataset was manually reoriented (Z-axis rotation) and saved as a DICOM file.
Pre-processed PET/CT data were registered to a 13-region rat brain atlas by way of the CT, using an automatic algorithm that combines a rigid transformation of the data and scaling of the atlas. A manual correction process was required to improve Data-Atlas co-registration for select subjects. Briefly, CT data were manually translated and rotated (six parameters with linear interpolation) to better fit the skull to the brain atlas. The transformation matrix was applied to the PET data and the data were reprocessed to generate a new quantitative output. The inviCRO rat brain atlas provides the following 13 regions of interest (ROIs): basal ganglia, thalamus, amygdala, cerebellum, cortex, hypothalamus, midbrain, corpus callosum, olfactory, hippocampus, septal area, white matter and other (ventricles). Quantitative output was obtained for left, right and combined hemispheres for a total of 41 ROIs. The uptake concentration for each ROI was normalized to the uptake concentration of the entire atlas (whole brain normalization) for inter-subject comparison.
MRI
The MRI scans were performed on a 7T Bruker Biospec 70/20 USR Superconducting Magnet System (Bruker Biospin, Inc., Billerica, MA), equipped with a birdcage transmit coil in combination with actively decoupled four channel receive array coil. Animals were anesthetized in an induction chamber with a mixture of isoflurane in oxygen (4%), and maintained with 2% isoflurane in oxygen during the MRI procedures. The animals were placed in a prone position on a dedicated rat bed with a circulating warm-water to maintain body temperature. The respiration rate, heart rate, saturation of peripheral oxygen (SpO2), and rectal temperature (SA-instruments, Stony Brook, NY; Harvard Apparatus, Holliston, MA) were continuously monitored through the experiments.
The anatomical proton density and T2-weighted images at different echo times (TE) were acquired for injury assessment, structural changes, and edema progression tracking. The 2D multi echo Rapid Acquisition with Relaxation Enhancement (2D RARE) sequence with repetition time TR = 9000 ms, echo time TE = 20, 60, 100, 140 ms, echo train length ETL = 4, number of averages NA = 2, matrix 102 × 102, FOV 25.6 × 25.6 mm2, in-plane resolution 250 × 250 µm2, slice thickness Thk = 500 µm, number of slices NS = 60, scan time 7.5 min.
The MRI data were processed and analyzed using VivoQuant (InviCRO, Boston, MA). T2 maps were calculated using exponential decay model. Brain lesions were identified using a semi-automated approach based on quantitative information obtained from T2 maps. Briefly, lesion was defined by thresholding voxels within the lesion region with T2 values above the T2 mean plus two standard deviations of T2 values in the contralateral non-injured cortex. Four measures were obtained by two investigators blinded to treatment group. Total lesion volume, defined as the entire lesion area, including hypo- and hyper-intense regions, was outlined manually in each slice through the lesion and the volume obtained for all samples. Lesion volume including edema in the cortex or hippocampus, hyper-intense region volumes were calculated by outlining the region of interest (cortex or hippocampus) on both ipsilateral and contralateral hemispheres. Mean T2 signal was then calculated for the uninjured ROI, and area containing T2 signal more than two standard deviations above the mean were assessed in the lesioned ROI through slices in three dimensions throughout the lesion. Finally, total hippocampal volume was ascertained by manually outlining the hippocampal structure on both the ipsilateral and contralateral hemisphere throughout the visible lesion. Volume obtained from the semi-automated method was used for the subsequent analysis.
Tissue collection and processing
Rats were deeply anesthetized with a pentobarbital solution (Euthasol, 0.3 mg/kg) and perfused with saline followed by 10% formalin before the 5-mm region surrounding the lesion site of the brain was dissected for histology (n = 4 per group). Brain tissue was sectioned at 20 µm for histological analysis.
Standard hematoxylin and eosin (H&E) stain was used for lesion volume quantification. Brain tissue was immunolabeled for microglia (Iba1, 1:100, Wako Chemicals USA, Richmond, VA) and astrocytes (GFAP, 2.5:1000, Abcam, Cambridge, MA). Fluorescent secondary antibodies (Alexa-Fluor Secondaries, Invitrogen, Grand Island, NY) were used to visualize primary antibodies. Images were then collected with an Olympus BX43 microscope (Olympus America) with Olympus cellSens microscopy software (Olympus, Center Valley, PA, USA) or the NanoZoomer Digital Pathology System (Hamamatsu). Scion image analysis (http://rsb.info.nih.gov/nih-image) was used to quantify pixel density of immunolabeling using stain intensity as threshold. Measurement was performed, as previously described, on a minimum of four equally spaced images with a random start within the ipsilateral hippocampus in CA1. All images were obtained at 20 × magnification.27,28
Statistics
All data were collected by an investigator blinded to treatment group. Power analysis was conducted on pilot data. Beam and peg board walking data were compared to baseline values and statistical significance was determined by a two-way ANOVA, Sidak’s multiple comparisons. Morris water maze island crosses during the probe trial were compared to vehicle control and analyzed using a two-way ANOVA, Sidak’s multiple comparisons. Morris water maze trace analysis was conducted by two blinded investigators and a Chi square analysis of the four groups was conducted. Pixel density was measured for histological comparison and a two-tailed unpaired t-test was conducted and reported. Uptake values obtained from PET data were logged and statistical analysis of changes over time in a group was calculated using repeated measures ANOVA, Sidak’s post multiple comparisons. All statistical analysis was conducted using Graphpad Prism Software version 6.01. (GraphPad Software, San Diego, CA). A p value < 0.05 was considered statistically significant.
Results
Intranasal insulin delivery does not alter blood glucose or weight
In order to demonstrate that the intranasal insulin at the dose delivered would have no or limited negative peripheral effects, blood glucose and body weight were assessed. Blood glucose was measured at three time points: prior to CCI, prior to treatment at 4 h post-injury, and at 3 h post treatment with intranasal insulin (Figure 1(b)). While some variability was observed at baseline in animals, attributable to the animals not being fasted prior to assessment, there was no pre-injury difference between groups (p value = 0.2500; repeated measures two-way ANOVA with Sidak’s multiple comparisons). There was no significant difference as a result of interaction between time and treatment (p = 0.2834), time factor alone (p = 0.0626), or injury factor alone (p = 0.3929; repeated measures two-way ANOVA). This demonstrated that neither injury nor insulin administration altered systemic glucose concentration.
The weight of the animals in the second cohort was monitored over the course of the 21-day study (Figure 1(c)). The uninjured cohorts treated with intranasal insulin or saline showed a steady increase in weight over time but no significant difference between treatment groups. The injured groups showed an acute decrease in weight after injury that recovered over time and remained consistent between the two groups. There was no significant difference in weight between the intranasal insulin or intranasal saline-treated groups at any time point.
CCI injury does not inhibit intranasal insulin delivery to the central nervous system
To verify that CCI does not disrupt the pathways of intranasal drug delivery to the brain and to confirm targeted delivery of insulin, we traced the delivery of iodinated insulin after injury. After a moderate CCI, animals were treated with intranasal [125I]-insulin combined with Humulin I-100. The total iodinated dose administered was approximately 10 µCi per animal. [125I]-insulin was detected in all regions investigated (Figure 1(d)). The highest concentration of tagged insulin was found in the olfactory bulb, with amounts exceeding 5 nM of [125I]-insulin. The next highest regions were the cerebellum, brain stem, hippocampus and cortex, respectively. There was no significant difference between the ipsilateral and contralateral sides of any of these brain regions, indicating that the injury does not significantly hinder delivery along the intranasal pathway (p > 0.05, two-tailed t test).
Intranasal insulin significantly reduces hippocampal lesion volume
MRI scans were conducted on a small cohort at days 3 and 9 post injury. From these scans, we calculated cortical lesion volume (Figure 2(b) and (c)), hippocampal lesion volume (Figure 2(d)) and total hippocampal volume (Figure 2(e)). Total cortical lesion volume was calculated by manually outlining the lesion (hyper- and hypo-intense regions on a T2 scan), while cortical lesion volume/edema was evaluated as the amount of area within an ROI that was two standard deviations above the mean T2 value of the same area on the contralateral hemisphere. No significant difference was observed with treatment in the total cortical lesion volume. We found that cortical lesion volume/edema was significantly reduced over time, but there was no effect of treatment (Figure 2(b), two-way ANOVA). However, we did observe a significant decrease in hippocampus lesion volume/edema (measured as T2 values within the hippocampus two standard deviations above the mean of the contralateral hippocampus) in insulin-treated animals in comparison to saline-treated animals at both day 3 and day 9 (Figure 2(d), two-tailed t test *p < 0.05). There was also no significant difference in hippocampal volume, as measured by manual outlining of the hippocampal structure throughout the lesion site with insulin treatment (Figure 2(e), two-tailed t test). Despite a small n for this experimental outcome (n = 3/group), we found statistical significance and promising trends that future studies will expand upon.
Figure 2.

Intranasal insulin decreased lesion volume in the hippocampus. Representative images at nine days post injury (a) from saline treated (left panel) and insulin treated (right panel. The colored ROIs indicate: red = uninjured control lesion area, green = injured lesion area, blue = edema. Total cortical lesion volume is significantly reduced over time, but there is no significant effect of treatment. (b, two-way ANOVA) There was no significant difference in cortex lesion volume (specific for edema, blue) between saline and insulin treated at days 3 or 9 post injury. (c, two-tailed t test) There was a significant decrease in hippocampus lesion volume in insulin-treated animals between days 3 and 9. (d, two-tailed t test *p < 0.05) There is no significant difference in hippocampal volume with insulin treatment over time. (e, two-tailed t test).
Intranasal insulin treatment increased glucose uptake in the hippocampus
In order to determine the effect of intranasal insulin administration on cerebral glucose uptake in a moderate CCI, we conducted a longitudinal PET [18F]-FDG study. [18F]-FDG uptake was visualized as a heat map and aligned with CT scan. The Vivoquant V1.22 atlas was then aligned to the scan for detailed regional uptake data. Baseline values were consistent with no significant difference detected between treatment groups (p > 0.05, repeated measure two-way ANOVA, Sidak’s multiple comparisons test, Figure 3(a)). There was no significant difference in [18F]-FDG uptake in any region between the groups at 2 or 10 days post injury. (p < 0.05 repeated measure two-way ANOVA, Sidak’s multiple comparisons test). However, examination of the animals treated with insulin alone, at 10 days post injury, revealed that this group had significantly higher [18F]-FDG uptake in the ipsilateral hippocampus compared to baseline values (p = 0.0329; repeated measures two-way ANOVA) and uptake at two days post injury (p = 0.0189; repeated measures two-way ANOVA, Sidak’s multiple comparisons test) (Figure 3(a)). There was no significant difference in [18F]-FDG uptake in animals treated with saline at 2 or 10 days post injury compared to uptake at baseline. Analysis of both saline-treated and insulin-treated groups showed that time was a significant source of variation (p = 0.0033; two-way ANOVA, Sidak’s post-test) but there was not a significant interaction effect between time and treatment (p = 0.4586).
Figure 3.
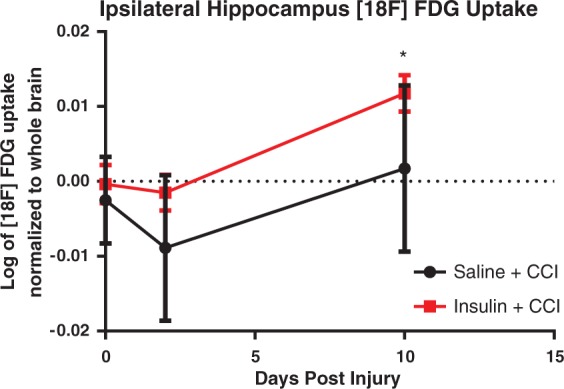
PET imaging of [18F]-FDG reveals significant differences in uptake patterns following intranasal insulin treatment compared to intranasal saline-treated animals after CCI (n = 5/group). PET scans of [18F]-FDG uptake were obtained with a CT for anatomical localization of brain regions. Uptake values from these regions were obtained by aligning a rat atlas to the scans. Regional analysis revealed that at 10 days post injury animals treated with intranasal insulin treatment following CCI had a significantly higher [18F]-FDG uptake in the ipsilateral hippocampus (a) than at baseline (p = 0.0329) and 2 days post injury (p = 0.0189). Data are represented as mean ± SEM. *=p < 0.05.
The ipsilateral and contralateral portion of the remaining atlas regions: basal ganglia, thalamus, amygdala, cerebellum, cortex, hypothalamus, midbrain, corpus callosum, olfactory, hippocampus, septal area, other (ventricles), white matter, entire atlas were examined as well, but no other regions showed significant changes in [18F]-FDG uptake as a result of treatment (Supplemental Figure 1).
Intranasal insulin improved aspects of motor and cognitive function
Rats were trained on two motor function tasks, beam and peg board walking, prior to injury and tested at 1, 7, 14, and 21 days post injury. The injury to the motor cortex increased the number of footfalls in both the insulin-treated and saline-treated groups but there was no significant difference in number of footfalls between the groups at any time point (Figure 4(a), p > 0.05, two-way ANOVA). Time was a significant source of variation in both treatment groups in footfalls on the beam walk (p < 0.0001; two-way ANOVA, Sidak’s post-test) but there was no significant interaction effect of treatment. However, animals treated with intranasal insulin demonstrated a significant decrease in time to cross the beam walk in comparison to animals treated with intranasal saline one day after CCI (Figure 4(b), p = 0.0209; two-way ANOVA, Sidak’s multiple comparison test). There was no significant source of variation from the interaction of time and treatment (p = 0.2014), time (p = 0.0523), or treatment (p = 0.1104; two-way ANOVA, Sidak’s post-test) in time to cross the beam walk. There was no significant difference between intranasal insulin-treated and intranasal saline-treated in time to cross the beam at 7, 14, and 21 days post injury,
Figure 4.

Intranasal insulin treatment after injury improves some aspects of motor function. After injury, both groups of animals (n = 7/group) show a non-significant increase in footfalls indicating a deficit in motor function that recovers over time (a). However, animals treated with intranasal insulin after injury were able to cross the beam significantly faster than saline-treated rats (b). Uninjured animals (n = 4/per group) show no significant difference in time (a) or foot falls (b). Data are presented as an average of time and footfalls across the four widths of board the animals were trained to cross. Data are represented as mean ± SEM. *=p < 0.05.
Cognitive function, including learning and memory, was assessed in animals from cohort 1 using the Morris water maze task from days 11–14 post injury. There was a significant effect of time (p < 0.0001) and treatment (p = 0.0032) but no significant interaction (p = 0.4462; two-way ANOVA, repeated measures, Sidak’s post-test) in latency to platform. Uninjured rats treated with insulin learned the location of the hidden platform slightly faster (3.7 ± 0.6 s) than uninjured rats treated with saline (6.5 ± 1.9 s) by day 4 of training (Figure 5(a)). In addition, injured insulin-treated rats, reached the platform slightly faster (within 15.1 ± 3.1 s) by day 4 of training compared to saline-treated animals (20.4 ± 4.9 s). Although the interaction effect was not significant, injured animals treated with saline were significantly slower to find the platform on trial day 3 than both uninjured groups treated with saline (p = 0.0078) or insulin (p = 0.0031; two-way repeated measures ANOVA, Sidak’s post-test). Injured animals treated with saline also performed worse on trial day 4 than uninjured treated with saline (p = 0.0247) or insulin (p = 0.0065). Most notably, there was no significant difference in latency to platform between injured rats treated with intranasal insulin and uninjured controls on any training day.
Figure 5.

Intranasal insulin treatment improved memory function in Morris water maze tests. After CCI rats treated with intranasal saline performed significantly worse than uninjured controls at day three (p = 0.0078) and day 4 (p = 0.0247) of training (a) (n = 6/group uninjured, n = 10/group injured). However, during the probe trial, the injured animals treated with intranasal insulin (n = 7) crossed the island location significantly more times (p = 0.0330) in those treated with intranasal saline (n = 8) (b). There was no significant difference in island crosses between the uninjured treatment groups (n = 6/group). Search strategy utilized by rats during the probe trial was analyzed and categorized into one of three major groups (spatial, systematic, and looping) as previously described.29 Representative patterns are shown (c), and number of animals utilizing each strategy during the probe trial was quantified. Saline and insulin-treated uninjured animals (control) showed mostly spatial and systematic search strategies (d). A greater proportion of animals treated with saline after CCI showed a reduction in spatial search strategy and an increase in looping search methods. Likewise, fewer animals that received intranasal insulin for 14 days after injury displayed looping behavior than saline-treated rats, and a return of spatial search strategy (p < 0.0001). *p < 0.05 **p < 0.001. Points represent mean ± SEM.
Treatment with intranasal insulin after CCI also resulted in a significant increase in target region (island) crosses during the probe trial (Figure 5(b)). In this probe trial assessment, in which the hidden platform is removed, saline and insulin-treated naïve animals showed no difference from insulin-treated injured rats, while saline-treated injured rats showed significantly fewer crosses than those that received insulin (Figure 5(b); p = 0.0330; two-way ANOVA, Sidak’s multiple comparisons test). Additionally, there was a significant interaction effect between injury and treatment observed (p = 0.0182, two-way ANOVA).
To further evaluate this data, the search strategy utilized by animals during the Morris water maze was assessed as previously described.29 Data are presented as a percentage of rats in each group that displayed the search behavior (Figure 5(c)). Analysis of traces obtained during the probe trial showed a significant difference between all of the groups (Figure 5(d); p < 0.0001, Chi square analysis). Neither the insulin nor saline-treated group of uninjured animals displayed looping behavior. Uninjured animals treated with saline displayed equal (50%) amounts of spatial and systematic search strategy. Interestingly, uninjured insulin-treated animals displayed more systematic (84%) search strategy than uninjured saline-treated animals (50%). In contrast, both injured groups demonstrated looping search strategy, although injured animals treated with intranasal insulin showed less looping behavior (14%) than injured animals treated with saline (50%). The injured group treated with intranasal saline also showed equal amounts of spatial and systematic search strategy (43%), whereas looping behavior was the dominant search strategy for the saline-treated injured animals (50%) and spatial was the least used for this treatment group (14%).
Intranasal insulin treatment reduced microglia/macrophages in the hippocampus but not astrocytes
Immunohistochemical and histological assessment of tissue was conducted to examine the effects of injury and treatment on specific cellular populations and overall tissue health. H&E staining confirmed that the lesion was within the cortex and did not penetrate into the hippocampus. However, despite improved behavioral outcomes, intranasal insulin did not reduce lesion volume in the cortex (data not shown). This finding was also observed in MRI analysis of cortex lesion volume (Figure 2(a)).
Analysis of immunohistochemistry for the inflammatory marker Iba1, an identifier of both macrophages and microglia, demonstrated a significant reduction (p = 0.0089; two-tailed unpaired t-test) in Iba1 immunoreactivity in the CA1 region of the hippocampus (Figure 6(a)) in intranasal insulin-treated animals (Figure 6(c)) compared to intranasal saline treated (Figure 6(b)). However, quantification of GFAP (Figure 6(d)), a marker of astrocytes, showed no significant difference between intranasal insulin (Figure 6(f)) and intranasal saline (Figure 6(e)) treatment after injury (p = 0.0770; two-tailed unpaired t-test).
Figure 6.

Treatment with intranasal insulin after CCI reduces macrophage/microglia but does not significantly reduce astrocyte activation. Quantification of Iba1, a marker of microglia and macrophages, revealed a significant reduction (p = 0.0089) (a) in cells in CA1 of the ipsilateral hippocampus in animals treated with intranasal insulin (c) compared to intranasal saline (b) (n = 3 per group). Quantification of GFAP, a cell surface marker of astrocytes, did not show a significant difference (p = 0.0770) (d) between insulin-treated (n = 4) (f) and saline-treated animals (n = 3) (e). Points represent mean ± SEM. * = p < 0.05.
Discussion
This study expands the body of knowledge relevant to the neurometabolic crisis that occurs after brain injury and presents a potential novel therapeutic treatment, intranasal insulin. Our findings show that treatment with intranasal insulin beginning at 4 h post-injury significantly improves several outcome measures, including beam walk function, cognitive function, [18F]-FDG uptake at 10 days post injury, and decreases neuroinflammation and lesion in the hippocampus. Further, these improvements in functional outcome were not complicated by peripheral side effects as intranasal insulin did not alter blood glucose or weight.
Intranasal delivery of peptides and other drugs using a pipet has been shown to be successful in previous rodent studies.15,19,29 However, to date, no previous study has attempted to deliver intranasal insulin to rats following CCI or any other model of brain injury. In order to confirm appropriate delivery and lack of peripheral effects, we performed a number of control analyses and showed that both the expected route of delivery was intact after CCI, leading to appropriate delivery of insulin to the brain, and that there was no change in peripheral glucose or weight. Quantification of [125 I] insulin showed that there was no significant difference between ipsilateral and contralateral brain regions indicating that injury did not inhibit pathways necessary to deliver drug. Previous studies have shown that both the olfactory and trigeminal neural pathways deliver therapeutic proteins from the nasal mucosa to a variety of brain regions.29 Our data show that while insulin reaches the highest concentration in the olfactory bulb, it also distributes to the cortex, cerebellum, hippocampus, and brainstem.
The density of insulin receptors in the regions we identified, successful drug delivery explains our experimental outcomes. MRI data show that cortical lesion volume is reduced over time but there is no significant effect in this region. However, in the hippocampus, we see a significant reduction in hippocampal lesion volume with intranasal insulin treatment compared to saline treatment. This suggests that regions with higher insulin receptor density, like the hippocampus, will display a more robust response in comparison to low density regions like the cortex.
We and others have shown that TBI can significantly change glucose uptake, as measured with [18F]-FDG PET, and CMRglc, in the brain. 7,23,30 Clinical studies have also shown a correlation between increased [18F]-FDG uptake and memory function in normal controls and Alzheimer’s patients.31 Our study showed a significant increase in [18F]-FDG uptake in the ipsilateral hippocampus at 10 days post injury compared to 2 days post injury in the intranasal insulin-treated group. This increase at 10 days is interesting as it correlates with the beginning of the Morris water maze training, in which insulin-treated animals performed significantly better than saline-treated controls. The Morris water maze is a test of learning and memory, which are primarily functions of the hippocampus.32 Our findings suggest that the increase in glucose uptake in the hippocampus may contribute to improved functional performance. Human studies have shown a significant acute increase in ATP and phosphocreatine, which represents the brains energy reserve levels after intranasal insulin administration.33
Intranasal insulin treatment significantly improved time to cross the beam walk after injury in comparison to saline-treated animals. There was a significant increase in time to cross at one day post injury observed in the saline-treated animals that was not observed in insulin-treated animals. There was a marked increase in foot falls after injury in both groups verifying that the injury equally affected this component of motor function. Intranasal insulin treatment did not improve foot falls after injury. This difference suggests that treatment did not have a significant effect in the cortex. This is supported by data showing no significant difference in lesion volume between saline and insulin-treated animals, possibly due to the low insulin receptor density of the neurons of the cortex.34 Second, there is the suggestion that animals treated with insulin showed increased recall of how to accomplish the task. One previous study by LeMay et al.35 examined the effect of pre-treatment with peripherally administered insulin on motor function recover after an ischemic event. A significant improvement in motor function was observed in animals pre-treated with an intraparietal injection of insulin prior to an aortic occlusion at 24 h post occlusion.35 The difference in motor function observed in the previous study compared to our findings may be attributed to a number of factors. First, the previous study uses several different motor function assays to quantify outcome which may have greater sensitivity to detecting differences than our beam and peg walking tasks. Second, the injury models are drastically different. The previous study uses the aortic occlusion model which induces injury by disrupting blood flow, whereas CCI induces injury by direct impact on the brain in the parietal supplementary motor cortex. Third, the authors attribute the difference to the hypoglycemia induced by their treatment which was not observed in our treatment model due to the mode of administration, intraparietal insulin injection versus intranasal insulin.
It is well documented that TBI inhibits both learning and memory recall.36,37 The animal’s ability to locate the platform during the probe trial is primarily a test of memory,38,39 while the animal’s ability to find the platform over the training days is a measurement of learning.39 Both the injured and uninjured treatment groups showed the ability to learn over the course of the trials as they found the platform more quickly each day. This was an unexpected finding, as we and others have previously observed impaired learning in the Morris water maze with moderate CCI.40 We did not observe a significant difference as a result of treatment within the injured or uninjured cohorts. This finding suggests that the repeated isoflurane exposure may contribute to overall improvement in learning; previous studies have demonstrated a neuroprotective component of isoflurane.41,42 However, injured animals treated with intranasal saline were significantly slower to find the platform on days three and four of training compared to both uninjured groups. This shows that CCI injury does reduce learning ability. There was also no significant difference between injured animals treated with intranasal insulin and the uninjured groups. Overall, this suggests that there is an improvement in learning with intranasal insulin treatment after injury. Future studies will examine intranasal insulin administration without the use of isoflurane and utilize additional learning paradigms.
We did, however, find a significant difference in island crosses between our intranasal saline and intranasal insulin-treated injured animals. Animals treated with intranasal insulin after CCI crossed the island location significantly more times during the probe trial, indicating that this group showed improved recall of the location of the platform. Insulin resistance, caused by reduced sensitivity of the receptor to ligand, is observed in Alzheimer’s patients and is correlated with decreased memory function and learning.43 The function of insulin has been tested in healthy adults and the improvement observed in memory function in the presented study is analogous to human trials where a significant improvement in long term but not immediate recall of a word list was observed in intranasal insulin-treated individuals compared to placebo treated.44 Further, there was no difference in attention or concentration observed between the two treatment groups in the clinical study, supporting our findings that this treatment improves memory recall rather than overall learning.
In addition to platform crosses, we also examined search strategy. The three major sub categories of Morris water maze search strategy analysis are spatial, systematic, and looping; each correlates with familiarity with the task, level of injury, and general intelligence.45 Looping behavior is typically observed in rodents on the first day of training or in those with moderate to severe TBI and is defined by the animal remaining primarily in the outer quadrant, swimming the perimeter. Systematic behavior is defined by the animal primarily scanning the central four quadrants, indicating recall of the location of the platform. Spatial search strategy is considered the most efficient and is defined by the animal searching primarily within the platform quadrant. Our data show that injured animals treated with intranasal insulin showed significantly greater spatial search strategy than injured animals treated with intranasal saline. We also show that injured animals treated with intranasal saline show significantly greater looping search strategy than injured animals treated with intranasal insulin. Looping behavior is typically observed in animals naïve to the task and injured animals, suggesting that insulin treatment reduces injury and improves performance. As an animal learns the location of the platform in the inner quadrant, they are more likely to explore the center of the pool. In contrast, the naïve animal will remain in the outer quadrant close to the wall, where they are less exposed. Additionally, looping behavior has been observed in rats with neurotoxic hippocampal lesions, supporting the idea that decreased looping is indicative of hippocampal damage and is measurable using this analysis.46
Additionally, a significant difference in search strategy was observed in the uninjured cohorts. Uninjured rats treated with intranasal insulin showed significantly more systematic search strategy than those treated with intranasal saline. Neither of the uninjured groups exhibited looping search strategy behavior. No other significant differences in Morris water maze were observed in uninjured cohorts; therefore, this increase in systematic search strategy is a point of interest and will be the subject of future experiments as it suggests that intranasal insulin alter learning strategies.
Examination of insulin action on a cellular level has shown that insulin acts on neurons to increase GLUT 3 expression on the membrane, directly increasing glucose uptake and the energy available to maintain cellular homeostasis and produce neurotransmitters necessary for memory function.47 This metabolic response and insulin’s direct effect on promoting survival in neurons may be responsible for improving memory function.48 Insulin also increases dendritic function, leading to long lasting effects that observable as changes in memory.49,50
Finally, a significant alteration in neuroinflammation within the hippocampus was observed. Microglia are the resident macrophages of the brain. These cells serve an important purpose in the acute stages following injury of clearing cellular debris but prolonged activation can be detrimental.51 Pro-inflammatory microglia produce reactive oxygen species and cytokines that can result in neuronal cell death.52 Intranasal insulin treatment significantly reduced the amount of Iba1, a marker of microglia and macrophages, in the hippocampus at 21 days post injury. The density of Iba1 was assessed in order to evaluate not just cell number but also take into account cell size and processes, as activated, pro-inflammatory microglia have an enlarged cell body compared to quiescent microglia.53 Previous studies have shown that intranasal insulin administration can simultaneously restore insulin signaling pathway while reducing microglia activation in a mouse model of Alzheimer’s disease.20 This reduction in microglia activation may decrease the amount of pro-inflammatory cytokines, nitric oxide, and reactive oxygen species produced by microglia in their activated state following injury. These compounds result in neuronal cell death, thus a decrease would promote neuronal viability which manifests as improved behavioral outcome. Recently, in vitro studies have supported the in vivo findings by showing that insulin treatment can significantly reduce the production of monocyte chemoattractant protein-1 (MCP-1) from activated microglia.54 This chemokine plays a role in recruiting additional macrophage and microglia to the site of injury.55 The reduction in this molecule would explain the observed reduction in Iba1 following intranasal insulin treatment. Together, these data suggest that insulin acts directly on microglia to reduce activation.
In summary, intranasal insulin treatment decreases lesion volume and improves memory function and glucose uptake in the ipsilateral hippocampus after CCI. Intranasal insulin was successfully delivered to the cortex, hippocampus, brain stem, and cerebellum after CCI injury using a pipette method. This delivery and dosage did not negatively impact blood glucose or weight gain in injured or uninjured animals. Additionally, intranasal insulin treatment significantly reduced Iba1 staining in CA1 of the hippocampus. Together, the data from this study suggest that intranasal insulin treatment is a promising method of treating the metabolic crisis following TBI, as well as improving memory function and reduces microglia mediated inflammation.
Supplementary Material
Acknowledgements
The authors would like to thank Dr. Aryan Namboodirri, Jishnu Krishnan, Dr. Alex Korotcov, Guzal Khayrullina, Laura Tucker, and Dr. Reed Selwyn for their technical assistance and consultation on this project.
Funding
The author(s) disclosed receipt of the following financial support for the research, authorship, and/or publication of this article: This study was supported by the Cosmos Club Foundation and NIH grant number 1R01NS073667-01A1.
Declaration of conflicting interests
The author(s) declared the following potential conflicts of interest with respect to the research, authorship, and/or publication of this article: Fiona Brabazon, Kimberly R Byrnes, and William H Frey 2nd are listed as inventors for a patent from the Uniformed Services University/HealthPartners Institute for Education and Research for intranasal insulin in the treatment of traumatic brain injury. William H Frey 2nd is an inventor on a patent owned by Health Partners Institute for Education and Research regarding the use of intranasal insulin. Colin Wilson and Shalini Jaiswal have no competing financial interests to report.
Authors’ contributions
FB contributed to the experimental design, surgery, behavioral assays, histology, and immunohistochemistry analysis. CW and SJ contributed to PET scans and analysis. WHF contributed to study design. JR contributed to MRI analysis. KB contributed to MWM search strategy analysis and experimental design.
Ethical research
All animal procedures were conducted as approved by the Uniformed Services University IACUC which complies with all ARRIVE standards for the care and treatment of animals.
Supplementary material
Supplementary material for this paper can be found at http://journals.sagepub.com/doi/suppl/10.1177/0271678X16685106.
References
- 1.Rassovsky Y, Levi Y, Agranov E, et al. Predicting long-term outcome following traumatic brain injury (TBI). J Clin Exp Neuropsychol 2015; 37: 354–366. [DOI] [PubMed] [Google Scholar]
- 2.Giza CC, Hovda DA. The new neurometabolic cascade of concussion. Neurosurgery 2014 . October75 Suppl 4): S24–S33. [DOI] [PMC free article] [PubMed] [Google Scholar]
- 3.Fridman EA, Beattie BJ, Broft A, et al. Regional cerebral metabolic patterns demonstrate the role of anterior forebrain mesocircuit dysfunction in the severely injured brain. Proc Natl Acad Sci U S A 201429; 111: 6473–6478. [DOI] [PMC free article] [PubMed] [Google Scholar]
- 4.Li J, Gu L, Feng DF, et al. Exploring temporospatial changes in glucose metabolic disorder, learning, and memory dysfunction in a rat model of diffuse axonal injury. J Neurotrauma [Research Support, Non-U.S. Gov’t] 2012; 29: 2635–2646. [DOI] [PMC free article] [PubMed] [Google Scholar]
- 5.Vespa P, Bergsneider M, Hattori N, et al. Metabolic crisis without brain ischemia is common after traumatic brain injury: A combined microdialysis and positron emission tomography study. J Cereb Blood Flow Metab 2005; 25: 763–774. [DOI] [PMC free article] [PubMed] [Google Scholar]
- 6.O’Connell MT, Seal A, Nortje J, et al. Glucose metabolism in traumatic brain injury: A combined microdialysis and [18F]-2-fluoro-2-deoxy-D-glucose-positron emission tomography (FDG-PET) study. Acta Neurochir Suppl 2005; 95: 165–168. [DOI] [PubMed] [Google Scholar]
- 7.Yoshino A, Hovda DA, Kawamata T, et al. Dynamic changes in local cerebral glucose utilization following cerebral conclusion in rats: Evidence of a hyper- and subsequent hypometabolic state. Brain Res 1991; 561: 106–119. [DOI] [PubMed] [Google Scholar]
- 8.Berg JM, Stryer L. Biochemistry, 5th ed New York: WH Freeman, 2002. [Google Scholar]
- 9.Mergenthaler P, Lindauer U, Dienel GA, et al. Sugar for the brain: The role of glucose in physiological and pathological brain function. Trends Neurosci 2013; 36: 587–597. [DOI] [PMC free article] [PubMed] [Google Scholar]
- 10.Oldendorf WH. Brain uptake of radiolabeled amino acids, amines, and hexoses after arterial injection. Am J Physiol 1971; 221: 1629–1639. [DOI] [PubMed] [Google Scholar]
- 11.Schulingkamp RJ, Pagano TC, Hung D, et al. Insulin receptors and insulin action in the brain: Review and clinical implications. Neurosci Biobehav Rev 2000; 24: 855–872. [DOI] [PubMed] [Google Scholar]
- 12.Plum L, Schubert M, Bruning JC. The role of insulin receptor signaling in the brain. Trends Endocrinol Metab 2005; 16: 59–65. [DOI] [PubMed] [Google Scholar]
- 13.Zhao WQ, Alkon DL. Role of insulin and insulin receptor in learning and memory. Mol Cell Endocrinol 2001; 177: 125–134. [DOI] [PubMed] [Google Scholar]
- 14.Cashion MF, Banks WA, Kastin AJ. Sequestration of centrally administered insulin by the brain: Effects of starvation, aluminum, and TNF-alpha. Horm Behav 1996; 30: 280–286. [DOI] [PubMed] [Google Scholar]
- 15.Thorne RG, Pronk GJ, Padmanabhan V, et al. Delivery of insulin-like growth factor-I to the rat brain and spinal cord along olfactory and trigeminal pathways following intranasal administration. Neuroscience 2004; 127: 481–496. [DOI] [PubMed] [Google Scholar]
- 16.Dhuria SV, Hanson LR, Frey WH., 2nd Intranasal delivery to the central nervous system: Mechanisms and experimental considerations. J Pharm Sci 201; 99: 1654–1673. [DOI] [PubMed] [Google Scholar]
- 17.Lochhead JJ, Wolak DJ, Pizzo ME, et al. Rapid transport within cerebral perivascular spaces underlies widespread tracer distribution in the brain after intranasal administration. J Cereb Blood Flow Metab 2015; 35: 371–381. [DOI] [PMC free article] [PubMed] [Google Scholar]
- 18.Reger MA, Watson GS, Green PS, et al. Intranasal insulin administration dose-dependently modulates verbal memory and plasma amyloid-beta in memory-impaired older adults. J Alzheimers Dis 2008; 13: 323–331. [DOI] [PMC free article] [PubMed] [Google Scholar]
- 19.Maimaiti S, Anderson KL, DeMoll C, et al. Intranasal insulin improves age-related cognitive deficits and reverses electrophysiological correlates of brain aging. J Gerontol A Biol Sci Med Sci 2015; 71: 30–39. [DOI] [PMC free article] [PubMed] [Google Scholar]
- 20.Chen Y, Zhao Y, Dai CL, et al. Intranasal insulin restores insulin signaling, increases synaptic proteins, and reduces Abeta level and microglia activation in the brains of 3xTg-AD mice. Exp Neurol 2014; 261: 610–619. [DOI] [PubMed] [Google Scholar]
- 21.Dixon CE, Clifton GL, Lighthall JW, et al. A controlled cortical impact model of traumatic brain injury in the rat. J Neurosci Methods 1991; 39: 253–262. [DOI] [PubMed] [Google Scholar]
- 22.Maimaiti S, Anderson KL, DeMoll C, et al. Intranasal insulin improves age-related cognitive deficits and reverses electrophysiological correlates of brain aging. J Gerontol A Biol Sci Med Sci 2016; 71: 30–39. [DOI] [PMC free article] [PubMed] [Google Scholar]
- 23.Selwyn R, Hockenbury N, Jaiswal S, et al. Mild traumatic brain injury results in depressed cerebral glucose uptake: An (18)FDG PET study. J Neurotrauma [Research Support, Non-U.S. Gov’t] 2013; 30: 1943–1953. [DOI] [PubMed] [Google Scholar]
- 24.Selwyn RG, Cooney SJ, Khayrullina G, et al. Outcome after repetitive mild traumatic brain injury is temporally related to glucose uptake profile at time of second injury. J Neurotrauma 2016; 33: 1479–1491. [DOI] [PubMed] [Google Scholar]
- 25.Morris R. Developments of a water-maze procedure for studying spatial learning in the rat. J Neurosci Methods 1984; 11: 47–60. [DOI] [PubMed] [Google Scholar]
- 26.Brody DL, Holtzman DM. Morris water maze search strategy analysis in PDAPP mice before and after experimental traumatic brain injury. Exp Neurol 2006; 197: 330–340. [DOI] [PMC free article] [PubMed] [Google Scholar]
- 27.Donnelly DJ, Gensel JC, Ankeny DP, et al. An efficient and reproducible method for quantifying macrophages in different experimental models of central nervous system pathology. J Neurosci Methods 2009; 181: 36–44. [DOI] [PMC free article] [PubMed] [Google Scholar]
- 28.Cooney SJ, Zhao Y, Byrnes KR. Characterization of the expression and inflammatory activity of NADPH oxidase after spinal cord injury. Free Radic Res 2014; 48: 929–939. [DOI] [PMC free article] [PubMed] [Google Scholar]
- 29.Renner DB, Svitak AL, Gallus NJ, et al. Intranasal delivery of insulin via the olfactory nerve pathway. J Pharm Pharmacol 2012; 64: 1709–1714. [DOI] [PubMed] [Google Scholar]
- 30.Song J, Li P, Chaudhary N, Gemmete JJ, et al. Correlating cerebral (18)FDG PET-CT patterns with histological analysis during early brain injury in a rat subarachnoid hemorrhage model. Transl Stroke Res 2015; 6: 290–295. [DOI] [PubMed] [Google Scholar]
- 31.Craft S, Baker LD, Montine TJ, et al. Intranasal insulin therapy for Alzheimer disease and amnestic mild cognitive impairment: A pilot clinical trial. Arch Neurol 2012; 69: 29–38. [DOI] [PMC free article] [PubMed] [Google Scholar]
- 32.Redish AD, Touretzky DS. The role of the hippocampus in solving the Morris water maze. Neural Comput 1998; 10: 73–111. [DOI] [PubMed] [Google Scholar]
- 33.Jauch-Chara K, Friedrich A, Rezmer M, et al. Intranasal insulin suppresses food intake via enhancement of brain energy levels in humans. Diabetes 2012; 61: 2261–2268. [DOI] [PMC free article] [PubMed] [Google Scholar]
- 34.Marks JL, Porte D, Jr., Stahl WL, et al. Localization of insulin receptor mRNA in rat brain by in situ hybridization. Endocrinology 1990; 127: 3234–3236. [DOI] [PubMed] [Google Scholar]
- 35.LeMay DR, Gehua L, Zelenock GB, et al. Insulin administration protects neurologic function in cerebral ischemia in rats. Stroke 1988; 19: 1411–1419. [DOI] [PubMed] [Google Scholar]
- 36.Smith DH, Lowenstein DH, Gennarelli TA, et al. Persistent memory dysfunction is associated with bilateral hippocampal damage following experimental brain injury. Neurosci Lett 1994; 168: 151–154. [DOI] [PubMed] [Google Scholar]
- 37.Capruso DX, Levin HS. Cognitive impairment following closed head injury. Neurol Clin 1992; 10: 879–893. [PubMed] [Google Scholar]
- 38.Smith DH, Okiyama K, Thomas MJ, et al. Evaluation of memory dysfunction following experimental brain injury using the Morris water maze. J Neurotrauma 1991; 8: 259–269. [DOI] [PubMed] [Google Scholar]
- 39.Brandeis R, Brandys Y, Yehuda S. The use of the Morris Water Maze in the study of memory and learning. Int J Neurosci 1989; 48: 29–69. [DOI] [PubMed] [Google Scholar]
- 40.Scheff SW, Baldwin SA, Brown RW, et al. Morris water maze deficits in rats following traumatic brain injury: Lateral controlled cortical impact. J Neurotrauma 1997; 14: 615–627. [DOI] [PubMed] [Google Scholar]
- 41.Sun M, Deng B, Zhao X, et al. Isoflurane preconditioning provides neuroprotection against stroke by regulating the expression of the TLR4 signalling pathway to alleviate microglial activation. Sci Rep 2015; 5: 11445. [DOI] [PMC free article] [PubMed] [Google Scholar]
- 42.Li L, Zuo Z. Isoflurane preconditioning improves short-term and long-term neurological outcome after focal brain ischemia in adult rats. Neuroscience 2009; 164: 497–506. [DOI] [PMC free article] [PubMed] [Google Scholar]
- 43.Dineley KT, Jahrling JB, Denner L. Insulin resistance in Alzheimer’s disease. Neurobiol Dis 2014; 72(Pt A): 92–103. [DOI] [PMC free article] [PubMed] [Google Scholar]
- 44.Benedict C, Hallschmid M, Hatke A, et al. Intranasal insulin improves memory in humans. Psychoneuroendocrinology 2004; 29: 1326–1334. [DOI] [PubMed] [Google Scholar]
- 45.Janus C. Search strategies used by APP transgenic mice during navigation in the Morris water maze. Learn Mem 2004; 11: 337–346. [DOI] [PMC free article] [PubMed] [Google Scholar]
- 46.Gallagher M, Burwell R, Burchinal M. Severity of spatial learning impairment in aging: Development of a learning index for performance in the Morris water maze. Behav Neurosci 2015; 129: 540–548. [DOI] [PMC free article] [PubMed] [Google Scholar]
- 47.Uemura E, Greenlee HW. Insulin regulates neuronal glucose uptake by promoting translocation of glucose transporter GLUT3. Exp Neurol 2006; 198: 48–53. [DOI] [PubMed] [Google Scholar]
- 48.Apostolatos A, Song S, Acosta S, et al. Insulin promotes neuronal survival via the alternatively spliced protein kinase CdeltaII isoform. J Biol Chem 2012; 287: 9299–9310. [DOI] [PMC free article] [PubMed] [Google Scholar]
- 49.Chiu SL, Chen CM, Cline HT. Insulin receptor signaling regulates synapse number, dendritic plasticity, and circuit function in vivo. Neuron 2008; 58: 708–719. [DOI] [PMC free article] [PubMed] [Google Scholar]
- 50.Duarte AI, Moreira PI, Oliveira CR. Insulin in central nervous system: More than just a peripheral hormone. J Aging Res 2012; 2012: 384017. [DOI] [PMC free article] [PubMed] [Google Scholar]
- 51.Loane DJ, Byrnes KR. Role of microglia in neurotrauma. Neurotherapeutics 2010; 7: 366–377. [DOI] [PMC free article] [PubMed] [Google Scholar]
- 52.Marin-Teva JL, Cuadros MA, Martin-Oliva D, et al. Microglia and neuronal cell death. Neuron Glia Biol 2011; 7: 25–40. [DOI] [PubMed] [Google Scholar]
- 53.Chio CC, Lin MT, Chang CP. Microglial activation as a compelling target for treating acute traumatic brain injury. Curr Med Chem 2015; 22: 759–770. [DOI] [PubMed] [Google Scholar]
- 54.Spielman LJ, Bahniwal M, Little JP, et al. Insulin modulates in vitro secretion of cytokines and cytotoxins by human glial cells. Curr Alzheimer Res 2015; 12: 684–693. [DOI] [PubMed] [Google Scholar]
- 55.Deshmane SL, Kremlev S, Amini S, et al. Monocyte chemoattractant protein-1 (MCP-1): An overview. J Interferon Cytokine Res 2009; 29: 313–326. [DOI] [PMC free article] [PubMed] [Google Scholar]
Associated Data
This section collects any data citations, data availability statements, or supplementary materials included in this article.