

SUMMARY
Bacterial genes that change in expression upon environmental disturbance have commonly been seen as those that must also phenotypically matter. However, several studies suggest that differentially expressed genes are rarely phenotypically important. We demonstrate, for Gram-positive and Gram-negative bacteria, that these seemingly uncoordinated gene sets are involved in responses that can be linked through topological network analysis. However, the level of coordination is stress-dependent. While a well-coordinated response is triggered in response to nutrient stress, antibiotics trigger an uncoordinated response in which transcriptionally and phenotypically important genes are neither linked spatially nor in their magnitude. Moreover, a gene expression meta-analysis reveals that genes with large fitness changes during stress have low transcriptional variation across hundreds of other conditions, and vice versa. Our work suggests that cellular responses can be understood through network models that incorporate regulatory and genetic relationships, which could aid drug target predictions and genetic network engineering.
Keywords: Tn-Seq, RNA-Seq, stress response, Streptococcus, Pseudomonas, systems biology, data integration, metabolic modeling
Graphical abstract

INTRODUCTION
While a comprehensive understanding of how organisms overcome stress could have wide ranging applications from bioengineering to drug(-target) discovery, even relatively simple perturbations in bacteria (e.g. changes in pH, antibiotics) trigger complex ‘multi-level’ responses that remain hard to predict (Tomasz, 1979; Vakulenko and Mobashery, 2003; Floss and Yu, 2005; Drlica et al., 2008; van Opijnen and Camilli, 2012; Rajagopal et al., 2016; van Opijnen et al., 2016). Such responses can be separated into at least two organizational levels. The transcriptional response describes the change in gene expression, while the phenotypic response describes how the importance of each gene (fitness) changes due to stress. Although transcriptional and phenotypic stress responses are inter-dependent, they are measured experimentally by two disparate technologies. Transcriptomic profiling, measured by microarrays or RNA-Seq, has been particularly popular in identifying genes that are differentially expressed upon a perturbation, such as exposure to antibiotics (Nielsen et al., 2012; Chatterjee et al., 2013), interaction with host niches (Bao et al., 2015), and disruption of iron homeostasis (Butcher and Stintzi, 2013). Although RNA-Seq profiles provide a detailed picture of the transcriptional landscape, it is unclear whether transcript abundance or changes are predictive of the phenotypic importance of a gene (Feder and Walser, 2005; Guimaraes et al., 2014). Alternatively, genome-wide fitness profiling approaches, such as transposon insertion sequencing (Tn-Seq), directly link genotypes to phenotypes thereby measuring the genome-wide phenotypic stress response (Gawronski et al., 2009; Goodman et al., 2009; Langridge et al., 2009; van Opijnen et al., 2009; van Opijnen and Camilli, 2013). Tn-Seq determines the phenotypic importance of each gene in a specific environment (referred to as “gene fitness” in this paper) by measuring the fitness change caused by disrupting a gene. For example, the lower the fitness, the more important a gene is for surviving a specific (e.g. stressful) condition (van Opijnen et al., 2009; van Opijnen and Camilli, 2012; van Opijnen and Camilli, 2013).
Although both transcriptomic and phenotypic profiling interrogate the same gene network, little is known about how these two data types correlate, i.e. are differentially expressed genes also phenotypically important during stress? Previous studies have shown poor correlation between phenotypic and transcriptional profiles in several bacterial and yeast species (Birrell et al., 2002; Giaever et al., 2002; Smith et al., 2006; Deutschbauer et al., 2011; Price et al., 2013; Denman et al., 2014; Turner et al., 2014; Xie et al., 2015; Keren et al., 2016). However, in these studies Tn-Seq or RNA-Seq profiles were scarcely validated and analyses did not consider (network-)relationships between genes. For instance, the discordance between phenotypically important genes and transcriptionally important genes was analyzed in terms of genomic location, revealing little correlation (Deutschbauer et al., 2011, Price et al., 2013), however, because genes interact within a specific network architecture, a topological analysis may be more appropriate. Indeed, here we determine that a correlation between transcription and phenotype does actually exist when: 1.) genes are viewed in context of the cellular network, and 2.) the applied stress matches the stress that shaped the response network through evolution.
As our model system we employ the bacterium Streptococcus pneumoniae, a major cause of pneumonia, meningitis, sepsis, and otitis media, and resulting in ~1 million deaths annually (Tuomanen et al.; WHO, 2007; CDC, 2013; Henriques-Normark and Tuomanen, 2013). Strains of S. pneumoniae show extensive variation in the presence or absence of genes (Tettelin et al., 2001; Medini et al., 2005; Medini et al., 2008), and because individual genes are connected through complex genetic networks (Boone et al., 2007; Dixon et al., 2009), such genomic variation may re-wire the genomic network and make some phenotypes strain-dependent. Indeed, we have recently shown that S. pneumoniae strains respond differently to antibiotics (van Opijnen et al., 2016), motivating us here to simultaneously investigate multiple strains to obtain a generalizable view of the stress response.
In this study, we first show that combining transcriptomics and phenotypic screening with network analysis identifies links between transcriptional and phenotypic stress responses. We generate an unbiased, high-quality, and extensively validated profile of the bacterial stress response by employing two genome-wide approaches, RNA-Seq and Tn-Seq, to measure the stress response for three pneumococcal strains under seven environmental perturbations: three levels of nutrient depletion and four antibiotics. Data analysis revealed little correlation between transcriptionally important genes (TIGs; genes whose expression changes upon a change in the environment) and phenotypically important genes (PIGs; genes whose fitness changes upon a change in the environment) across the entire genome. To contextualize the transcriptional and phenotypic profiles, we curated the first genome-scale metabolic model of a pathogenic Streptococcus and show that PIGs are actually located near TIGs in the metabolic network – but only during nutrient depletion, while antibiotic stress erases the linkage. This pattern – a coordinated response to metabolic stress and a disorganized response to antibiotics – is not unique to S. pneumoniae, as we demonstrate with previously published Tn-Seq and RNA-Seq data for the Gram-negative, free-living pathogen Pseudomonas aeruginosa. A further meta-analysis of hundreds of gene expression studies for both organisms shows that PIGs and essential genes (EGs) seem to be shielded from large transcriptional fluctuations. PIGs and EGs are thus organizationally separated from transcriptionally plastic TIGs. This separation may protect the organism from erratic responses to unprecedented stresses that have not shaped the gene network over evolutionary-time. Importantly, we provide a detailed roadmap to develop similar systems-level approaches in other microorganisms. Our approach profiles and reconciles transcriptomic and mutant fitness datasets and maps an organism’s full physiologic stress response. Moreover, this study emphasizes that the value of transcriptional profiles for identifying phenotypically important genes depends heavily on the experimental context.
RESULTS AND DISCUSSION
Designing a robust nutrient depletion assay for S. pneumonia
To identify links between the phenotypic and transcriptional stress response networks, we examined the response to nutrient depletion, a stressor that has significantly shaped the genomic network over evolutionary-time. Since the non-motile, obligate pathogen S. pneumoniae cannot survive outside of or actively move within a host, it must have mechanisms in place to tolerate local nutrient shortages. To avoid bias that might result from genomic variation among strains, we selected three strains to represent S. pneumoniae: TIGR4 (T4), Taiwan-19F (19F) and D39 (Table S1; Figure S1). The three strains share 1647 genes, while T4 has 217, 19F has 140 and D39 has 93 strain-specific genes (Table S2; Supplementary File 1). To simulate nutrient depletion, we designed three increasingly restrictive media. The first, semi-defined minimal media (SDMM), is relatively rich containing a single carbon source, yeast extract, digested amino acids, salts, trace metals, and vitamins (van Opijnen and Camilli, 2012; van Opijnen et al., 2016; Table S3). The second, a chemically defined media (CDM), is less nutrient rich than SDMM but still contains several non-essential components and permits growth by all three strains at slightly slower rates compared to SDMM (Table S3). By iteratively removing components of CDM, we created a minimal CDM, or MCDM, that decreases the growth rate even further, while removing any component triggers severe growth defects in at least one strain (Supplementary File 2).
Genome-wide fitness and expression profiling reveal the phenotypic and transcriptional importance of cellular processes upon nutrient depletion
S. pneumoniae’s response to nutrient depletion stress was profiled using Tn-Seq, which quantifies a gene’s effect on the growth rate (fitness; van Opijnen and Camilli, 2013), and RNA-Seq, which measures gene expression by quantifying transcript abundance. Six transposon insertion libraries for each strain were grown in each media to generate a comprehensive genotype-phenotype map for each strain/environment pair (Supplementary File 3). Genome-wide gene expression was measured for each strain/media pair by sampling four replicates from mid-exponential phase cells. Each sample contained reads mapping to 88–96% of all annotated genes in the corresponding genome, and transcript abundance between genes varied by nearly 105 (Supplementary File 3).
Comparing the raw expression value (i.e. transcript abundance, not fold change) with fitness revealed that most genes with a fitness defect are highly expressed (Figure 1a). However, this pattern is of little predictive value, since the majority of highly expressed genes do not have a fitness defect (or increase), and thus transcript abundance alone is not predictive of a gene’s importance (fitness). Of the few genes with low fitness and relatively low expression, most lack an annotated function (Figure 1a), while the low fitness, low expression genes with annotations are mostly metabolic enzymes (Figure 1a).
Figure 1.

High-resolution profiles of gene expression and fitness responses during stress incurred by nutrient depletion. Fitness values from Tn-Seq and transcript abundance from RNA-Seq were measured for three S. pneumoniae strains (19F, T4, and D39) and in three media conditions (SDMM, CDM, and MCDM). A. By plotting Tn-Seq and RNA-Seq data on the same graph it becomes clear that genes with a significant fitness defect (see methods for significance determination, but fitness (W) is at least < 0.85) are highly expressed. With relatively few exceptions, genes important for growth in an environment are maintained at high transcript abundance. Of the few genes with fitness defects and low expression, most have unknown function (indicated by a triangle). The low-fitness, low-expression genes with known functions (indicated by a circle) include metabolic enzymes such as: a.) SP1296/SPT0930, chorismate mutase; b.) SP0313, glutathione peroxidase; and c.) SPD1663, trehalose-6-phosphate hydrolase. B. A strong correlation between Tn-Seq fitness and fitness calculated from individual mutant growth curves or 1×1 competitions (Wvalidation; n = 122; shown are mean ± SEM; linear fit yields R2 > 0.82) emphasizes that the profiles are composed of high-confidence Tn-Seq data. (NB. RNA-Seq validation is shown in Table S5.)
With any high-throughput experiment, the resulting datasets require careful validation. Tn-Seq data were validated by constructing 31 individual gene deletion mutants for monoculture growth and 1×1 competition assays. In total 122 genotype-phenotype relationships were validated across strains and growth media. This large validation set resulted in a strong correlation (R2 = 0.82), similar to correlations we achieved previously (van Opijnen and Camilli, 2012; van Opijnen et al., 2016) and confirms high-confidence Tn-Seq fitness data (Figure 1b; Table S4). Additionally, qPCR, validated the RNA-Seq data across strains and media (Table S5).
Identifying genetic drivers of the nutrient stress response
By comparing fitness across environments we determined which genes changed their fitness (Δfitness, or ΔW) as S. pneumoniae transitioned from rich media (SDMM) to defined (CDM) or minimal (MCDM) media (Figure 2a, Supplementary File 3). Genes whose importance increases upon nutrient depletion will have a decreased fitness (i.e. a negative Δfitness) in the more restrictive media, and those genes whose importance decreases will have an increased fitness (i.e. a positive Δfitness). Following a change from SDMM to either CDM or MCDM, each strain had an average of 12 genes increase in fitness and 29 genes decrease in fitness. For example, gene SP1555 (dihydrodipicolinate reductase) is a key enzyme for lysine biosynthesis. A deletion of SP1555 blocks de novo lysine synthesis and should hamper S. pneumoniae’s ability to overcome the depletion of extracellular lysine in CDM and MCDM. Indeed, Tn-Seq data show that SP1555 has no fitness defect in rich media (SDMM: WSP1555 = 0.95), but shows decreasing fitness, and thus increasing importance, in the more stringent media (CDM: WSP1555 = 0.78, ΔWSP155 = − 0.17; MCDM: WSP155 = 0.07, ΔWSP155 = − 0.71).
Figure 2.

Changes in fitness and expression occur across all strains, media, and cellular subsystems. A. Δfitness (ΔW) depicts how genes change their fitness as a strain transitions from rich media (SDMM) to defined (CDM) or minimal (MCDM) media. B. Shown are how genes change their expression as a strain transitions from rich media (SDMM) to defined (CDM) or minimal (MCDM) media. Expression is log2 fold change in transcript abundance from RNA-Seq. In both figures statistically significant changes are colored and both assays were performed on three S. pneumoniae strains (T4, 19F, and D39) and two media transitions (SDMM→CDM, SDMM→MCDM). C. S. pneumoniae genes were classified into one of sixteen categories based on the strain’s genome annotation. Percentage of genes in each category with significant changes are shown in fitness (red) and expression (green). For the total number of genes in each category (by strain), see Table S2.
Genes with expression changes were identified by comparing transcript abundances between SDMM and either CDM or MCDM (Figure 2b). On average, the media shift caused 101 genes to significantly increase expression and 125 genes to decrease expression. Overall, 5.4 times more genes showed significant expression changes compared to significant fitness changes. Importantly, in both the Tn-Seq and RNA-Seq datasets, the significant changes were distributed across a variety of cellular subsystems, indicating that nutrient depletion triggers network-wide stress (Figure 2c). Among metabolic subsystems, amino acid pathways are especially well represented, with 17% of genes showing a fitness change and 23% of genes being differentially expressed (Supplementary File 3).
Genome-wide data visualization with a metabolic model reveals that transcriptional and phenotypic stress networks are distinct but co-localized
A large fraction of the S. pneumoniae genome is dedicated to metabolism, and a number of metabolic enzymes have been linked to the bacterium’s phenotypic stress response to nutrient and antibiotic perturbations (van Opijnen and Camilli, 2012; van Opijnen et al., 2016). Given the large number of metabolic genes with fitness or expression changes in our nutrient depletion profiles (Figure 2c), we focused on metabolic pathways to identify patterns in the S. pneumoniae stress response. To systematically analyze S. pneumoniae’s metabolism, a genome-scale metabolic model was assembled. A draft metabolic model was created with KBase (http://kbase.us) from the annotated genomes for T4, 19F, and D39. The model was gap-filled (Satish Kumar et al., 2007) to include non-enzymatic and misannotated reactions, and to ensure growth of the model on SDMM, CDM, and MCDM. Pathways in the model were manually curated by comparing reactions and gene associations to KEGG (Kanehisa et al., 2011) and BioCyc (Karp et al., 2015), with a particular emphasis on amino acid and nucleotide metabolism (Supplemental Experimental Procedures; Supplementary File 4). The final model, called iSP16, details the interconversion of 866 metabolites by 928 reactions, catalyzed by 463 genes (all genes with a metabolic annotation, or 43.9% of all ORFs in T4). To our knowledge, iSP16 is the first curated, genome-scale metabolic model of a pathogen in the genus Streptococcus.
Using iSP16, we searched for patterns in the location of fitness and expression changes during nutrient stress. Naively, one might expect the Tn-Seq and RNA-Seq data to align, as in cases where increasing expression of an important metabolic enzyme can increase flux through a pathway (Fell, 1997). However, overlaying our datasets onto the network shows that, when transitioning from SDMM to CDM, metabolic pathways either change on the transcriptional or phenotypic level, but they almost never change in the same location (Figure 3a). Moreover, upon transitioning to MCDM, the clusters of fitness or expression changes expand, but they almost never merge (Figure 3b). Our data on S. pneumoniae thus confirms that phenotypically (PIGs) and transcriptionally (TIGs) important stress response genes are distinct, which may indeed be a general phenomenon across different (microbial) species (Birrell et al., 2002; Smith et al., 2006; Deutschbauer et al., 2011; Denman et al., 2014; Turner et al., 2014; Keren et al., 2016).
Figure 3.

Genes with significant changes in expression (green), fitness (red), or both (blue) are distributed throughout the iSP16 metabolic model. Lines indicate reactions connecting metabolites (circles). Minor and currency metabolites are not shown (see Supplemental Experimental Procedures). Reactions are colored based on gene associations in the iSP16 model. A. Changes caused by a media shift from semi-defined (SDMM) to defined (CDM) media. B. Changes caused by a media shift from defined (CDM) to minimal (MCDM) media. Highlighted boxes denote pathways featured in subpanels of Figure 4.
Strikingly, the networks show that TIGs and PIGs seem to be co-localized, with many fitness changes adjacent to expression changes (Figure 3). A clear example of the coordination between fitness and expression changes is the shikimate pathway, the biosynthetic route for the aromatic amino acids (Figure 4a). Beginning with the glycolytic and pentose phosphate pathway intermediates phosphoenol-pyruvate (PEP) and erythrose-4-phosphate (E4P), the shikimate pathway uses seven enzymatic reactions before branching in sub-pathways specific for tryptophan (Trp), phenylalanine, and tyrosine. The branch point occurs immediately after gene SP1374, with gene SP1816 catalyzing the first reaction of the Trp-specific branch (Figure 4a). Compared to SDMM, CDM contains reduced tryptophan, and MCDM contains no tryptophan (Table S3). We expected that the removal of Trp would cause increased expression of the shikimate pathway to compensate for the absence of Trp and decreased fitness when any of the pathway’s genes are interrupted. Although this pathway shows both fitness and expression changes in our data, the fitness changes are restricted to the genes above the branch into tryptophan synthesis (SP1700 - SP1374), while the expression changes are below the branch point (SP1817 - SP1812) (Figure 4a). The sole biosynthetic route to tryptophan thus contains disjoint sets of genes with fitness and expression changes, indicating that a single pathway can be split between the phenotypic and transcriptional stress responses.
Figure 4.

Individual pathways are partitioned into sub-pathways with either fitness or expression changes. A. Changes in gene expression and fitness are separated in the tryptophan biosynthesis branch of the shikimate pathway. Single and double-headed arrows indicate reversibility or non-reversibility of individual chemical reactions, respectively, while arrows spanning two genes indicate enzymatic subunits catalyzing the same reaction. The dashed blue line (between SP1374 and SP1816) indicates the branch point into tryptophan biosynthesis. The opposite pattern appears in the riboflavin pathway (B), where expression changes lie upstream of two reactions catalyzed by an essential gene (SP1110). PEP = phosphoenol-pyruvate, E4P = D-erythrose-4-phosphate, Trp = L-tryptophan. Genes with statistically significant changes in fitness or expression are highlighted in red.
The nutrient depletion data contain other examples where phenotypically important genes co-localize with transcriptional changes. However, it is not always the case that fitness changes are upstream of expression changes. For instance, the riboflavin synthesis pathway contains a set of differentially expressed genes (SP0175 - SP0178) in the top of the pathway followed by a likely essential gene (SP1110) that is not differentially expressed when riboflavin is removed from the media (CDM→MCDM; Figure 4b).
Cellular networks link changes in gene expression and fitness
To visualize the correspondence between all fitness and expression changes (not just those genes in the iSP16 metabolic model), we plotted the change in expression versus the change in fitness for all three strains across both media shifts (SDMM→CDM and CDM→MCDM). If a gene is both differentially expressed and phenotypically important, it will lie somewhere off the horizontal and vertical axes in the plot of expression vs. fitness changes (Figure 5a, blue point). Genes with only a fitness change or only an expression change lie along the horizontal or vertical axes (Figure 5a, red and green points). Similar to genes in the metabolic model (Figure 3), there is no direct relationship between fitness and expression changes in the genome-wide data (Figure 5b). Almost all genes appear on either the horizontal or vertical axes of Figure 5b, indicating that a gene’s change in expression is a poor predictor of its importance to the organism’s growth rate, and vice versa.
Figure 5.

Fitness and expression changes do not occur on the same gene but are co-localized in a stress-dependent manner. A. When plotting changes in gene expression (RNA-Seq: Δexpression) vs. changes in fitness (Tn-Seq: Δfitness (ΔW)), genes with only fitness changes appear along the horizontal axis (red dot); genes with only expression changes appear along the vertical axis (green dot); and genes with both fitness and expression changes appear away from both axes (blue dot). B. Expression vs. fitness changes for S. pneumoniae during nutrient depletion. For each data point (gene) Δfitness (ΔW) and Δexpression are plotted depicting how a gene’s fitness and expression change as a strain transitions from rich media (SDMM) to defined (CDM) or minimal (MCDM) media. C. Metabolic models can be used to quantify distances between reactions and genes. For instance, the distance between the subunits pgmA and pgmB in glycolysis is zero, while either enzyme has a distance one to eno and a distance two to pyk. D. Pairs of PIGs and TIGs are separated by short distances during nutrient stress. E. To identify pairs of genes with both large Δfitness and Δexpression, the magnitude of the fitness change is multiplied by the magnitude of the nearest expression change. The product (blue box) is maximized when both the fitness and expression changes are large. If either Δexpression or Δfitness is small, the product is also small (F). G. The product Δexpression• Δfitness decays with distance between the gene and its nearest neighbor, indicating that changes are closely located within the network and that the largest changes in fitness are close to the largest expression changes. H. During antibiotic stress, Δexpression and Δfitness are uncorrelated similar to nutrient depletion stress. However, the coordination between Δexpression and Δfitness is lost; i.e. pairs of PIGs and TIGs are farther apart (I), and the largest PIGs with the largest fitness changes are no longer closest to the TIGs with the largest expression changes (J). Thus, metabolic transcriptional and phenotypic stress responses appear coordinated during nutrient stress, but uncoordinated during antibiotic stress.
The problem with plots like Figure 5b, and similar ones from other studies (Giaever et al., 2002; Price et al., 2013; Turner et al., 2014), is that they ignore the network context. There is no obvious way to assemble a complete intracellular network, so we are currently unable to do a topological genome-wide analysis such as in Figure 3. However, we may be able to extract additional patterns from our metabolic network to help comprehend the complete dataset. For instance, we wondered whether the magnitude of how PIGs and TIGs respond to stress is a function of the network distance between these genes, i.e. are genes with large phenotypic changes closer to genes with large transcriptional changes? We quantified the distances between genes in the metabolic network by counting the number of reactions between enzymes (Figure 5c). For instance, genes associated with the same reaction have a distance of zero, while genes associated with reactions that share a common metabolite have a distance of one. The majority of fitness and expression changes pair at short distances, with 80% of all pairs within a distance of two, and 93% within a distance of three (Figure 5d). These distances are significantly smaller than expected if the PIGs and TIGs were placed randomly on the network (Figure S2). Although the PIGs and TIGs are close to one another, we wondered if the PIGs with the largest fitness changes were closest to the TIGs with the largest expression changes. To quantify the “interaction” between the PIGs and TIGs we multiplied their magnitudes, a technique commonly used to test for interactions between independent variables in statistical models (Gelman 2007) (Figure 5e). The product of the fitness and expression changes is maximized when both the fitness and expression changes are large, and it is near zero when either the fitness or expression change is small (Figure 5f). Focusing on the magnitudes of the changes captures pairs with either opposite signs (e.g. increasing expression next to a phenotypically important gene) or the same sign (e.g. decreased expression at a branch point that re-routes flux toward an important gene in the other branch). By plotting the fitness-expression product against the distance between the corresponding genes (Figure 5g), we see that the size of the fitness and expression changes in each pair decreases with distance (p < 0.005, ANOVA). This analysis thus shows quantitatively what is visually suggested in Figure 3; fitness and expression changes occur in distinct, but co-localized genes. Moreover, the largest changes in fitness are close to the largest expression changes, which means that fitness and expression changes are not only co-located, but have a magnitude comparable to that of their neighbors.
Antibiotic stress creates incoherence between phenotypic and transcriptional responses
It appears that S. pneumoniae contains two separate, but coordinated, networks that respond to nutrient depletion (the TIGs and the PIGs). Limited nutrient availability is a common stress for bacteria such as S. pneumoniae – an obligate human pathogen that only grows in the human host and cannot actively move to other niches. Thus nutrient stress has arguably influenced S. pneumoniae’s evolution. In contrast, pathogens like S. pneumoniae have only been exposed to modern antibiotics for less than a century, and we wondered whether transcriptional and phenotypic responses to antibiotics, a much more “unfamiliar” stress, are similarly coordinated.
Using Tn-Seq and RNA-Seq, we profiled the response of S. pneumoniae strains T4 and 19F to four antibiotics from different mechanistic classes: daptomycin, levofloxacin, penicillin G, and vancomycin (Supplementary File 3). We and others have shown that the effects of antibiotics extend far beyond their direct targets to genes in energy generation, cell division, membrane integrity, and metabolic pathways (van Opijnen and Camilli, 2012; van Opijnen et al., 2016; Belenky et al., 2015; Lobritz et al., 2015). Importantly, the same general patterns emerged for individual genes in the antibiotic profiles, i.e. genes with fitness defects are highly expressed (Figure S3), and TIGs and PIGs rarely overlap (Figure 5h). The separation between PIGs and TIGs holds even in the pathways directly targeted by the antibiotics (Figure S4). As with the nutrient depletion stress, the paired genes are not randomly distributed (Figure S2), but the pairs during antibiotic stress are on average farther apart (Figure 5i). The phenotypic and transcriptional responses also include metabolic genes enabling the same co-localization vs. magnitude analysis as in Figure 5g. Surprisingly, in response to antibiotics the association is entirely lost; i.e. paired genes are farther apart and the size of the fitness or expression changes does not depend on how close the genes are in the metabolic network (Figure 5j). And while during nutrient depletion the largest fitness and expression changes occur on adjacent genes in the metabolic network indicating a coordinated response (Figure 5g), during antibiotic stress the largest fitness and expression changes are no longer adjacent, potentially indicating a lack of coordination between the transcriptional and phenotypic stress response networks.
Coordinated metabolic and erratic antibiotic responses are not unique to S. pneumonia
To test whether our findings are a unique feature of S. pneumoniae, we repeated our analysis using the Gram-negative bacterium Pseudomonas aeruginosa, which is motile, free-living, has a highly flexible metabolism (anaerobic and aerobic), and a larger genome (~6.4 Mb) (Schmidt et al., 1996) than S. pneumoniae (~2.1 Mb) (Tettelin et al., 2001). We analyzed an existing metabolic model for P. aeruginosa (Bartell et al., 2017) using previously published Tn-Seq and RNA-Seq profiles for 18 antibiotics (Murray et al., 2015) and a metabolic shift from in vitro minimal media to in vivo wound infection (Turner et al., 2014). These data used two different strains of P. aeruginosa: PA14 for the antibiotic experiments and PAO1 for the metabolic studies.
Overall, P. aeruginosa shows the same patterns as S. pneumoniae. There is little overlap between the Tn-Seq or RNA-Seq data (PIGs and TIGs) when examined on the single gene level (Figure 6a–b). The in vivo experiments (Figure 6a) show significantly greater experimental variability in both fitness and expression than the in vitro data (Figure 6b), which is consistent with other Tn-Seq studies. Like S. pneumoniae, the PIGs and TIGs are closer during metabolic stress than during antibiotic stress (Figure 6c,e). The arrangement of PIGs and TIGs in P. aeruginosa also cannot be explained by chance (Figure S2).
Figure 6.
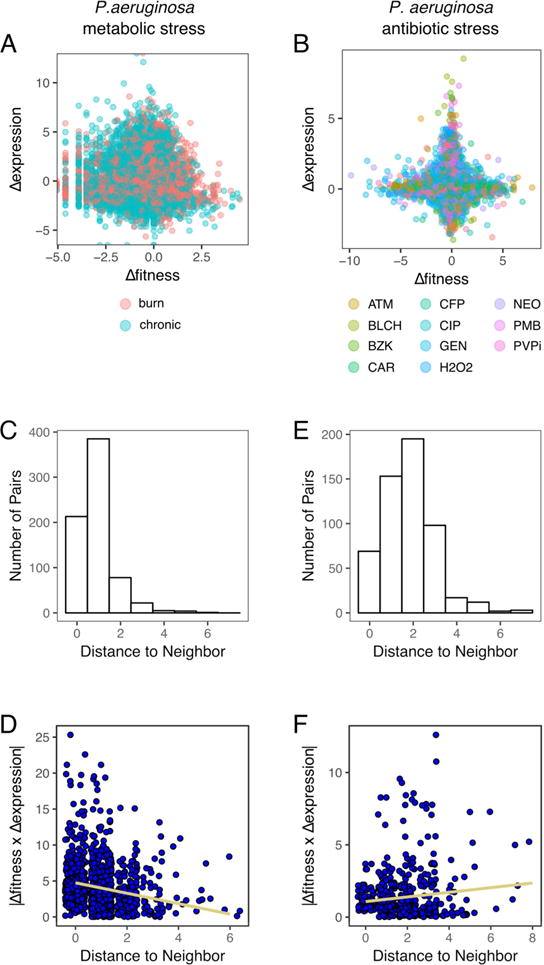
Pseudomonas aeruginosa confirms patterns found in S. pneumoniae. No correlation exists between fitness and expression changes during metabolic (A) or antibiotic (B) stress. Paring PIGs and TIGs in the metabolic stress data indicate that the largest phenotypic and transcriptional changes are nearby (C,E); however, just as for S. pneumoniae, the PIGs and TIGs move farther apart during antibiotic stress (D), and the largest fitness and expression changes are no longer adjacent (F).
When P. aeruginosa PAO1 undergoes nutrient depletion, we observe the same coordination between TIGs and PIGs as we found in S. pneumoniae (Figure 6d); i.e. transcriptionally and phenotypically important genes are co-located at short distances from one another, and the largest changes in fitness are close to the largest expression changes. Since P. aeruginosa moves regularly between the environment and the human host, we expected the metabolic network to be tuned to this stress, and indeed our analysis shows a coordinated response in P. aeruginosa comparable to the nutrient depletion response in S. pneumoniae.
Moreover, when strain PA14 is subjected to antibiotic stress, the coordination between PIGs and TIGs is also lost (Figure 6f). And thus just as we observed with S. pneumoniae, the average distance between TIGs and PIGs increases, and the PIGs with the largest fitness changes are no longer closest to the TIGs with the largest expression changes, but are still not randomly distributed (Figure S2). Thus the metabolic networks of two very different bacteria appear to share similar patterns in their stress responses – TIGs and PIGs are separate, but function together during nutrient depletion, while, during antibiotic stress, PIGs are no longer accompanied by a corresponding TIG.
Genome-wide meta-analysis reveals partitioning of phenotypic and transcriptomic stress responses across multiple conditions
We asked two questions about the generalizability of the relationship between PIGs and TIGs: 1.) is this split between PIGs and TIGs specific to the stresses we tested, and 2.) are PIGs and TIGs always disjoint, i.e. do PIGs ever show a transcriptional response?
We devised an experiment to answer these questions without a network model for the entire genome by performing a meta-analysis using all publicly available S. pneumoniae and P. aeruginosa datasets in the Gene Expression Omnibus (GEO) database. From 234 GEO S. pneumoniae experiments (Supplemental Experimental Procedures), we calculated the “expression plasticity” for each gene across a wide range of genetic and environmental perturbations (Figure 7a). Expression plasticity is the relative variance in expression of a gene across all experiments in the GEO dataset. Genes with low plasticity rarely vary in their expression level, while high plasticity genes can vary widely in their expression across conditions. If the observed disconnect between PIGs and TIGs is independent of the type of environmental stress, we expect PIGs (and essential genes [EGs], which are important for any condition) to have low plasticity. Plotting the GEO expression plasticity against the size of the fitness change in our experiment indeed reveals that genes with the largest fitness changes have the lowest plasticity (Figure 7b). This pattern holds not only for PIGs, but also for EGs (Supplementary File 5) (Figure 7c). Moreover, both observed patterns hold when we repeated the analysis using 214 GEO submitted P. aeruginosa experiments; i.e. the genes with the largest fitness changes have the lowest plasticity (Figure 7d), and conditionally essential and EGs on average show lower plasticity than all other genes (Figure 7e). Thus, not only do most PIGs have no expression change in our experiments, they also have relatively constant expression across all the experiments in GEO. This suggests that the partitioning of the phenotypic and transcriptional stress responses extends far beyond nutrient depletion and antibiotic stress and that transcriptional profiles alone fail to identify a large number of phenotypically important genes.
Figure 7.

Meta-analysis shows that essential and phenotypically important genes are shielded from large changes in expression. A. Quantifying gene expression plasticity using meta-analysis of GEO expression studies. Plasticity is the normalized variance in gene expression across all S. pneumoniae or P. aeruginosa data in GEO (see Supplemental Experimental Procedures), which means that genes that change often in expression have a high plasticity while genes that almost never change have a low plasticity. B. Gene expression plasticity decreases with increasing magnitude of the fitness change (relative to SDMM). Thus the amount of shielding is proportional to a gene’s phenotypic importance, and genes with the largest fitness changes show the smallest variation in expression across the experiments in GEO. C. Gene expression plasticity is significantly lower for essential genes (p < 10−14) and conditionally essential genes (genes with a significant fitness change) (p < 10−34, both comparisons t-test on lognormal distributions; log-normality confirmed by Shapiro-Wilke test with p < 10−12). Both the essential and conditionally essential genes appear to be shielded from transcriptional changes not only in our RNA-Seq data, but across all the expression datasets in GEO. D. In P. aeruginosa, genes with fitness changes also show decreased plasticity, and, similar to S. pneumoniae, (conditionally) essential genes appear to be shielded from transcriptional changes across all the expression datasets in GEO (E).
CONCLUSIONS
Our analysis demonstrates how genome-scale metabolic models can link fitness and expression changes. Although changes in transcription and functional importance (i.e. growth rate in our study) occur on separate sets of genes, these sets of genes are either in the same or closely related pathways. This pattern is consistent with theories on metabolic control, where the relative importance of enzyme or substrate changes can vary along a pathway (Heinrich and Schuster, 1996; Fell, 1997). In our example of the shikimate pathway (Figure 4a), the upper half of the pathway (SP1371-SP1377) may be controlled by substrate abundance, while flux through the amino acid-specific branches (e.g. SP1811-SP1818) may be controlled by enzyme abundance. Interestingly, all of the reversible reactions in the shikimate pathway occur before the branch point (Figure 4a), and the (reversible) enzymes above the branch point are not differentially expressed. Reversibility allows pathway intermediates to control flux through feedback mechanisms, possibly lessening the importance of transcriptional control in the upper branch. By deferring most of the transcriptional control until the lower branches of the shikimate pathway, S. pneumoniae may be able to control the production of Trp separately from the other aromatic amino acids while still maintaining adequate flux through the upper branch via substrate-level feedback.
Initially we expected that identifying PIGs would be an obvious way to identify genes that change in expression. Even though this turns out to be mostly an exception, it is important to consider that some genes need only be expressed above a “threshold” level, requiring no change in expression to be phenotypically important. Such genes would not be identified as TIGs, but they would show a fitness change when disrupted. The high expression levels of genes with fitness defects (Figure 1a) could also lead to more stable expression levels, reducing plasticity of the PIGs and EGs (Figure 7). Unfortunately, we cannot quantify the absolute expression levels from the microarray data in GEO to test this hypothesis. It is similarly possible that genes are differentially expressed without a fitness change, e.g. where the efficiency savings from not using regulatory machinery would compensate for the cost of producing unnecessary transcripts.
Our findings raise several important considerations for therapeutic targeting of the bacterial stress response. Drug target identification has heavily relied on transcriptomic data as a surrogate for functional importance (Liu et al., 2006; Mizuarai et al., 2009; Chen et al., 2012; Mukhopadhyay et al., 2012; Sun, 2012; Patil et al., 2013; Fadhal et al., 2014). However, the poor correlation between transcriptional change and functional importance seems universal among bacteria (Giaever et al., 2002; Price et al., 2013; Turner et al., 2014). Our results argue that the nature of the stressor determines if transcriptional profiles can be used to predict PIGs. Transcriptional profiles of “coherent” stresses, e.g. nutrient depletion for a metabolic network, identify differentially expressed genes that are likely connected to a nearby phenotypically important gene. By contrast, (metabolic) genes that are differentially expressed during an “incoherent” stress (like antibiotics) may not be related to any phenotypically important genes or pathways.
The stress-dependent relationship between transcription and fitness provides an opportunity to understand the evolutionary design of genome-scale networks. For instance, the proximity of the transcriptional and phenotypic stress response profiles may indicate how well an applied stress matches the selective pressures the network has evolved under. Moreover, expression plasticity meta-analysis suggests that a bacterium’s ability to modulate expression is evolutionarily pre-programmed. The pre-programming may protect phenotypically important parts of the cell from erratic transcriptional behavior while preserving overall plasticity. Conversely, bacteria may have no “choice” when the transcriptional response network modulates expression of genes that are not contributing to overcoming stress. The transcriptional response to antibiotics, for example, may include differentially expressed genes that are unrelated to antibiotic stress or confer no fitness advantage. While the transcriptional response may look erratic, it is only a short-term sacrifice to ensure long-term stability of the population that undergoes a wide range of stresses.
Dual profiling by RNA-Seq and Tn-Seq may be a tool for understanding cellular objectives when analyzing large networks, provided a mathematical model is available. Importantly, this model should not only describe the regulatory relationships within the network but also the genetic interactions between genes. A network assembled only from transcriptional responses (gene expression data) would, based on our results, exclude many phenotypically important genes. Conversely, designing cellular networks based on fitness profiles would miss genes that undergo large expression changes. We thus believe that applying network topological analyses to contextualize high-throughput experiments has the potential to provide value in genetic engineering, predicting drug target candidates, and re-evaluating current drug targets with the goal to achieve a higher success rate in developing novel strategies to eradicate microbial pathogens.
METHODS
Strains, growth and media
Experiments were performed with S. pneumoniae strains TIGR4 (T4; NC_003028.3), Taiwan-19F (19F; NC_012469.1), and D39 (NC_008533). Both T4 and 19F can cause invasive pneumococcal disease (IPD): T4 is a serotype 4 strain originally isolated from a Norwegian patient with IPD (Aaberge et al., 1995; Tettelin et al., 2001); 19F is a multi-drug resistant strain isolated from a patient with IPD in Taiwan (Shi et al., 1998; McGee et al., 2001) (Table S1). D39 is a historically important and commonly used serotype 2 strain that was originally isolated from a patient 90 years ago (Lanie et al., 2006) (Table S1). All gene numbers refer to the T4 genome, except the unique genes, which are preceded by SP, SPT, and SPD for T4, 19F, and D39, respectively. Supplementary File 1 describes a “correspondence table” matching homologous genes amongst strains. Single gene knock-out strains were constructed with chloramphenicol (4 μg/mL) or spectinomycin (200 μg/mL) resistance cassettes as described previously (Iyer et al., 2005; van Opijnen et al., 2009; van Opijnen and Camilli, 2012). Unless otherwise noted, S. pneumoniae was cultivated statically in Todd Hewitt broth with 5% yeast extract and 5 μL/mL of Oxyrase (Oxyrase, Inc), or on sheep’s blood agar plates at 37°C with 5% CO2. Tn-Seq and RNA-Seq experiments were performed in three growth media that contain decreasing nutrient levels: semi-defined minimal medium (SDMM) (van Opijnen and Camilli, 2012), chemically defined medium (CDM; Table S3) and minimal chemically defined medium (MCDM; Table S3).
Tn-Seq library construction and selection experiments
Six independent transposon libraries were constructed in T4, 19F, and D39.as previously described with the transposon Magellan6 (van Opijnen et al., 2009; van Opijnen and Camilli, 2012; van Opijnen et al., 2015). Tn-Seq experiments were performed with each transposon library for each of the three strains under the three media conditions (SDMM, CDM, and MCDM) and in SDMM with four antibiotics: 25 μg/mL of daptomycin (Biotang), 0.5 μg/mL of levofloxacin (TCI), 0.1 μg/mL of vancomycin (MP Biomedicals), 0.03 μg/mL of penicillin G (Sigma-Aldrich) for T4 and 7.5 μg/mL of penicillin G for Taiwan-19F. At these concentrations, the growth rate of both wild type strains is reduced by ~30%, similar to previous studies (van Opijnen and Camilli, 2012; van Opijnen et al., 2016).
Tn-Seq sample preparation and analysis
Sample preparation, Illumina sequencing, and fitness calculations were performed as previously described (van Opijnen et al., 2006; van Opijnen et al., 2009; van Opijnen and Camilli, 2012; van Opijnen and Camilli, 2013). For each insertion, fitness (Wi) representing the growth rate is calculated by the change in frequency for the mutant in the population (van Opijnen et al., 2006). Fitness for single genes is calculated by averaging Wi over all the insertions in each gene. Genes identified as having significant fitness changes must: 1.) be calculated from at least three data points (insertions), 2.) have a fitness difference larger than 15% (|Wi − Wj| > 0.15), and 3.) be significantly different when assessed by one sample t-test with Bonferroni correction for multiple testing.
Competition and single strain growth assays
1×1 competition experiments were performed by mixing a single gene knock-out strain with the corresponding wild type strain as previously described (van Opijnen and Camilli, 2012). Fitness was then calculated using the same approach as Tn-Seq by determining the ratios of the competing strains at the start and end of the competition and determining the expansion of the population using CFU counts. Single-strain growth assays were performed in 96-well plates using a Tecan Infinite 200 PRO plate reader. Both competition and single-strain growth assays were performed no fewer than three times.
RNA-Seq sample collection
Under nutrient depletion conditions, the three strains were grown in each of the three growth media in four biological replicates. In antibiotic treatment experiments, the strains T4 and 19F were grown in four biological replicates in SDMM with each of the four antibiotics: 25 μg/mL of daptomycin, 0.7 μg/mL of levofloxacin, or 0.03 μg/mL of penicillin G for T4; 7.5 μg/mL of penicillin G for 19F, and 0.12 μg/mL of vancomycin for T4 and 19F. 5 mL of early/mid-log phase liquid culture was harvested by centrifugation at 4°C, snap frozen, and stored at −80°C for RNA isolation. Total RNA was isolated using the RNeasy Mini kit (Qiagen).
RNA-Seq sample preparation and analysis
cDNA libraries were generated following the RNAtag-Seq protocol (Shishkin et al., 2015). Briefly, 400 ng of RNA was fragmented, depleted of genomic DNA using TURBO DNA-free kit (Ambion), 5′-dephosphorylated, and ligated to barcoded RNA adapters at the 3′-terminus. Barcoded RNA samples were pooled and purified with RiboZero (Illumina). The ribosomal RNA-depleted samples were then converted to Illumina cDNA sequencing libraries by first strand cDNA synthesis, 3′ linker ligation and PCR amplification and sequenced at high depth (3.5–16 million reads/sample) (Haas et al., 2012) on an Illumina NextSeq500. Raw reads were demultiplexed, trimmed to 40 base pairs, and quality filtered using custom R scripts and the ShortRead package. Reads were mapped to the corresponding S. pneumoniae genome using Bowtie (Langmead et al., 2009) with settings “-n 2 -l 60 -m 1 -B 1”. Reads were aggregated to genes using the GenomicRanges R package and differential expression was calculated using DESeq2 (Love et al., 2014).
qPCR expression analysis
400 ng of DNase-treated RNA was subjected to first strand cDNA synthesis. Quantitative PCR was performed using a BioRad MyiQ; each sample was measured in two biological replicates and three technical replicates. No-reverse transcriptase and no-template controls were included for each sample. Expression levels from all samples were normalized against the 50S ribosomal gene SP2204.
Computational analysis
Statistical analyses were performed in R. Gene distributions were fit to either Poisson (gene distance distributions) or Gamma (GEO plasticity) distributions using the fitdistr function in the MASS toolbox. Expected values of the distributions were compared by a t-test. Visualization of the iSP metabolic model was performed using MetDraw (Jensen and Papin, 2014). Details of the model reconstruction are available in Supplemental Experimental Procedures.
Supplementary Material
Supplementary File 1: Gene correspondence table for S. pneumoniae strains T4, 19F and D39. Related to Figure 1, Figure S1, Table S1.
Supplementary File 2: Growth of S. pneumoniae strains T4, 19F and D39 in different nutrient media: THY, SDMM, CDM, and MCDM. Related to Figure 1.
Supplementary File 5: Essential genes in S. pneumoniae strains T4, 19F and D39. Related to Figure 7.
Acknowledgments
This work was supported by the NIH R01 AI110724 and U01 AI124302. DNA sequencing was performed at the Boston College Sequencing Core.
Footnotes
Publisher's Disclaimer: This is a PDF file of an unedited manuscript that has been accepted for publication. As a service to our customers we are providing this early version of the manuscript. The manuscript will undergo copyediting, typesetting, and review of the resulting proof before it is published in its final citable form. Please note that during the production process errors may be discovered which could affect the content, and all legal disclaimers that apply to the journal pertain.
Accession Numbers. SRA: SRX2039176, SRX2039177, SRX2039178
The authors declare that they have no competing interests.
Authors’ contributions. PAJ led the computational experiments. ZZ led the wet-lab experiments. PAJ, ZZ, and TvO performed computational and wet-lab experiments. PAJ, ZZ, and TvO authors analyzed data, interpreted results, and wrote and approved the final manuscript.
References
- Aaberge IS, Eng J, Lermark G, Løvik M. Virulence of Streptococcus pneumoniae in mice: a standardized method for preparation and frozen storage of the experimental bacterial inoculum. Microbial Pathogenesis. 1995;18:141–152. doi: 10.1016/s0882-4010(95)90125-6. [DOI] [PubMed] [Google Scholar]
- Bao H, Kommadath A, Liang G, Sun X, Arantes AS, Tuggle CK, Bearson SMD, Plastow GS, Stothard P, Guan LL. Genome-wide whole blood microRNAome and transcriptome analyses reveal miRNA-mRNA regulated host response to foodborne pathogen Salmonella infection in swine. Sci Rep. 2015;5:e12620. doi: 10.1038/srep12620. [DOI] [PMC free article] [PubMed] [Google Scholar]
- Bartell JA, Blazier AS, Yen P, Thogersen JC, Jelsbak L, Goldberg JB, Papin JA. Reconstruction of the metabolic network of Pseudomonas aeruginosa to interrogate virulence factor synthesis. Nat Commun. 2017;8:14631. doi: 10.1038/ncomms14631. [DOI] [PMC free article] [PubMed] [Google Scholar]
- Belenky P, Ye JD, Porter CB, Cohen NR, Lobritz MA, Ferrante T, Jain S, Korry BJ, Schwarz EG, Walker GC, Collins JJ. Bactericidal antibiotics induce toxic metabolic perturbations that lead to cellular damage. Cell Rep. 2015;13:968–980. doi: 10.1016/j.celrep.2015.09.059. [DOI] [PMC free article] [PubMed] [Google Scholar]
- Birrell GW, Brown JA, Wu HI, Giaever G, Chu AM, Davis RW, Brown JM. Transcriptional response of Saccharomyces cerevisiae to DNA-damaging agents does not identify the genes that protect against these agents. PNAS. 2002;99:8778–8783. doi: 10.1073/pnas.132275199. [DOI] [PMC free article] [PubMed] [Google Scholar]
- Boone C, Bussey H, Andrews BJ. Exploring genetic interactions and networks with yeast. Nat Rev Genet. 2007;8:437–449. doi: 10.1038/nrg2085. [DOI] [PubMed] [Google Scholar]
- Butcher J, Stintzi A. The transcriptional landscape of Campylobacter jejuni under iron replete and iron limited growth conditions. PLoS ONE. 2013;8:e79475–79416. doi: 10.1371/journal.pone.0079475. [DOI] [PMC free article] [PubMed] [Google Scholar]
- CDC. Antibiotic Resistance Threats in the United States. 2013:1–114. [Google Scholar]
- Chatterjee A, Saranath D, Bhatter P, Mistry N. Global transcriptional profiling of longitudinal clinical isolates of Mycobacterium tuberculosis exhibiting rapid accumulation of drug resistance. PLoS ONE. 2013;8:e54717–54718. doi: 10.1371/journal.pone.0054717. [DOI] [PMC free article] [PubMed] [Google Scholar]
- Chen LC, Yeh HY, Yeh CY, Arias CR, Soo VW. Identifying co-targets to fight drug resistance based on a random walk model. BMC Syst Biol. 2012;19(6):5. doi: 10.1186/1752-0509-6-5. [DOI] [PMC free article] [PubMed] [Google Scholar]
- Denman CC, Robinson MT, Sass AM, Mahenthiralingam E, Brown AR. Growth on mannitol-rich media elicits a genome-wide transcriptional response in Burkholderia multivorans that impacts on multiple virulence traits in an exopolysaccharide-independent manner. Microbiology. 2014;160:187–197. doi: 10.1099/mic.0.072975-0. [DOI] [PubMed] [Google Scholar]
- Deutschbauer A, Price MN, Wetmore KM, Shao W, Baumohl JK, Xu Z, Nguyen M, Tamse R, Davis RW, Arkin AP. Evidence-based annotation of gene function in Shewanella oneidensis MR-1 using genome-wide fitness profiling across 121 Conditions. PLoS Genet. 2011;7:e1002385–1002317. doi: 10.1371/journal.pgen.1002385. [DOI] [PMC free article] [PubMed] [Google Scholar]
- Dixon SJ, Costanzo M, Baryshnikova A, Andrews B, Boone C. Systematic mapping of genetic interaction networks. Annu Rev Genet. 2009;43:601–625. doi: 10.1146/annurev.genet.39.073003.114751. [DOI] [PubMed] [Google Scholar]
- Drlica K, Malik M, Kerns RJ, Zhao X. Quinolone-mediated bacterial death. Antimicrob Agent Chemother. 2008;52:385–392. doi: 10.1128/AAC.01617-06. [DOI] [PMC free article] [PubMed] [Google Scholar]
- Fadhal E, Mwambene EC, Gamiedien J. Modelling human protein interaction networks as metric spaces has potential in disease research and drug target discovery. BMC Syst Biol. 2014;5:68. doi: 10.1186/1752-0509-8-68.. [DOI] [PMC free article] [PubMed] [Google Scholar]
- Feder ME, Walser JC. The biological limitations of transcriptomics in elucidating stress and stress responses. J Evolution Biol. 2005;18:901–910. doi: 10.1111/j.1420-9101.2005.00921.x. [DOI] [PubMed] [Google Scholar]
- Fell D. Understanding the Control of Metabolism. London: Portland Press; 1997. pp. 1–26. [Google Scholar]
- Floss HG, Yu TW. Rifamycin-mode of action, resistance, and biosynthesis. Chem Rev. 2005;105:621–632. doi: 10.1021/cr030112j. [DOI] [PubMed] [Google Scholar]
- Gawronski JD, Wong SM, Giannoukos G, Ward DV, Akerley BJ. Tracking insertion mutants within libraries by deep sequencing and a genome-wide screen for Haemophilus genes required in the lung. PNAS. 2009;106:16422–7. doi: 10.1073/pnas.0906627106. [DOI] [PMC free article] [PubMed] [Google Scholar]
- Gelman A, Hill J. Data analysis using regression and multilevel/hierarchical models. Cambridge: Cambridge University Press; 2007. [Google Scholar]
- Giaever G, Chu AM, Ni L, Connelly C, Riles L, Véronneau S, Sally D, Lucau-Danilla A, Anderson K, André B, et al. Functional profiling of the Saccharomyces cerevisiae genome. Nature. 2002:1–5. doi: 10.1038/nature00935. [DOI] [PubMed] [Google Scholar]
- Goodman AL, McNulty NP, Zhao Y, Leip D, Mitra RD, Lozupone CA, Knight R, Gordon JI. Identifying genetic determinants needed to establish a human gut symbiont in its habitat. Cell Host Microbe. 2009;6:279–289. doi: 10.1016/j.chom.2009.08.003. [DOI] [PMC free article] [PubMed] [Google Scholar]
- Guimaraes JC, Rocha M, Arkin AP. Transcript level and sequence determinants of protein abundance and noise in Escherichia coli. Nucleic Acids Research. 2014;42:4791–4799. doi: 10.1093/nar/gku126. [DOI] [PMC free article] [PubMed] [Google Scholar]
- Haas BJ, Chin M, Nusbaum C, Birren BW, Livny J. How deep is deep enough for RNA-Seq profiling of bacterial transcriptomes? BMC Genomics: BMC Genomics. 2012;13:734. doi: 10.1186/1471-2164-13-734. http://doi.org/10.1186/1471-2164-13-734. [DOI] [PMC free article] [PubMed] [Google Scholar]
- Heinrich R, Schuster D. The Regulation of Cellular Systems. Springer; 1996. [Google Scholar]
- Henriques-Normark B, Tuomanen EI. The Pneumococcus: epidemiology, microbiology, and pathogenesis. Cold Spring Harbor Perspectives in Medicine. 2013;3:a010215–a010215. doi: 10.1101/cshperspect.a010215. [DOI] [PMC free article] [PubMed] [Google Scholar]
- Iyer R, Baliga NS, Camilli A. Catabolite control protein A (CcpA) contributes to virulence and regulation of sugar metabolism in Streptococcus pneumoniae. J Bacteriol. 2005;187:8340–8349. doi: 10.1128/JB.187.24.8340-8349.2005. [DOI] [PMC free article] [PubMed] [Google Scholar]
- Jensen PA, Papin JA. MetDraw: Automated visualization of genome-scale metabolic network reconstructions and high-throughput data. Bioinformatics. 2014;30:1327–1328. doi: 10.1093/bioinformatics/btt758. [DOI] [PMC free article] [PubMed] [Google Scholar]
- Kanehisa M, Goto S, Sato Y, Furumichi M, Tanabe M. KEGG for integration and interpretation of large-scale molecular data sets. Nucleic Acids Research. 2011;40:D109–D114. doi: 10.1093/nar/gkr988. [DOI] [PMC free article] [PubMed] [Google Scholar]
- Karp PD, Billington R, Holland TA, Kothari A, Krummenacker M, Weaver D, Latendresse M, Paley S. Computational metabolomics operations at BioCyc.org. Metabolites. 2015;5:291–310. doi: 10.3390/metabo5020291. [DOI] [PMC free article] [PubMed] [Google Scholar]
- Keren L, Hausser J, Lotan-Pompan M, Vainberg Slutskin I, Alisar H, Kaminski S, Weinberger A, Alon U, Milo R, Segal E. Massively parallel interrogation of the effects of gene expression levels on fitness. Cell. 2016;166:1282–1294 e1218. doi: 10.1016/j.cell.2016.07.024. [DOI] [PubMed] [Google Scholar]
- Langmead B, Trapnell C, Pop M, Salzberg SL. Ultrafast and memory-efficient alignment of short DNA sequences to the human genome. Genome Biology. 2009;10:1–10. doi: 10.1186/gb-2009-10-3-r25. [DOI] [PMC free article] [PubMed] [Google Scholar]
- Langridge GC, Phan MD, Turner DJ, Perkins TT, Parts L, Haase J, Charles I, Maskell DJ, Peters SE, Dougan G, et al. Simultaneous assay of every Salmonella Typhi gene using one million transposon mutants. Genome Research. 2009;19:2308–2316. doi: 10.1101/gr.097097.109. [DOI] [PMC free article] [PubMed] [Google Scholar]
- Lanie JA, Ng WL, Kazmierczak KM, Andrzejewski TM, Davidsen TM, Wayne KJ, Tettelin H, Glass JI, Winkler ME. Genome sequence of Avery’s virulent serotype 2 strain D39 of Streptococcus pneumoniae and comparison with that of unencapsulated laboratory strain R6. J Bacteriol. 2007;189:38–51. doi: 10.1128/JB.01148-06. [DOI] [PMC free article] [PubMed] [Google Scholar]
- Liu M, Healy MD, Dougherty BA, Esposito KM, Maurice TC, Mazzucco CE, Bruccoleri RE, Davison DB, Frosco M, Barrett JF, et al. Conserved fungal genes as potential targets for broad-spectrum antifungal drug discovery. Eukaryotic Cell. 2006;5:638–649. doi: 10.1128/EC.5.4.638-649.2006. [DOI] [PMC free article] [PubMed] [Google Scholar]
- Lobritz MA, Belenky P, Porter CB, Gutierrez A, Yang JH, Schwarz EG, Dwyer DJ, Khalil AS, Collins JJ. Antibiotic efficacy is linked to bacterial cellular respiration. Proc Natl Acad Sci U S A. 2015;112:8173–8180. doi: 10.1073/pnas.1509743112. [DOI] [PMC free article] [PubMed] [Google Scholar]
- Love MI, Huber W, Anders S. Moderated estimation of fold change and dispersion for RNA-seq data with DESeq2. Genome Biology. 2014;15:31–21. doi: 10.1186/s13059-014-0550-8. [DOI] [PMC free article] [PubMed] [Google Scholar]
- McGee L, McDougal L, Zhou J, Spratt BG, Tenover FC, George R, Hakenbeck R, Hryniewicz W, Lefévre JC, Tomasz A, et al. Nomenclature of major antimicrobial-resistant clones of Streptococcus pneumoniae defined by the pneumococcal molecular epidemiology network. Journal of Clin Microbiol: American Society for Microbiology. 2001;39:2565–2571. doi: 10.1128/JCM.39.7.2565-2571.2001. [DOI] [PMC free article] [PubMed] [Google Scholar]
- Medini D, Donati C, Tettelin H, Masignani V, Rappuoli R. The microbial pan-genome. Curr Opin Genet Dev. 2005;15:589–594. doi: 10.1016/j.gde.2005.09.006. [DOI] [PubMed] [Google Scholar]
- Medini D, Serruto D, Parkhill J, Relman DA, Donati C, Moxon R, Falkow S, Rappuoli R. Microbiology in the post-genomic era. Nat Rev Microbiol. 2008;6:419–30. doi: 10.1038/nrmicro1901. [DOI] [PubMed] [Google Scholar]
- Mizuarai S, Yamanaka K, Itadani H, Arai T, Nishibata T, Hirai H, Kotani H. Discovery of gene expression-based pharmacodynamic biomarker for a p53 context-specific anti-tumor drug Wee1 inhibitor. Mol Cancer. 2009;8:34–12. doi: 10.1186/1476-4598-8-34. [DOI] [PMC free article] [PubMed] [Google Scholar]
- Mukhopadhyay S, Nair S, Ghosh S. Pathogenesis in tuberculosis: transcriptomic approaches to unraveling virulence mechanisms and finding new drug targets. FEMS Microbiol Rev. 2012;36:463–485. doi: 10.1111/j.1574-6976.2011.00302.x. [DOI] [PubMed] [Google Scholar]
- Murray JL, Kwon T, Marcotte EM, Whiteley M. Intrinsic Antimicrobial resistance determinants in the superbug Pseudomonas aeruginosa. mBio. 2015;6:e01603–01615-01610. doi: 10.1128/mBio.01603-15. [DOI] [PMC free article] [PubMed] [Google Scholar]
- Nielsen PK, Andersen AZ, Mols M, van der Veen S, Abee T, Kallipolitis BH. Genome-wide transcriptional profiling of the cell envelope stress response and the role of LisRK and CesRK in Listeria monocytogenes. Microbiology. 2012;158:963–974. doi: 10.1099/mic.0.055467-0. [DOI] [PubMed] [Google Scholar]
- Oberhardt MA, Puchalka J, Fryer KE, Martins dos Santos VA, Papin JA. Genome-scale metabolic network analysis of the opportunistic pathogen Pseudomonas aeruginosa PAO1. J Bacteriol. 2008;190:2790–2803. doi: 10.1128/JB.01583-07. [DOI] [PMC free article] [PubMed] [Google Scholar]
- Patil SD, Sharma R, Srivastava S, Navani NK, Pathania R. Downregulation of yidC in Escherichia coli by antisense RNA expression results in sensitization to antibacterial essential oils eugenol and carvacrol. PLoS ONE. 2013;8:e57370–57379. doi: 10.1371/journal.pone.0057370. [DOI] [PMC free article] [PubMed] [Google Scholar]
- Price MN, Deutschbauer AM, Skerker JM, Wetmore KM, Ruths T, Mar JS, Kuehl JV, Shao W, Arkin AP. Indirect and suboptimal control of gene expression is widespread in bacteria. Mol Syst Biol. 2013;9:660. doi: 10.1038/msb.2013.16. [DOI] [PMC free article] [PubMed] [Google Scholar]
- Rajagopal M, Martin MJ, Santiago M, Lee W, Kos VN, Meredith T, Gilmore MS, Walker S. Multidrug intrinsic resistance factors in Staphylococcus aureus identified by profiling fitness within high-diversity transposon libraries. mBio. 2016;7:e00950–00916-00911. doi: 10.1128/mBio.00950-16. [DOI] [PMC free article] [PubMed] [Google Scholar]
- Satish Kumar V, Dasika MS, Maranas CD. Optimization based automated curation of metabolic reconstructions. BMC Bioinformatics. 2007;8:212–216. doi: 10.1186/1471-2105-8-212. [DOI] [PMC free article] [PubMed] [Google Scholar]
- Schmidt KD, Tuemmler B, Roemling U. Comparative genome mapping of Pseudomonas aeruginosa PAO with P. aeruginosa C, which belongs to a major clone in cystic fibrosis patients and aquatic habitats. J Bacteriol. 1996;178:85–93. doi: 10.1128/jb.178.1.85-93.1996. [DOI] [PMC free article] [PubMed] [Google Scholar]
- Shi ZY, Enright MC, Wilkinson P, Griffiths D, Spratt BG. Identification of three major clones of multiply antibiotic-resistant Streptococcus pneumoniae in Taiwanese hospitals by multiplocus sequence typing. J Clin Microbiol. 1998;36:3514–9. doi: 10.1128/jcm.36.12.3514-3519.1998. [DOI] [PMC free article] [PubMed] [Google Scholar]
- Shishkin AA, Giannoukos G, Kucukural A, Ciulla D, Busby M, Surka C, Chen J, Bhattacharyya RP, Rudy RF, Patel MM, et al. Simultaneous generation of many RNA-seq libraries in a single reaction. Nat Methods. 2015;12:323–325. doi: 10.1038/nmeth.3313. [DOI] [PMC free article] [PubMed] [Google Scholar]
- Smith JJ, Sydorskyy Y, Marelli M, Hwang D, Bolouri H, Rachubinski RA, Aitchison JD. Expression and functional profiling reveal distinct gene classes involved in fatty acid metabolism. Mol Syst Biol. 2006;2:1–8. doi: 10.1038/msb4100051. [DOI] [PMC free article] [PubMed] [Google Scholar]
- Sun H, Xu Y, Sitkiewicz I, Ma Y, Wang X, Yestrepsky BD, Huang Y, Lapadatescu MC, Larsen MJ, Larsen SD, Musser JM, Ginsburg D. Inhibitor of streptokinase gene expression improves survival after group A streptococcus infection in mice. PNAS. 2012;109:3469–3474. doi: 10.1073/pnas.1201031109. [DOI] [PMC free article] [PubMed] [Google Scholar]
- Tettelin H, Nelson KE, Paulsen IT, Eisen JA, Read TD, Peterson S, Heidelberg J, DeBoy RT, Haft DH, Dodson RJ, et al. Complete genome sequence of a virulent isolate of Streptococcus pneumoniae. Science. 2001;293:493–498. doi: 10.1126/science.1061217. [DOI] [PubMed] [Google Scholar]
- Tomasz A. The mechanism of the irreversible antimicrobial effects of penicillins: how the beta-lactam antibiotics kill and lyse bacteria. Annu Rev Microbiol. 1979;33:113–37. doi: 10.1146/annurev.mi.33.100179.000553. [DOI] [PubMed] [Google Scholar]
- Tuomanen EI, Mitchell TJ, Morrison DA, Spratt BG. The Pneumococcus. Washington: ASM Press; [Google Scholar]
- Turner KH, Everett J, Trivedi U, Rumbaugh KP, Whiteley M. Requirements for Pseudomonas aeruginosa acute burn and chronic surgical wound infection. PLoS Genet. 2014;10:e1004518–1004512. doi: 10.1371/journal.pgen.1004518. [DOI] [PMC free article] [PubMed] [Google Scholar]
- Vakulenko SB, Mobashery S. Versatility of aminoglycosides and prospects for their future. Clin Microbiol Rev. 2003;16:430–450. doi: 10.1128/CMR.16.3.430-450.2003. [DOI] [PMC free article] [PubMed] [Google Scholar]
- van Opijnen T, Camilli A. A fine scale phenotype-genotype virulence map of a bacterial pathogen. Genome Research. 2012;22:2541–2551. doi: 10.1101/gr.137430.112. [DOI] [PMC free article] [PubMed] [Google Scholar]
- van Opijnen T, Camilli A. Transposon insertion sequencing: a new tool for systems-level analysis of microorganisms. Nat Rev Microbiol. 2013;11:435–442. doi: 10.1038/nrmicro3033. [DOI] [PMC free article] [PubMed] [Google Scholar]
- van Opijnen T, Boerlijst MC, Berkhout B. Effects of random mutations in the human immunodeficiency virus type 1 transcriptional promoter on viral fitness in different host cell environments. J Virol. 2006;80:6678–6685. doi: 10.1128/JVI.02547-05. [DOI] [PMC free article] [PubMed] [Google Scholar]
- van Opijnen T, Bodi KL, Camilli A. Tn-seq: high-throughput parallel sequencing for fitness and genetic interaction studies in microorganisms. Nat Methods. 2009;6:767–72. doi: 10.1038/nmeth.1377. [DOI] [PMC free article] [PubMed] [Google Scholar]
- van Opijnen T, Lazinski DW, Camilli A. Genome-wide fitness and genetic interactions determined by Tn-seq, a high-throughput massively parallel sequencing method for microorganisms. Curr Protoc Mol Biol. 2014;106(7):7.16.1–7.16.24. doi: 10.1002/0471142727.mb0716s106. 16. [DOI] [PMC free article] [PubMed] [Google Scholar]
- van Opijnen T, Dedrick S, Bento J. Strain dependent genetic networks for antibiotic-sensitivity in a bacterial pathogen with a large pan-genome. PLoS Pathog. 2016;12:e1005869–1005829. doi: 10.1371/journal.ppat.1005869. [DOI] [PMC free article] [PubMed] [Google Scholar]
- WHO. Pneumococcal conjugate vaccine for childhood immunization–WHO position paper. Weekly epidemiological record Health Section of the Secretariat of the League of Nations. 2007:93–104. [Google Scholar]
- Xie L, Liu W, Li Q, Chen S, Xu M, Huang Q, Zeng J, Zhou M, Xie J. First succinyl-proteome profiling of extensively drug-resistant Mycobacterium tuberculosis revealed involvement of succinylation in cellular physiology. J Proteome Res. 2015;14:107–119. doi: 10.1021/pr500859a. [DOI] [PubMed] [Google Scholar]
Associated Data
This section collects any data citations, data availability statements, or supplementary materials included in this article.
Supplementary Materials
Supplementary File 1: Gene correspondence table for S. pneumoniae strains T4, 19F and D39. Related to Figure 1, Figure S1, Table S1.
Supplementary File 2: Growth of S. pneumoniae strains T4, 19F and D39 in different nutrient media: THY, SDMM, CDM, and MCDM. Related to Figure 1.
Supplementary File 5: Essential genes in S. pneumoniae strains T4, 19F and D39. Related to Figure 7.