eLife logoLink to eLife
. 2017 Sep 5;6:e29538. doi: 10.7554/eLife.29538

Stress responsive miR-31 is a major modulator of mouse intestinal stem cells during regeneration and tumorigenesis

Yuhua Tian 1,, Xianghui Ma 1,, Cong Lv 1,, Xiaole Sheng 1, Xiang Li 1, Ran Zhao 1, Yongli Song 1, Thomas Andl 2, Maksim V Plikus 3, Jinyue Sun 4, Fazheng Ren 1, Jianwei Shuai 5, Christopher J Lengner 6,7, Wei Cui 8, Zhengquan Yu 1,
Editor: Roel Nusse9
PMCID: PMC5584991  PMID: 28870287

Abstract

Intestinal regeneration and tumorigenesis are believed to be driven by intestinal stem cells (ISCs). Elucidating mechanisms underlying ISC activation during regeneration and tumorigenesis can help uncover the underlying principles of intestinal homeostasis and disease including colorectal cancer. Here we show that miR-31 drives ISC proliferation, and protects ISCs against apoptosis, both during homeostasis and regeneration in response to ionizing radiation injury. Furthermore, miR-31 has oncogenic properties, promoting intestinal tumorigenesis. Mechanistically, miR-31 acts to balance input from Wnt, BMP, TGFβ signals to coordinate control of intestinal homeostasis, regeneration and tumorigenesis. We further find that miR-31 is regulated by the STAT3 signaling pathway in response to radiation injury. These findings identify miR-31 as a critical modulator of ISC biology, and a potential therapeutic target for a broad range of intestinal regenerative disorders and cancers.

Research organism: Mouse

eLife digest

Cells lining the inner wall of the gut help to absorb nutrients and to protect the body against harmful microbes and substances. Being on the front line of defense means that these cells often sustain injuries. Specialized cells called intestinal stem cells keep the tissues healthy by replacing the damaged and dying cells.

The intestinal stem cells can produce copies of themselves and generate precursors of the gut cells. They also have specific mechanism to protect themselves from cell death. These processes are regulated by different signals that are generated by the cell themselves or the neighboring cells. If these processes get out of control, cells can easily be depleted or develop into cancer cells. Until now, it remained unclear how intestinal stem cells can differentiate between and respond to multiple and simultaneous signals.

It is known that short RNA molecules called microRNA play an important role in the signaling pathways of damaged cells and during cancer development. In the gut, different microRNAs, including microRNA-31,help to keep the gut lining intact. However, previous research has shown that bowel cancer cells also contain high amounts of microRNA-31.

To see whether microRNA-31 plays a role in controlling the signaling systems in intestinal stem cells, Tian, Ma, Lv et al. looked at genetically modified mice that either had too much microRNA-31 or none. Mice with too much microRNA-31 produced more intestinal stem cells and were able to better repair any cell damage. Mice without microRNA-31 gave rise to fewer intestinal stem cellsand had no damage repair, but were able to stop cancer cells in the gut from growing.

The results showed that microRNA-31 in intestinal stem cells helps the cells to divide and to protect themselves from cell death. It controlled and balanced the different types of cell signaling by either repressing or activating various signals. When Tian et al. damaged the stem cells using radiation, the cells increased their microRNA-31 levels as a defense mechanism. This helped the cells to survive and to activate repair mechanisms. Furthermore, Tian et al. discovered that microRNA-31 can enhance the growth of tumors.

These results indicate that microRNA-31 plays an important role both in repairing gut linings and furthering tumor development. A next step will be to see whether cancer cells use microRNA-31 to protect themselves from chemo- and radiation therapy. This could help scientists find new ways to render cancerous cells more susceptible to existing cancer therapies.

Introduction

The intestinal epithelium is one of the most rapidly renewing tissues, undergoing complete turnover in approximately 3 days (Leblond and Walker, 1956). This rapid turnover protects against insults from bacterial toxins and metabolites, dietary antigens, mutagens, and exposure to DNA damaging agents including irradiation. Upon insult, the rapid intestinal regeneration is particularly important as impaired regeneration can result in epithelial barrier defects that can lead to rapid dehydration and translocation of intestinal microbiota into the bloodstream. The processes of normal tissue turnover and intestinal regeneration are driven by intestinal stem cells (ISCs) that reside at the bottom of crypt and generate the precursors for the specialized differentiated cells (Barker, 2014; Li and Clevers, 2010).

It has been extensively reported that ISC compartment includes two functionally and molecularly distinct stem cell populations (Barker, 2014; Li and Clevers, 2010; Gehart and Clevers, 2015): The active crypt base columnar (CBC) stem cells (Sato et al., 2011), (Barker et al., 2007) and a more dormant, reserve ISC population that reside above the crypt base and exhibit no Wnt pathway activity, also referred as +4 cells due to their position at the crypt (Montgomery et al., 2011; Sangiorgi and Capecchi, 2008; Tian et al., 2011; Takeda et al., 2011; Li et al., 2014; Yan et al., 2012). The CBCs often identified and isolated based on the expression of Lgr5, a Wnt target gene (Barker et al., 2007). During homeostasis, steady-state proliferation of CBCs is driven by extrinsic niche signals – high canonical Wnt activity promotes CBC self-renewal and proliferation (Barker et al., 2007; Miyoshi, 2017) while BMP signals antagonize it (Kosinski et al., 2007). In contrast to the active CBCs, the reserve ISCs represent a slow-cycling population of stem cells that are resistant to high doses of ionizing radiation and appear dispensable for homeostasis (Sangiorgi and Capecchi, 2008; Yousefi et al., 2016). These reserve ISCs are identified through CreERT knockin reporter alleles at the Bmi1 and Hopx loci, as well as by an Tert-CreERT transgene (Montgomery et al., 2011; Sangiorgi and Capecchi, 2008; Tian et al., 2011; Takeda et al., 2011; Li et al., 2014). Reserve ISCs do not have an active Wnt signaling pathway and are refractory to Wnt signals in their resting state (Takeda et al., 2011; Li et al., 2014; Li et al., 2016). Although the activity of the BMP pathway has never been directly examined specifically in reserve ISCs, indirect evidence suggests that it may help to promote their dormancy (Reynolds et al., 2014; He et al., 2004; Kishimoto et al., 2015). During epithelial regeneration upon stresses, reserve ISCs give rise to Wnthigh Lgr5+ CBCs that generate the precursor cells of the specialized differentiated cells (Tian et al., 2011; Takeda et al., 2011; Li et al., 2014). In addition, it has been documented that Lgr5-CreERT- or Bmi1-CreERT-marked cells can act as the cells of origin of intestinal cancer in mice (Sangiorgi and Capecchi, 2008; Barker et al., 2009). However, it remains unclear how ISCs differentially sense and respond to multiple signals under both physiological and pathological conditions, and whether these signals contribute to intestinal tumorigenesis.

MicroRNAs represent a broad class of 18–22 nucleotide noncoding RNAs that negatively regulate the stability and translation of target mRNAs. Mounting evidence indicates that microRNAs play important roles in stress-activated pathways (Leung and Sharp, 2010; Mendell and Olson, 2012; Emde and Hornstein, 2014) and in control of somatic stem cell fate and tumorigenesis (Gangaraju and Lin, 2009; Sun and Lai, 2013; Yi and Fuchs, 2011). Hundreds of microRNAs have been identified in the intestinal epithelium (McKenna et al., 2010). Global ablation of microRNA activity through genetic deletion of the microRNA processing enzyme Dicer demonstrated that microRNAs are critical for homeostasis of intestinal epithelium (McKenna et al., 2010). Recently, numerous reports demonstrate that specific microRNAs play important roles in the complex intestinal immune system and in the epithelium during homeostasis including miR-155, miR-29, miR-122, miR-21, miR-146a and miR-143/145 (Runtsch et al., 2014). Particularly, miR-143/145 are essential for intestinal epithelial regeneration after injury, acting non cell-autonomously in sub-epithelial myofibroblasts (Chivukula et al., 2014), indicating potential importance of microRNA activity in intestinal regeneration.

In the ISC compartment, the function of miR-31 is of a particular interest, as it becomes overexpressed in colorectal cancer (Bandrés et al., 2006; Cottonham et al., 2010; Wang et al., 2009; Yang et al., 2013) and increases during the progression of inflammation-associated intestinal neoplasia (Olaru et al., 2011). In addition, it has been reported that miR-31 is enriched in mammary stem/progenitor cells, suggesting a potential role in somatic stem cells (Ibarra et al., 2007). Here we utilized gain- and loss-of-function mouse models to show that a damage-responsive microRNA, miR-31 drives proliferative expansion of both active and dormant ISCs, and acts as an oncogene promoting intestinal tumorigenesis in different models. Our findings implicated miR-31 as a potential high-value therapeutic target for a broad range of intestinal regenerative disorders and cancers.

Results

MiR-31 expression pattern in intestine under physiologIcal and pathological conditions

Elevated miR-31 expression has been previously observed in colorectal cancers (Bandrés et al., 2006; Cottonham et al., 2010; Wang et al., 2009; Yang et al., 2013), however its expression in normal intestinal epithelium, particularly in ISCs, remains unclear. To begin addressing a potential role for miR-31 in the intestinal epithelium and ISCs, first we examined its expression pattern in intestine. MiR-31 expression levels are the highest in the Lgr5-GFPhighcrypt base columnar stem cells, intermediate in Lgr5-GFPlow transit-amplifying cell population and the lowest in Lgr5-GFPneg populations (Figure 1A). Higher level of miR-31 was also found in Hopx+ reserve ISCs than that in bulk epithelial cells (Figure 1A), based on isolation with Hopx-CreERT;mTmG alleles from mice 15 hr after tamoxifen injection. Consistently, in situ hybridization revealed that miR-31 expression levels are generally higher in the crypts than villi. MiR-31 is predominantly expressed in the epithelial cells of intestinal crypt, including stem cells and transit amplifying cells (Figure 1B). Next, we examined miR-31 expression in response to intestinal injury. Mice were exposed to 12 Gy γ-IR and then miR-31 expression was examined at various timepoints during the recovery phase. MiR-31 levels transiently and markedly drop by 24 hours (coincident with full proliferative arrest/DNA damage response), and then sharply upregulated 48 hours post-γ-IR (during initiation of regenerative proliferation from the radioresistant ISCs), and then return to baseline levels within one week (after full recovery) (Figure 1C). In situ hybridization reveals miR-31 expressing cells to be located in the regenerative foci known to exhibit high Lgr5 expression and Wnt pathway activity (Figure 1D). Together, these data suggest a role for this microRNA in ISC-driven regeneration.

Figure 1. MiR-31 promotes turnover of intestinal epithelial cells.

(A) Schematic picture of intestinal crypt showing Lgr5+ CBCs and Hopx+ cells. qRT-PCR for miR-31 in Lgr5-GFPhigh, Lgr5-GFPlow, Lgr5-GFPneg, Hopx- and Hopx+ sorted intestinal epithelial cells. n = 4 biological replicates. (B) In situ hybridization for miR-31 in the intestinal epithelium. Left panel, representative low magnification image (Scale bar: 200 μm); Middle panels, high magnification images indicated by dashed boxes in left panel; Right panels (Scale bar: 50 μm), miR-31 KO intestinal section used as a negative control (Top) and TRE-miR31 (miR-31 overexpressing) intestinal section used as a positive control (Bottom). (C) qRT-PCR for miR-31 in the intestinal epithelium after exposure to 12 Gy γ-IR at indicated time points. n = 3 biological replicates. (D) In situ hybridization for miR-31 in intestines without γ -IR treatment (non-IR), and intestines 4 days after 12 Gy γ-IR. Arrows, miR-31 positive regenerative foci. Dashes boxes indicate the high magnification images in right panels. Scale bar: 50 μm. (E) Quantification of body weight from M2rtTA and TRE-miR31 mice at the age of 8 weeks before and after Dox treatment for 2 weeks. Quantification of intestine length from M2rtTA and TRE-miR31 mice following 2 week Dox induction. n = 6 biological replicates. ***p<0.001. (F) Representative histologic images showing extension of crypt height in jejunum from TRE-miR31 mice, and quantification of crypt height from M2rtTA and TRE-miR31 intestine. Both M2rtTA and TRE-miR31 mice were treated with Dox for 2 weeks. n = 3 biological replicates. Scale bar: 50 μm. ***p<0.001. (G) Immunohistochemistry for Ki67 and quantification of Ki67+ cells per crypt in M2rtTA andTRE-miR31 jejunum, showing an expanded proliferative zone in TRE-miR31 mice following 2 weeks of Dox induction. n = 3 biological replicates. Scale bar: 50 μm. ***p<0.001. (H) Immunohistochemistry for cleaved-Caspase 3 (Casp3) and quantification of Casp3+ cells in the top of intestinal villi from M2rtTA andTRE-miR31 mice following 2 weeks of Dox induction. n = 3 biological replicates. 60 villi were quantified in each mouse. Scale bar: 100 μm. ***p<0.001. (I) Representative histologic images and quantification of crypt height in intestines from miR-31+/− and miR-31−/− mice at 2 months of age. Brackets mark crypts. Scale bar: 100 μm. n = 3 biological replicates. ***p<0.001.

Figure 1—source data 1. Source data for Figure 1C,E,F,G,H and I.
DOI: 10.7554/eLife.29538.012
Figure 1—source data 2. Source data for Figure 1—figure supplements 13.
DOI: 10.7554/eLife.29538.013
Figure 1—source data 3. Source data for Figure 1—figure supplements 47.
DOI: 10.7554/eLife.29538.014

Figure 1.

Figure 1—figure supplement 1. Generation of inducible TRE-miR-31 transgenic mice, constitutive miR-31 KO and conditional miR-31 KO mice.

Figure 1—figure supplement 1.

(A) Schematic maps of constructs used to generate Rosa26-rtTA;TRE-miR31 (TRE-miR31) double transgenic mice. (B) qRT-PCR analysis for miR-31 in intestinal tissues from M2rtTA and TRE-miR31 mice at indicated timepoints following Dox treatment. (C) Strategy to generate miR-31 KO mice using Crispr/Cas9 technique. (D) 402 bp DNA fragment containing miR-31 indicated by dash lines was deleted in the KO allele. The miR-31 exon indicated by bold; mature miR-31 indicated by blue, miR-31* indicated by red. (E) qRT-PCR analysis for miR-31 in intestinal tissues from miR-31+/− and miR-31−/− mice. ***p<0.001. (F) Strategy to generate miR-31 conditional null allele. (G) qRT-PCR for miR-31 in intestine from Vil-Cre and Vil-Cre/miR-31fl/fl (cKO) mice. ***p<0.001. (H) In situ hybridization for miR-31 in TRE-miR31, miR-31−/− and WT intestines. TRE-miR31 mice were pretreated with Dox for 2 weeks. Scale bar: 100 μm. Note: The schematic depiction of the general strategy for generating miR-31 mutant mice (Figure 1—figure supplement 1C and D) was also used in another unrelated study on the role of miR-31 in mammary stem cells and breast cancer and the manuscript is currently under consideration in Nature Communications.
Figure 1—figure supplement 2. MiR-31 induction promotes crypt expansion.

Figure 1—figure supplement 2.

(A) Quantification of length of villi and cypt/villus in M2rtTA and TRE-miR31 mice following 2 weeks of Dox induction. n = 3 biological replicates. ***p<0.001. (B) Representative histologic images of duodenum and ileum from M2rtTA and TRE-miR31 mice following 2 weeks of Dox induction, and quantification of crypt height. Dashed boxes indicate high magnification images of crypts. Scale bar: 100 μm. ***p<0.001. (C) Quantification of crypt height from M2rtTA and TRE-miR31 intestine at indicated time points. Continuous Dox treatment was administered on M2rtTA and TRE-miR31 mice for 0 day, 7 days, 10 days, 14 days, 2 months and 1 year. n = 3 biological replicates at each time points. ***p<0.001. (D) Representative histologic images of jejunum from M2rtTA and TRE-miR31 mice without Dox treatment. Brackets mark crypts. Dashed boxes indicate high magnification images of crypts. Scale bar: 50 μm. (E) Representative histologic images of jejunum from TRE-miR31 mice following 7, 10, 14, 21 days, 2 months and 1 year of Dox induction. Brackets mark crypts. Dashed boxes indicate high magnification images of crypts. Scale bar: 50 μm.
Figure 1—figure supplement 3. MiR-31 induction promotes cell proliferation in crypts, and apoptosis at the top of villi.

Figure 1—figure supplement 3.

(A) Immunohistochemistry for Ki67 and Cleaved Caspase 3 in jejunum from M2rtTA and TRE-miR31 mice following 7, 10 and 365 days of Dox induction. Scale bar: 100 μm. (B) Quantification of Ki67+ cells in crypts of M2rtTA and TRE-miR31 mice, and Caspase 3+ cells at the tip of villi. **p<0.01; ***p<0.001. (C) Immunohistochemistry for GFP (Lgr5) and quantification of GFP+ cells in crypts from M2rtTA and TRE-miR31 mice following 7 and 10 days of Dox induction. ***p<0.001. (D) Representative FACS profiles and quantification of GFP positive intestinal epithelial cells (Lgr5-GFP+ cells) from an Lgr5-eGFP-CreERT reporter mice crossed with M2rtTA and TRE-miR31 mice. M2rtTA and TRE-miR31 mice were pre-treated with Dox for 7 and 10 days. n = 3 biological replicates. ***p<0.001.
Figure 1—figure supplement 4. MiR-31 induction impairs cell differentiation.

Figure 1—figure supplement 4.

(A) Immunostaining for ChgA, Mucin2 and Lysozyme in jejunum from M2rtTA and TRE-miR31 mice following 7, 10, 14 days and 1 year of Dox induction. n = 3 biological replicates at each time points. Scale bar: 50 μm. (B) Quantification of ChgA+ cells/crypt-villus, Mucin2+ cells/crypt-villus and Lysozyme+ cells/crypt in Panel A. *p<0.05; **p<0.01, ***p<0.001.
Figure 1—figure supplement 5. Loss of miR-31 led to shortened crypt.

Figure 1—figure supplement 5.

(A) Quantification of body weight and intestinal length from miR-31+/− (Control) and miR-31−/− mice at 2 weeks, and 2 and 8 months of ages. n = 6 biological replicates for 2 weeks and 2 months; n = 4 biological replicates for 8 months. (B) Quantification of mouse number of miR-31+/+, miR-31+/− and miR-31−/− genotypes. (C) H&E staining and immunohistochemistry for Ki67 and cleaved Caspase 3 (Casp3) in jejunum of miR-31+/− and miR-31−/− mice at 2 weeks, 2 and 8 months of ages. Scale bar: 100 μm. (D) Quantification of crypt height, Ki67+ and Casp3+ cells at different timepoints in Panel C.
Figure 1—figure supplement 6. Loss of miR-31 does not affect cell differentiation.

Figure 1—figure supplement 6.

(A) Immunofluorescence for ChgA, Mucin2 and Lysozyme in jejunum from miR-31+/− and miR-31−/− mice at indicated timepoints. Scale bar: 50 μm. (B) Quantification of ChgA+, Mucin2+ and Lysozyme+ cells in Panel A.
Figure 1—figure supplement 7. Conditional deletion of miR-31 resulted in shortened crypt, reduced proliferation and enhanced apoptosis.

Figure 1—figure supplement 7.

(A) Representative histologic images of jejunum from Vil-Cre and miR-31 cKO mice, and quantification of crypt height. Brackets mark crypts. Scale bar: 50 μm. n = 4 biological replicates. ***p<0.001. (B) Immunohistochemistry for Ki67 in Vil-Cre and miR-31 cKO intestines. Quantification of Ki67+ cells per crypt. n = 3 biological replicates. Scale bar: 25 μm. (C) Immunohistochemistry for cleaved Caspase 3 (Casp3) in Vil-Cre and miR-31 cKO intestines. Quantification of Casp3+ cells per crypt-villus axis (excluding the tip of villus). n = 3 biological replicates. Scale bar: 100 μm. (D) High magnification images of immunohistochemistry for cleaved Caspase 3 (Casp3) in Vil-Cre and miR-31 cKO intestines. Quantification of percentage of Casp3+ crypts. n = 3 biological replicates. Scale bar: 25 μm.
Figure 1—figure supplement 8. MiR-31 promotes cell turnover from crypt to villi.

Figure 1—figure supplement 8.

Immunofluorescence for BrdU in M2rtTA, TRE-miR31, miR-31+/− and miR-31−/− intestinal crypts at indicated time points post 1 dose of BrdU pulse. The dashed lines marked the top of villi, middle line of intestine, and the bottom of crypt, respectively. Scale bar: 100 μm. n = 3 biological replicates at each time points.

MiR-31 promotes intestinal epithelial cell turnover along the Crypt-villus axis

To determine the function of miR-31 in the mouse intestine, we generated both gain- and loss- of-function mouse models. MiR-31 gain-of-function was achieved with a targeted, inducible Rosa26-rtTA;TRE-miR-31 mouse model (TRE-miR31) and doxycycline (Dox)-mediated induction of miR-31 in the intestinal epithelium was validated by qRT-PCR (Figure 1—figure supplement 1A,B). For the loss-of-function, we generated constitutive miR-31 null mice using RNA-guided CRISPR/Cas9 nucleases (Figure 1—figure supplement 1C). The 402 bp DNA fragment containing miR-31 was deleted in the knockout (KO) allele (Figure 1—figure supplement 1D), which was validated by sequencing and qRT-PCR (Figure 1—figure supplement 1E). We also generated a Villin-Cre-mediated intestine-specific conditional miR-31 null mice (cKO) using traditional homology-directed gene targeting (Figure 1—figure supplement 1F). The expression of miR-31 was markedly reduced in the cKO intestinal epithelium (Figure 1—figure supplement 1G). The induction of miR-31 in TRE-miR31 intestine and deletion of miR-31 in KO intestine were also confirmed by in situ hybridization (Figure 1—figure supplement 1H).

MiR-31 induction in response to Dox administration in TRE-miR31 mice resulted in a significant reduction in body weight after 2 weeks (Figure 1E) and intestinal lengths were moderately, but significantly shorter than controls (Figure 1E). Dox treatment of TRE-miR31 mice for 2 weeks resulted in expansion of intestinal crypts (Figure 1F). Unexpectedly villus lengths were mildly shortened, and thus the total length of the crypt-villus was not significantly altered in TRE-miR31 mice (Figure 1—figure supplement 2A). The expanded crypts were also found in the TRE-miR31 duodenum and ileum (Figure 1—figure supplement 2B). The length of intestinal crypts in the control M2rtTA mice was not significantly altered at different time points in response to Dox treatment (Figure 1—figure supplement 2C,D). In contrast, crypts were significantly expanded in TRE-miR31 mice after 10 days of Dox treatment, this crypt expansion remained stable for up to 1 year with continuous Dox induction (Figure 1—figure supplement 2C–E). Given that crypt elongation reached maximal levels within 2 weeks of Dox induction, we conducted most of the subsequent assays at this time point. More mitotic cells were found in the TRE-miR31 crypts (Figure 1G and Figure 1—figure supplement 3A,B), while more apoptotic cells were detected at the top of TRE-miR31 villi (Figure 1H and Figure 1—figure supplement 3A,B). The number of Lgr5+ ISCs increased in TRE-miR31 mice after 10 day Dox treatment, while no significant difference was found between them after 7 days of Dox induction (Figure 1—figure supplement 3C,D). In addition, there were fewer differentiated cells including enteroendocrine, goblet and Paneth cells in TRE-miR31 intestine than the controls (Figure 1—figure supplement 4A,B), indicating an impaired cell differentiation. These results suggest that miR-31 induction accelerates the conveyer-belt movement of proliferative cells exiting the cell cycle and progressing into the villi to ultimately be shed into the lumen, which could comprise the differentiation of specialized intestinal cell types.

Next, we examined the consequence of miR-31 loss in both miR-31 germline knockout (KO) and Villin-Cre-driven intestinal epithelial conditional KO (cKO) mice. We followed these mice up to six months. Both miR-31 KO and cKO mice were viable and fertile with no apparent gross phenotypes observed. No differences in the body weight and intestinal length were found between control and miR-31 KO mice (Figure 1—figure supplement 5A), and the transmission of miR-31 knockout alleles generally followed Mendelian ratios (Figure 1—figure supplement 5B). Despite this, loss of miR-31 led to a significant reduction in crypt height with fewer proliferative cells (Figure 1I and Figure 1—figure supplement 5C,D). Interestingly, loss of miR-31 gave rise to a certain number of apoptotic cells throughout the crypt-villus axis, while apoptotic cells are predominantly presented at the tip of control villi and very rare apoptotic cells are presented in crypt-villus axis (Figure 1—figure supplement 5C,D). Deletion of miR-31 also led to increased numbers of enteroendocrine and Paneth cells, while the number of goblet cells remained unaltered in miR-31 KO intestines (Figure 1—figure supplement 6A,B). Moreover, the phenotype of shortened crypts with fewer proliferative cells was also found in cKO intestine (Figure 1—figure supplement 7A,B). Loss of miR-31 gave rise to more apoptotic cells in cKO intestinal epithelium, including in cKO crypts, while cleaved-caspase3+ apoptotic cells were nearly entirely absent from control crypts (Figure 1—figure supplement 7C,D). These results suggest that miR-31 loss functions within intestinal epithelium. We further analyzed DNA synthesis and migration of epithelial cells along the crypt-villus axis after a single pulse of BrdU. Upward movement of BrdU+ cells from crypts to villi was enhanced in TRE-miR31 mice, and this movement was impaired in miR-31−/− mice (Figure 1—figure supplement 8). Taken together, these data indicate that miR-31 functions within the intestinal epithelium to maintain a proper balance between stem cell proliferation, differentiation, and epithelial cell death for optimal intestinal homeostasis.

MiR-31 promotes expansion of Lgr5+ CBC stem cells

Higher expression levels of miR-31 in Lgr5+ CBCs prompted us to examine its effect on their renewal. Lgr5+ ISC frequency was markedly increased in TRE-miR31, and significantly reduced in miR-31−/− and cKO intestine (Figure 2A–C and Figure 2—figure supplement 1A). A 1.5 hr pulse of EdU incorporation demonstrated that the frequency of actively proliferating Lgr5-GFP+/EdU+ cells is higher in TRE-miR31 mice and conversely lower in miR-31−/− mice (Figure 2D). In line with these in vivo findings, miR-31 induction increased the frequency of budding organoids in vitro, and caused more buds per organoid and more elongated crypts (Figure 2E and Figure 2—figure supplement 1B). Furthermore, lineage-tracing assay reveals that miR-31 induction in the intestine increases the height of traced lineages derived from Lgr5-CreERT-marked ISCs (Figure 2F,G and Figure 2—figure supplement 1C). Interestingly, miR-31 induction significantly repressed Hopx expression, while deletion of miR-31 increased it (Figure 2H). Consistently, miR-31 induction in the intestine repressed lineage tracing from Hopx-CreERT-marked reserve ISCs (Figure 2I, and Figure 2—figure supplement 1D,E). In contrast to miR-31 overexpression, deletion of miR-31 within intestinal epithelium induced quiescence (residence in G0) in Lgr5-GFP+ cells concomitant to an increase in apoptosis and a decrease in cycling (G1/S/G2/M) (Figure 2J and Figure 2—figure supplement 1F). In agreement, higher frequency of apoptotic organoids and compromised budding was found in the cKO crypts (Figure 2K), and more apoptotic cells were found inside of the cKO organoids (Figure 2—figure supplement 1G). Taken together, these data strongly indicate that miR-31 promotes proliferative expansion of Lgr5+ CBCs, and concomitantly prevents their apoptosis.

Figure 2. MiR-31 promotes expansion of Lgr5+ CBC stem cells.

(A) Representative FACS profiles and quantification of GFP positive intestinal epithelial cells (Lgr5-GFP+ cells) from an Lgr5-eGFP-CreERT reporter mice crossed with M2rtTA (control) and TRE-miR31 mice. M2rtTA (control) and TRE-miR31 mice were pre-treated with Dox for two weeks. n = 4 biological replicates. ***p<0.001. (B, C) FACS profiles and quantification of Lgr5-GFP+ cells from an Lgr5-eGFP-CreER reporter mice crossed with miR-31+/− (control) and miR-31−/− mice (B), or Vil-Cre (Villin-Cre) and cKO (Vil-Cre;miR-31fl/fl) mice (C). n = 4 biological replicates. ***p<0.001. (D) Assessment of 1.5-hour-pulse EdU incorporation in Lgr5+ CBC cells in M2rtTA, and TRE-miR31 mice following 2 weeks of Dox treatment, and in miR-31+/− and miR-31−/− intestine. ***p<0.001. (E) Crypts purified from M2rtTA and TRE-miR31 mice grown in organoid cultures with Dox. Representative gross images of budding organoids, and quantification of budding and apoptotic organoids at day 7. Scale bar: 500 μm. n = 5 technical replicates. (F) X-gal staining showing lineage tracing events from Lgr5+ ISCs. Lgr5-eGFP-CreERT;R26-LSL-LacZ;TRE-miR31 mice and its control counterpart were pretreated with Dox for 2 weeks, injected with a single dose tamoxifen, and analyzed 2 and 4 days after injection. Scale bar: 100 μm. n = 3 biological replicates. (G) Quantification of the length of LacZ+ cells and LacZ+ units in Panel F. ***p<0.001. (H) qRT-PCR analysis for Hopx in intestines from M2rtTA, TRE-miR31, Vil-Cre and cKO mice. n = 3 biological replicates. **p<0.01; ***p<0.001. (I) Lineage tracing events from Hopx+ ISCs. Hopx-CreERT;mTmG;TRE-miR31 mice and their control counterparts were pretreated with Dox for 2 weeks, injected with a single dose of tamoxifen, and analyzed 15 hr after injection. Hopx-CreERT;R26-LSL-LacZ;TRE-miR31 and their control counterparts were analyzed 4 days after inject with the same treatment. Scale bar: 100 μm. n = 3 biological replicates. (J) Quantification of Cleaved Caspase3+ cells at indicated positions in the intestinal crypts of Vil-Cre and miR-31 cKO mice in Figure 1—figure supplement 7D. n = 3 biological replicates, 50 crypts per sample. (K) Crypts purified from Vil-Cre and miR-31 cKO mice grown in organoid cultures at indicated time points. Quantification of budding organoids and apoptotic organoids, budding number and crypt length. n = 3 biological replicates. ***p<0.001.

Figure 2—source data 1. Source data for Figure 2.
DOI: 10.7554/eLife.29538.017
Figure 2—source data 2. Source data for Figure 2—figure supplement 1.
DOI: 10.7554/eLife.29538.018

Figure 2.

Figure 2—figure supplement 1. MiR-31 promotes ISC expansion.

Figure 2—figure supplement 1.

(A) Immunohistochemistry for GFP (Lgr5-GFP) in intestines from Lgr5-eGFP-CreERT reporter mice crossed with M2rtTA (control), TRE-miR31, miR-31+/− (control) and miR-31−/− mice. Scale bar: 100 μm. The dashed boxes indicate the high magnification images of insets. Quantification of Lgr5-GFP positive intestinal epithelial cells (Lgr5-GFP+ cells). n = 4 biological replicates. 50 crypts were quantified at each single mouse. ***p<0.001. (B) Quantification of budding number and crypt length in organoids at indicated time points in Figure 2E. n = 5 technical replicates. *p<0.05; **p<0.01; ***p<0.001. (C) X-gal staining showing lineage tracing events from Lgr5+ ISCs and quantification of the length of LacZ+ cells. Lgr5-eGFP-CreERT;R26-LSL-LacZ;TRE-miR31 mice and its control counterpart were pretreated with Dox for 2 weeks, injected with a single dose tamoxifen, and analyzed 7 days after injection. Scale bar: 100 μm. n = 3 biological replicates. ***p<0.001. (D) Quantification on number of GFP+ cells per crypt 15 hrs after Tamoxifen injection in Figure 2I. *p<0.05. (E) Statistical analysis on Hopx lineage tracing 4 days after Tamoxifen injection in Figure 2I. ***p<0.001. (F) Analysis of cell cycle distribution of FACS-purified Lgr5-GFP+ cells using Pyronin Y and DAPI staining from Vil-Cre and miR-31 cKO mice. n = 3 biological replicates. *p<0.05; ***p<0.001. (G) Immunofluorescence for cleaved Caspase 3 (Casp3) in cultured organoids from Vil-Cre and cKO crypts in Figure 2K. Scale bar: 50 μm.

MiR-31 is critical for intestinal epithelial regeneration following irradiation

The dynamic changes of miR-31 expression in response to irradiation prompted us to investigate its function during intestinal epithelial injury repair. Intestinal histology of cKO and control Vil-Cre mice was comparable two hours after 12 Gy γ-IR (Figure 3A). However, by 4 days post-γ-IR, there were significantly fewer regenerative foci and fewer proliferative cells per regenerative focus in cKO mice (Figure 3A). Consistently, intestinal regeneration in response to γ-IR was significantly impaired in miR-31−/− mice (Figure 3—figure supplement 1A,B). Conversely, in the intestine of TRE-miR31 mice pre-treated for 2 weeks with Dox, there were more regenerative foci with higher numbers of proliferative cells than in the control mice (Figure 3—figure supplement 1A,B). These data suggest that miR-31 is important for intestinal epithelial regeneration in response to irradiation.

Figure 3. Loss of miR-31 abrogates epithelial regeneration following irradiation.

(A) Representative images of H&E and/or Ki67 immunohistochemistry from jejunum of irradiated Vil-Cre and cKO mice 2 hrs and 4 days post 12 Gy γ-IR. Quantification of Ki67+ regenerative foci per 1400 μm and No. of Ki67+ cells per regenerative focus. Top panel: n = 6 biological replicates; Scale bar: 200 μm. Middle and bottom panels: n = 5 biological replicates; Scale bar: 50 μm. **p<0.01; ***p<0.001. (B) Immunohistochemistry for Casp3, quantification of the number of Casp3+ cells in intestinal crypts of Vil-Cre and cKO mice 2 and 4 hrs post 12 Gy γ-IR. Quantification of Casp3+ cells at indicated positions in intestinal crypts of Vil-Cre and cKO mice 2 hrs post γ-IR. Scale bar: 50 μm. n = 3 biological replicates, and 50 crypts were quantified in each single mouse. ***p<0.001. (C) qRT-PCR analysis for Lgr5 in intestines from M2rtTA, TRE-miR31, miR-31+/− and miR-31−/− mice 2 hrs, 2 and 4 days post 12 Gy irradiation. M2rtTA and TRE-miR31 mice were pre-treated with Dox for two weeks. n = 3 biological replicates at each time points. *p<0.05; **p<0.01; ***p<0.001. (D) Schematic of Lgr5-eGFP-CreERT;R26-LSL-LacZ lineage tracing experiment after irradiation. X-gal staining showing lineage tracing events from Lgr5+ ISCs. Lgr5-eGFP-CreERT;R26-LSL-LacZ;TRE-miR31 mice and their control counterparts were pretreated with Dox for 2 weeks, injected with a single dose tamoxifen and then immediately exposed to 10 Gy γ-IR, and analyzed 2 and 4 days after γ-IR. Scale bar: 100 μm. n = 3 biological replicates at each time points. (E) Quantification of LacZ+ units and the length of LacZ+ cells in Panel D. (F) Schematic of Hopx-CreERT;R26-LSL-LacZ lineage tracing experiment. Hopx-CreERT;R26-LSL-LacZ;TRE-miR31 and their control counterparts were pretreated with Dox for 2 weeks, then injected with a single dose of tamoxifen, and then irradiated 15 hrs after injection and analyzed 4 days after irradiation. Representative images of LacZ staining in M2rtTA and TRE-miR31 intestine 4 days post 12 Gy γ-IR. Scale bar: 50 μm. Statistics of LacZ+ regenerative foci were shown in Figure 3—figure supplement 1E. n = 3 biological replicates. (G) Schematic of Hopx-CreERT;R26-LSL-LacZ lineage tracing experiment. Representative images of LacZ staining in miR-31+/− and miR-31−/− intestine 4 days post 12 Gy γ-IR. Scale bar: 50 μm. Statistics of LacZ+ regenerative foci. n = 3 biological replicates. (H) Representative images of LacZ (blue) and Ki67 (yellow) immunostaining in miR-31+/− and miR-31−/− intestinal crypts, and statistics of percentage of LacZ+/Ki67+cells in regenerative foci. Scale bar: 25 μm. n = 3 biological replicates. ***p<0.001.

Figure 3—source data 1. Source data for Figure 3.
DOI: 10.7554/eLife.29538.021
Figure 3—source data 2. Source data for Figure 3—figure supplement 1.
DOI: 10.7554/eLife.29538.022

Figure 3.

Figure 3—figure supplement 1. MiR-31 is required for intestinal epithelial regeneration in response to γ-IR.

Figure 3—figure supplement 1.

(A) Representative images of H&E from jejunum of irradiated M2rtTA, TRE-miR31, miR-31+/− and miR-31−/− mice 2 hrs post 12 Gy irradiation. n = 3 biological replicates. Scale bar: 200 μm. (B) Histology and immunohistochemistry for Ki67 from jejunum of irradiated miR-31+/−, miR-31−/−, M2rtTA and TRE-miR31 mice 4 days post 12 Gy irradiation. Quantification of Ki67+ regenerative foci and No. of Ki67+ cells per regenerative focus. Scale bar: 50 μm. n = 4 biological replicates. ***p<0.001. (C) The FACS profile and quantification of Annexin V7AAD, Annexin V-7AAD+, Annexin V+7 AAD, Annexin V+7AAD+ cells in Lgr5-GFP+ cells from Vil-Cre and cKO mice. n = 3 biological replicates. *p<0.05; ***p<0.001. (D) Flow cytometry analysis of cell cycle distribution of FACS-purified Lgr5-GFP+ cells using PyroninY and DAPI staining from Vil-Cre and miR-31 cKO mice 2 hrs post γ-IR. PyroninYlowDAPIlow: G0; PyroninYhighDAPIlow: G1; PyroninYhighDAPIhigh: S/G2/M. n = 3 biological replicates. (E) Quantification of LacZ+ units and the length of LacZ+ cells in Figure 3F. n = 3 biological replicates.

To understand the phenotype resulting from miR-31 modulation, we assayed for apoptotic cells in cKO mice at early stages after irradiation. Loss of miR-31 increased apoptosis in the crypts 2 and 4 hours post-irradiation prior to any overt histological changes (Figure 3B). Quantification of apoptotic cell position analysis reveals that apoptotic events occur with the highest frequently in CBC cells, but are still found in transit-amplifying and +4 zones of cKO crypts, compared to control mice (Figure 3B). Further, flow cytometry for live cell and apoptotic markers within the Lgr5-GFP+ population confirmed higher frequency of late apoptotic Lgr5+ cells (AnnexinV+/7AAD+) and lower frequency of early apoptotic Lgr5+ cells (AnnexinV+/7AAD) and live Lgr5+ cells (AnnexinV-/7AAD-) in cKO mice, relative to controls (Figure 3—figure supplement 1C). These data suggest that loss of miR-31 increases apoptosis of Lgr5+ cells in response to irradiation. Next, we examined its effect on cell proliferation. Cell cycle analysis indicates that more Lgr5-GFP+ cells resided in G0 relative to G1/S/G2/M in cKO mice 2 hours after γ-IR (Figure 3—figure supplement 1D). In agreement, expression levels of Lgr5 were dramatically up-regulated in TRE-miR31 mice and prominently down-regulated in miR-31−/− mice at multiple time points after irradiation (Figure 3C), and consequently miR-31 induction promoted lineage regeneration from Lgr5+ cells in response to irradiation (Figure 3D,E).

Reserve ISCs, marked either by Bmi1-CreER or Hopx-CreER reporters, have been reported to resist high dose of radiation, being able to replenish the depleted CBC compartment and regenerate the epithelium after irradiation (Sangiorgi and Capecchi, 2008; Tian et al., 2011; Takeda et al., 2011; Yan et al., 2012), (Yousefi et al., 2016). Thus, we examined the response of Hopx-CreER-marked reserve ISCs to 12 Gy γ-IR upon miR-31 induction and deletion. Lineage-tracing assay revealed that miR-31 induction promoted epithelial regeneration from the Hopx+ reserve stem cells (Figure 3F and Figure 3—figure supplement 1E). Conversely, the number and the size of regenerative foci originating from Hopx-CreER;Rosa26-LoxP-Stop-LoxP-LacZ-marked cells were markedly reduced in miR-31−/− mice (Figure 3G). In line with this, the frequency of LacZ+/Ki67+ cells was significantly lower in miR-31−/− mutants compared to controls (Figure 3H). Taken together, miR-31 deficiency-mediated the reduction in proliferation and increase in apoptosis within both CBC and reserve ISC compartments can account for the impaired regeneration of miR-31 null intestine.

MiR-31 activates the Wnt pathway and represses the BMP and TGFβ pathways

Canonical Wnt pathway activity is a major driving force for self-renewal of CBCs and epithelial regeneration after injury (Clevers et al., 2014), and, thus we examined the effect of miR-31 on Wnt activity. We utilized Axin2-LacZ Wnt reporter mice, which act as a broad readout for canonical Wnt activity, and normally showed its activity to be restricted to the base of crypts in control mice, as expected (Figure 4A) (Davies et al., 2008). In contrast, Wnt pathway activity was strikingly absent from CBCs of miR-31−/− crypts, appearing only faintly above the crypt base in the early TA zones (Figure 4A). Conversely, Wnt activity was expanded in TRE-miR31 crypts (Figure 4A,B). In agreement, the number of nuclear β-Catenin-positive cells was significantly reduced in miR-31−/− intestinal crypts at 2 and 4 months of age (Figure 4—figure supplement 1A). Conversely, they increase in TRE-miR31 crypts 14 days and 2 months after Dox induction (Figure 4—figure supplement 1B). Consistently, the expression levels of Ctnnb1 (encoding β-Catenin) and the Wnt targets, Ccnd1 (encoding Cyclin D1), Myc and Axin2 were significantly reduced in miR-31−/− intestine both at the RNA and protein levels (Figure 4C,D). In contrast, expression levels of the above genes were enhanced in TRE-miR31 intestinal epithelium following 2 weeks of Dox induction (Figure 4E,F). The reduction in Ctnnb1 and Wnt targets was further confirmed in conditional miR-31 KO intestine (Figure 4G). To test whether Wnt activity is directly impacted by miR-31, we analyzed the effects of gain- and loss-of-function of miR-31 on expression of Wnt target genes in HCT116 human colorectal carcinoma cells. Ccnd1, Ctnnb1, Myc and Axin2 were markedly increased in miR-31 over-expressing cells, relative to controls (Figure 4H). Conversely, these genes were downregulated upon miR-31 inhibition (Figure 4H). Considering that HCT116 cells are heterozygous for a β-Catenin gain-of-function mutation at the Gsk3b target site S45 (Ctnnb1+/S45mt) (Ilyas et al., 1997), (Kaler et al., 2012), we examined β-Catenin protein levels. Consistently, β-Catenin was up-regulated in the presence of miR-31 mimics, and down-regulated upon miR-31 inhibition (Figure 4—figure supplement 1C). The Wnt reporter (Topflash/Fopflash) assay using HCT116 cells further confirmed that miR-31 induction enhanced Wnt activity, while inhibition of miR-31 repressed it (Figure 4I). To test the functional relevance of miR-31 potentiation of canonical Wnt activity, we cultured organoids with varying combinations of miR-31 induction and R-spondin, the Lgr5 ligand. Wnt activation by R-spondin is critical for normal organoid growth and budding (Sato et al., 2011). Interestingly, we observed that miR-31 induction via TRE-miR31 was sufficient to maintain crypt organoid growth and budding in the absence of R-spondin (Figure 4J,K) and that the Dox-treated TRE-miR31 organoids can be normally passaged at least five times, similar to the organoids cultured with R-spondin (Figure 4L). Together, these findings demonstrate that miR-31 activates the canonical Wnt signaling in the crypts of small intestine.

Figure 4. MiR-31 activates Wnt pathway activity.

(A) Wnt activity was evaluated by Axin2-LacZ reporter activity in M2rtTA and TRE-miR31 intestine following 2 week Dox induction, and in miR-31+/− and miR-31−/− intestine. Blue, LacZ signals. n = 3 biological replicates. Scale bar: 25 μm. (B) Quantification of LacZ+ cells per crypt in M2rtTA and TRE-miR31 mice. ***p<0.001. (C) qRT-PCR analysis for Ctnnb1 (encoding β-Catenin), Ccnd1 (encoding Cyclin D1), Myc, and Axin2 in miR-31+/− and miR-31−/− intestine. *p<0.05; **p<0.01; ***p<0.001. (D) Western blotting for Cyclin D1, c-Myc and β-Catenin in miR-31+/− and miR-31−/− intestine. GAPDH was used as a loading control. (E) qRT-PCR for Ccnd1, Myc, Axin2 and Ctnnb1 in intestine from M2rtTA and TRE-miR31 mice following 2 weeks of Dox induction. ***p<0.001. (F) Western blotting for Cyclin D1, c-Myc, and β-Catenin in intestine from M2rtTA and TRE-miR31 mice following 2 weeks of Dox induction. (G) qRT-PCR for Ctnnb1, Ccnd1, Myc, and Axin2 in intestine from Vil-Cre and cKO mice. n = 4 biological replicates. **p<0.01; ***p<0.001. (H) qRT-PCR for Axin2, Ccnd1, Myc, and Ctnnb1 in HCT116 colon cancer cells treated with miR-31 inhibitor and negative control (NC, Scramble RNA), as well as miR-31 mimics and negative control (NC, Scramble RNA) for 24 hrs. ***p<0.001. (I) Luciferase activity of TOPflash versus FOPflash in HCT116 cells treated with miR-31 inhibitor and negative control (NC, Scramble RNA), as well as miR-31 mimics and negative control (NC, Scramble RNA) for 24 hrs. n = 3 technical replicates. ***p<0.001. (J) Representative images of organoids cultures from purified M2rtTA and TRE-miR31 crypts at indicated conditions. R; R-Spondin. n = 3 biological replicates. (K) Quantification of budding organoids in Panel J. ***p<0.001. (L) Representative images of organoids cultures from purified M2rtTA and TRE-miR31 crypts at serial passages. M2rtTA organoids were cultured with R-Spondin; TRE-miR31 organoids were cultured with Dox and without R-Spondin. n = 4 biological replicates.

Figure 4—source data 1. Source data for Figure 4.
DOI: 10.7554/eLife.29538.025
Figure 4—source data 2. Source data for Figure 4—figure supplement 1.
DOI: 10.7554/eLife.29538.026

Figure 4.

Figure 4—figure supplement 1. MiR-31 activates Wnt signaling pathway.

Figure 4—figure supplement 1.

(A) Immunohistochemistry for β-Catenin in jejunum from miR-31+/− and miR-31−/− mice at 2 and 4 months of ages. Quantification of nuclear β-Catenin positive cells in miR-31+/− and miR-31−/− crypts. Scale bar: 25 μm. *p<0.05; **p<0.01. (B) Immunohistochemistry for β-Catenin in jejunum from M2rtTA and TRE-miR31 mice following 7 days, 14 days and 2 months of Dox induction. Quantification of nuclear β-Catenin positive cells in M2rtTA and TRE-miR31 crypts. Scale bar: 25 μm. ***p<0.001. (C) Western blotting for β-Catenin in HCT116 cells under treatment of control (mimics-NC) and miR-31 mimics, or control (inhibitor-NC) and anti-miR31. β-Tubulin was used as a loading control.

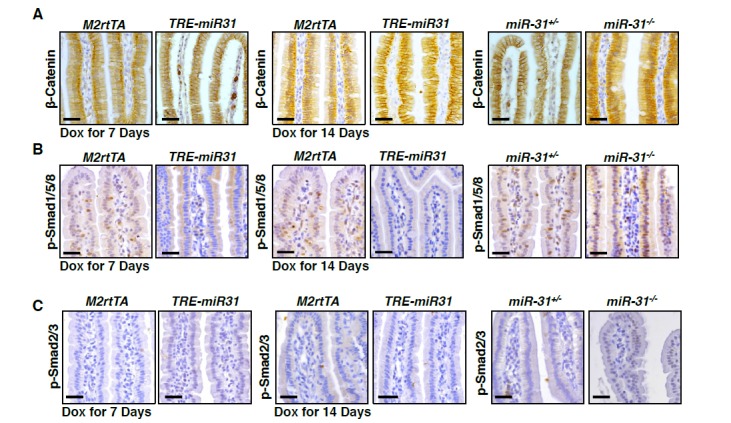
BMP and TGFβ pathways are known to inhibit the canonical Wnt pathway, inhibiting proliferation and promoting intestinal progenitor differentiation (Reynolds et al., 2014; He et al., 2004; Furukawa et al., 2011). We thus examined the effects of miR-31 on BMP and TGFβ signals. BMP-specific Smad1/5/8 and TGFβ-specific Smad2/3 phosphorylation were significantly increased in miR-31−/− intestine (Figure 5A and Figure 5—figure supplement 1A), and downregulated in TRE-miR31 intestine (Figure 5A and Figure 5—figure supplement 1B), suggesting an inhibitory effect of miR-31 on BMP and TGFβ signaling pathways. Consistently, we observed a significant increase on the expression of BMP target genes including Id1, Id2, Id3, Msx1, Msx2 and Junb and TGFβ target genes Cdkn1c (p57), Cdkn1a (p21), Cdkn2a (p16), and Cdkn2b (p15) in miR-31−/− intestine (Figure 5B). Conversely, BMP and TGFβ targets were repressed upon forced expression of miR-31 in TRE-miR31 intestine following 2 weeks of Dox induction (Figure 5C). The upregulation of BMP and TGFβ targets was further confirmed upon conditional miR-31 deletion in cKO intestine (Figure 5D,E). BMP-specific Smad1/5/8 and TGFβ-specific Smad2/3 phosphorylation were also increased in miR-31 cKO cultured organoids (Figure 5—figure supplement 1C). Further, we examined the effect of miR-31 on BMP and TGFβ signaling in HCT116 colorectal cancer cells. These cells carry biallelic mutations in the Tgfbr2 gene, but still express functional TGFBR2 proteins and respond to TGFβ (de Miranda et al., 2015). In line with the in vivo findings, we found down-regulation of p-Smad2/3 and p-Smad1/5/8 in HCT116 cells treated with miR-31 mimics, and their up-regulation in cells treated with miR-31 inhibitor (Figure 5—figure supplement 1D). Luciferase assays using BMP- and TGFβ-responsive luciferase reporters, BRE-Luc and CAGA-Luc, respectively, revealed that inhibition of miR-31 resulted in significant increases in luciferase activities, and that miR-31 mimics decreased them (Figure 5F,G). More importantly, increasing concentrations of the BMP inhibitor Noggin in organoid culture was able to rescue the budding defect in miR-31 cKO organoids in a dose-dependent manner (Figure 5H,I). Together, these data suggest that miR-31 promotes ISC proliferation possibly through repressing BMP and TGFβ signaling pathways in a cell-autonomous manner.

Figure 5. MiR-31 represses BMP/TGFβ signaling pathways.

(A) Western blotting for p-Smad1/5/8 and p-Smad2/3 in miR-31+/−, miR-31−/−, M2rtTA and TRE-miR31 intestine. Both M2rtTA and TRE-miR31 mice were treated with DOX for 2 weeks. β-Tubulin was used as a loading control. (B) qRT-PCR analysis for BMP downstream genes, Id1, Id2, Id3, Msx-1, Msx-2 and Junb, and TGFβ downstream genes, Cdkn1c (p57), Cdkn1a (p21), Cdkn2a (p16), Cdkn2b (p15) and Cdkn1b (p27) in miR-31+/− and miR-31−/− intestine. *p<0.05; **p<0.01; ***p<0.001. (C) qRT-PCR analysis for BMP downstream genes, Id1, Id2, Id3, Msx-1, Msx-2 and Junb, and TGFβ downstream genes, Cdkn1c, Cdkn1a, Cdkn2a, Cdkn2b and Cdkn1b in M2rtTA and TRE-miR31 intestine following 2 weeks of Dox induction. **p<0.01; ***p<0.001. (D) qRT-PCR analysis for TGFβ downstream genes, Cdkn1c, Cdkn1a, Cdkn2a, Cdkn2b and Cdkn1b in intestine from Vil-Cre and cKO mice. *p<0.05; **p<0.01; ***p<0.001. (E) qRT-PCR analysis for BMP downstream genes, Id1, Id2, Id3, Msx2 and Junb in Vil-Cre and cKO intestine. **p<0.01; ***p<0.001. (F and G) HEK293T cells were transfected with CAGA- or BRE- luciferase reporter vector, combined with scramble RNA (negative control, NC) or anti-miR-31 (miR-31 inhibitors) (F), or scramble RNA (negative control, NC) and miR-31 mimics (G) for 24 hrs and then harvested for luciferase activity determination. n = 3 technical replicates. **p<0.01; ***p<0.001. (H) Quantification of organoid forming efficiency (budding organoids per 100 crypts) after Vil-Cre or cKO crypts cultured with noggin at indicated concentrations for 4 days. n = 3 technical replicates. (I) Representative images of organoids from Vil-Cre and cKO crypts cultured with noggin at indicated concentrations (100, 200, 400, 600 and 800 ng/mL) for 4 Days in Panel H.

Figure 5—source data 1. Source data for Figure 5.
DOI: 10.7554/eLife.29538.029

Figure 5.

Figure 5—figure supplement 1. MiR-31 represses BMP and TGFβ signaling pathways.

Figure 5—figure supplement 1.

(A) Immunohistochemistry for p-Smad1/5/8 and p-Smad2/3 in jejunum from miR-31+/− and miR-31−/− mice at 2 months of age. Scale bar: 25 μm. (B) Immunohistochemistry for p-Smad1/5/8 and p-Smad2/3 in jejunum from M2rtTA and TRE-miR31 mice following 7 days and 14 days of Dox induction. Scale bar: 25 μm. (C) Western blotting for p-Smad1/5/8 and p-Smad2/3 in cultured organoids from Vil-Cre and miR-31 cKO crypts. n = 4 biological replicates. β-Tubulin was used as a loading control. (D) Western blotting for p-Smad2/3 and p-Smad1/5/8 in HCT116 cells under treatment of control (mimics-NC) and miR-31 mimics, or control (inhibitor-NC) and anti-miR31. β-Tubulin was used as a loading control, which is identical to Figure 4—figure supplement 1C.

Identification of direct targets of miR-31

To understand how miR-31 regulates Wnt, BMP and TGFβ pathways, we analyzed miR-31 binding sites in 3’UTRs of transcripts encoding for regulators of these pathways. Genes containing miR-31 binding sites include Wnt antagonists Axin1, Gsk3b, and Dkk1, along with transcripts containing BMP/TGFβ signaling pathway components such as Smad3, Smad4, Bmpr1a and Tgfbr2 (Figure 6—figure supplement 1A). The expression of Axin1, Gsk3b, Dkk1, Smad3, Smad4, Bmpr1a and Tgfbr2 was significantly upregulated in miR-31−/− intestine (Figure 6A) and remarkably downregulated in TRE-miR31 intestine following Dox induction (Figure 6B), suggesting that they are negatively regulated by miR-31. The upregulation of these putative target genes was further confirmed in conditional miR-31 KO intestine (Figure 6C). Axin1, Gsk3b, Dkk1, Bmpr1a and Smad4 were selected for further validation at protein level (Figure 6D,E and Figure 6—figure supplement 2A–C) and in organoids cultured from miR-31 cKO mice (Figure 6—figure supplement 3A). This effect was further confirmed in HCT116 cells with miR-31 modulation (Figure 6—figure supplement 3B). Next, we validated the direct repression of target transcripts by miR-31 activity using WT-3’UTR-luciferase constructs for Axin1, Gsk3b, Dkk1, Bmpr1a, Smad3 and Smad4. Mutation of the miR-31 3’UTR binding site in these constructs abrogated this repression (Figure 6F and Figure 6—figure supplement 1B). Furthermore, RNA crosslinking, immunoprecipitation, and RT-PCR (CLIP-PCR) assays with Ago2 antibodies confirmed that transcripts of Axin1, Dkk1, Gsk3b, Smad3, Smad4 and Bmpr1a were highly enriched in Ago2 immunoprecipitates, and that increasing miR-31 activity augmented their enrichment (Figure 6G), providing evidence that miR-31 directly binds to these transcripts. Taken together, these findings indicate that Axin1, Gsk3b, Dkk1, Smad3, Smad4, and Bmpr1a transcripts are the direct targets of miR-31. Next, we asked whether these targets functionally contribute to impaired regeneration in miR-31−/− mice. Derepression of these target transcripts was observed in miR-31−/− intestine after irradiation (Figure 6H,I). As a consequence, Wnt activity was reduced, while the BMP and TGFβ activities were increased in miR-31−/− intestine, evidenced by β-Catenin, p-Smad1/5/8 and p-Smad2/3 immunohistochemistry assays (Figure 6J). Considering that intestinal regeneration following irradiation requires Wnt hyperactivity (Davies et al., 2008), and that BMP activity counterbalances Wnt signaling (He et al., 2004), our findings suggest that miR-31 is an important amplifier of Wnt signaling during intestinal regeneration.

Figure 6. Identification of miR-31 target genes in intestinal epithelium.

(A, B) qRT-PCR analysis for Axin1, Gsk3b, Dkk1, Smad3, Bmpr1a, Smad4 and Tgfbr2 in miR-31+/− and miR-31−/− intestine (A), as well as M2rtTA and TRE-miR31 intestine following 2 weeks of Dox induction (B). **p<0.01; ***p<0.001. (C) qRT-PCR analysis for Axin1, Bmpr1a, Dkk1, Gsk3b, Smad3, and Smad4 in Vil-Cre and cKO intestine. **p<0.01; ***p<0.001. (D) Western blotting for Axin1, Gsk3β, Dkk1, Smad4, and Bmpr1a in miR-31+/− and miR-31−/− intestine. β-Tubulin was used as a loading control, which is identical with Figure 5A. n = 3 biological replicates. (E) Western blotting for Axin1, Gsk3β, Dkk1, Bmpr1a and Smad4 in M2rtTA and TRE-miR31 intestine following 2 weeks of Dox induction. β-Tubulin was used as a loading control. n = 3 biological replicates. (F) Ratio of luciferase activity of miR-31 mimics versus scramble RNA in wild type and mutant 3’UTR constructs based on 3 independent experiments. *p<0.05; **p<0.01; ***p<0.001. (G) RNA crosslinking, immunoprecipitation, and qRT-PCR (CLIP-PCR) assay for Dkk1, Axin1, Gsk3b, Smad3, Smad4 and Bmpr1a upon Ago2 antibody immunoprecipitates in response to miR-31 mimics and scramble RNA (NC). IgG was used as a negative control. (H) qRT-PCR analysis for Axin1, Gsk3b, Dkk1, Smad3, Bmpr1a, Smad4 andTgfbr2 in miR-31+/− and miR-31−/− intestine 4 days post 12 Gy γ-IR. n = 3 biological replicates. *p<0.05; **p<0.01; ***p<0.001. (I) Immunohistochemistry for Axin1, Gsk3β and Dkk1 in miR-31+/− and miR-31−/− intestinal crypts 4 days post 12 Gy γ-IR. Scale bar: 25 μm. (J) Immunohistochemistry for p-Smad2/3, p-Smad1/5/8 and β-Catenin in miR-31+/− and miR-31−/− intestinal crypts 4 days post 12 Gy γ-IR. Scale bar: 25 μm.

Figure 6—source data 1. Source data for Figure 6.
DOI: 10.7554/eLife.29538.034

Figure 6.

Figure 6—figure supplement 1. Identification of miR-31 target genes.

Figure 6—figure supplement 1.

(A) MiR-31 binding sites in 3’UTR of these putative target genes. (B) Mutant binding sites of genes, Axin1, Bmpr1a, Dkk1, Gsk3b, Smad3 and Smad4.
Figure 6—figure supplement 2. Identification of miR-31 target genes.

Figure 6—figure supplement 2.

(A) Immunohistochemistry for Dkk1, Gsk3β, Axin1 and Bmpr1a in jejunum from miR-31+/− and miR-31−/− mice at 2 months of age. Scale bar: 25 μm. (B) Immunohistochemistry for Dkk1, Gsk3β, Axin1 and Bmpr1a in jejunum from M2rtTA and TRE-miR31 mice following 7 days and 14 days of Dox induction. Scale bar: 25 μm.
Figure 6—figure supplement 3. Identification of miR-31 target genes.

Figure 6—figure supplement 3.

(A) Western blotting for Gsk3β, Dkk1, Axin1, Smad4 and Bmpr1a in cultured organoids from Vil-Cre and miR-31 cKO crypts. n = 4 technical replicates. β-Tubulin was used as a loading control. (B) Western blotting for Dkk1, Axin1, Gsk3β, Smad4 and Bmpr1a in HCT116 cells under treatment of control (mimics-NC) and miR-31 mimics, or control (inhibitor-NC) and anti-miR-31. β-Tubulin was used as a loading control, which is identical to Figure 4—figure supplement 1C and Figure 5—figure supplement 1D.

MiR-31 contributes to tumor growth through Wnt activation and TGFβ and BMP repression

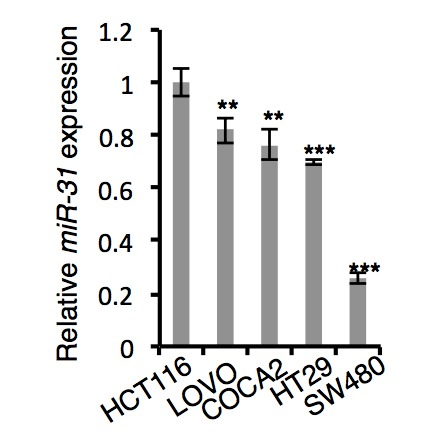
Given that miR-31 promotes proliferation and inhibits apoptosis in the ISCs, it is plausible that miR-31 may function in intestinal tumorigenesis. Supporting this notion, miR-31 has been found to be upregulated in human colorectal cancers and in colitis (Bandrés et al., 2006; Cottonham et al., 2010; Wang et al., 2009; Yang et al., 2013). We tested the role of miR-31 in intestinal tumorigenesis and observed that miR-31 mimics promoted proliferation of HCT116, SW480 and LOVO colon cancer cells in vitro (Figure 7—figure supplement 1A). Conversely, inhibition of miR-31 with anti-miR-31 abrogated growth of these cells (Figure 7—figure supplement 1A). We further performed xenograft assays using miR-31 mimics- and inhibitor-treated HCT116 cells. Thirty days after grafting, tumor volume and weight were increased in miR-31 mimic-treated tumors, and markedly reduced in miR-31 knockdown tumors (Figure 7A). The decrease in tumor size from miR-31 inhibition coincided with the reduction in Ki67+ and Cyclin D1+ proliferating cells (Figure 7B and Figure 7—figure supplement 1B), and correlated with reduced Wnt activity and increased BMP and TGFβ activities (Figure 7—figure supplement 1B). To verify these findings in more physiologically relevant settings, we examined tumor formation in the AOM-DSS (Azoxymethane-Dextran Sodium Sulfate) model of the inflammation-driven colorectal adenocarcinoma (De Robertis et al., 2011). In comparison with the controls, we observed a marked decrease in both tumor size and number in miR-31−/− mice (Figure 7C), along with a concomitant reduction in proliferating cells (Figure 7D,E), and reduced Wnt pathway and increased BMP and TGFβ activity (Figure 7D,F). This tumor-promoting effect of miR-31 in mice became even more evident when miR-31 was deleted in Vil-Cre;Apcflox/+ mice. Intestinal adenomas form in this mouse model upon loss of heterozygosity at the Apc locus, which is relevant to human disease in that spontaneous loss of Apc is found in the vast majority of human colorectal cancer (Kinzler et al., 1991; Nagase et al., 1992). Loss of miR-31 in this animal model remarkably reduced tumor burden (Figure 7G), which was associated with decreased Wnt activity, enhanced BMP and TGFβ signaling, and decreased proliferating cells (Figure 7H–J and Figure 7—figure supplement 1C). Correspondingly, the miR-31 targets Axin1, Dkk1, Gsk3β, Smad4 and Bmpr1a were up-regulated in the miR-31 null tumors (Figure 7—figure supplement 1D). Together, these data demonstrate that miR-31 plays an oncogenic role in intestinal and colorectal tumorigenesis by mediating activation of Wnt and repression of BMP and TGFβ signaling pathways.

Figure 7. MiR-31 promotes tumor growth in vivo.

(A) Gross appearance of tumors of HCT116 colorectal cancer cell xenograft 30 days post transplantation. HCT116 colorectal cancer cells were transfected with mimics-NC or miR-31 mimics, and inhibitor-NC or anti-miR-31 (inhibitor) for 36 hrs before xenograft. NC-mimics, n = 5; miR-31 mimics, n = 5; NC-inhibitor, n = 4; anti-miR-31, n = 5. Quantification of tumor volume and tumor weight at indicated conditions. **p<0.01; ***p<0.001. Scale bar: 1 cm. (B) Quantification of Ki67+ and Cyclin D1+ cells in NC-inhibitor and miR-31 inhibitor treated tumors in Figure 7—figure supplement 1B. ***p<0.001. (C) Representative photograph of distal colon resected from WT and miR-31−/− mice at the end of AOM-DSS protocol. Frequency and tumor size of inflammation-driven colorectal adenomas in mice treated with the AOM-DSS protocol, with or without miR-31 deletion. n = 6 mice per group, *p<0.05; **p<0.01. (D) H&E, and immunohistochemistry for Ki67, β-Catenin and p-Smad1/5/8 in adenomas of WT and miR-31−/− mice resulting from AOM-DSS treatment. Scale bar: 100 μm. (E) Quantification of Ki67+ cells in Panel D. ***p<0.001. (F) Western blotting for p-Smad2/3, p21, Axin1, β-Catenin, Cyclin D1 in adenomas of WT and miR-31−/− mice resulting from AOM-DSS treatment. β-Tubulin was used as a loading control. (G) Representative photograph of intestine resected from Vil-Cre;Apcfl/+ and Vil-Cre;Apcfl/+;miR-31−/− mice at 6 months of age. Arrows point to tumors. Quantification of tumor number and tumor volume in intestines from these mice. n = 6 biological replicates. ***p<0.001. (H) Representative histology of intestine resected from Vil-Cre;Apcfl/+ and Vil-Cre;Apcfl/+;miR-31−/− mice at 6 months of age. Arrows point to tumors. Scale bar: 2.5 mm. (I) Immunohistochemistry for β-Catenin and quantification of nuclear β-Catenin positive cells in Vil-Cre;Apcfl/+ and Vil-Cre;Apcfl/+;miR-31−/− tumors. (Black, Vil-Cre;Apcfl/+; Blue, Vil-Cre;Apcfl/+;miR-31−/−). n = 6 biological replicates. Scale bar: 50 μm. ***p<0.001. (J) Immunohistochemistry for p-Smad2/3, p-Smad1/5/8 and Ki67 in Vil-Cre;Apcfl/+ and Vil-Cre;Apcfl/+;miR-31−/− tumors. Scale bar: 50 μm.

Figure 7—source data 1. Source data for Figure 7.
DOI: 10.7554/eLife.29538.037
Figure 7—source data 2. Source data for Figure 7—figure supplement 1.
DOI: 10.7554/eLife.29538.038

Figure 7.

Figure 7—figure supplement 1. MiR-31 promotes tumor growth.

Figure 7—figure supplement 1.

(A) In vitro MTT proliferation assay of human colorectal cancer cell lines, HCT116, SW480 and LOVO upon transfection of miR-31 inhibitor (anti-miR-31), and inhibitor-NC, as well as miR-31 mimics and mimics-NC. n = 3 technical replicates. (B) H&E, and immunohistochemistry for Ki67, Cyclin D1, β-Catenin, p-Smad1/5/8 and p-Smad2/3 in inhibitor-NC and miR-31 inhibitor treated tumors in Figure 7A. n = 3 biological replicates. Scale bar: 50 μm. (C) Quantification of p-Smad2/3+, p-Smad1/5/8+ and Ki67+ cells in Vil-Cre;Apcfl/+ and Vil-Cre;Apcfl/+;miR-31−/− tumors shown in Figure 7J. n = 3 biological replicates. ***p<0.001. (D) Immunohistochemistry for Dkk1, Axin1, Gsk3β, Smad4 and Bmpr1a in Vil-Cre;Apcfl/+ and Vil-Cre;Apcfl/+;miR-31−/− tumors. n = 4 biological replicates. Scale bar: 50 μm.

STAT3 signaling pathway mediated miR-31 expression in response to irradiation

Lastly, we asked how radiation injury induces miR-31 expression. We analyzed a 2 kb region upstream of the transcription start site of the miR-31 gene locus for the potential binding sites of transcription factors using the JASPAR database and identified one STAT3 and two NF-κB binding sites (Figure 8A). Interestingly, the STAT3 and NF-κB signaling pathways were shown to be activated in response to γ-IR, evidenced by p-STAT3 and p65 levels, respectively (Figure 8B,C). The activation of the STAT3 pathway occurred mainly in the regenerative foci where miR-31 is highly induced, while NF-κB was more prominently activated in villi where little miR-31 is present and not in the regenerative foci (Figure 8D). This suggested a link between STAT3 activity and miR-31 upon irradiation. To verify whether active STAT3 signaling could induce miR-31 expression, mICc12 intestinal epithelial cells were treated with IL-6, a known activator of the STAT3 signaling. Indeed, miR-31 expression was significantly induced upon IL-6 treatment (Figure 8E), concomitant with the activation of the STAT3 pathway (Figure 8F). In contrast, inhibition of STAT3 signaling with Stattic prominently dampened miR-31 induction response to IL-6 treatment (Figure 8G), and reduced STAT3 signaling (Figure 8H). This inhibitory effect on miR-31 expression was further validated using Stat3 siRNA (Figure 8I,J). Importantly, miR-31 was induced by IL-6 in the organoid cultures, indicating that this is an epithelial cell-autonomous mechanism (Figure 8K). Luciferase reporter assays reveal that IL-6 is able to induce its activity, while mutation of the p-STAT3 binding site blocked it (Figure 8L). Furthermore, Chromatin Immunoprecipitation (ChIP) assays show that p-STAT3 is recruited to its binding site on the miR-31 promoter (Figure 8M). Thus, our data strongly suggest that STAT3 activity potentiates miR-31 induction to promote crypt regeneration in response to radiation injury.

Figure 8. The STAT3 pathway mediates the induction of miR-31 caused by γ-IR.

Figure 8.

(A) The schematic diagram showed two potential p65 binding sites and one p-STAT3 binding site in the miR-31 promoter. (B) qRT-PCR analysis for Rela, Ikk-b, IL-1, IL-6, IL-18, Tnf and Stat3 in the intestinal epithelium 4 days after exposure to 12 Gy γ-IR, relative to non-irradiated controls. n = 3 biological replicates. *p<0.05, **p<0.01, ***p<0.001. (C) Western blotting for STAT3, p-STAT3, p65 and p-p65 in the intestinal epithelium 4 days after exposure to 12 Gy γ-IR, relative to non-irradiated controls. n = 3 biological replicates. (D) Immunohistochemistry for p-STAT3 and p65 in control and the intestinal epithelium 4 days after exposure to 12 Gy γ-IR. n = 3 biological replicates. Scale bar: 25 μm. (E) qRT-PCR for miR-31 in mouse intestinal epithelial cell line (mICc12) in response to IL-6 with concentrations of 20, 40, 80, 100 and 150 ng/mL. n = 3 technical replicates. **p<0.01; ***p<0.001. (F) Western blotting for STAT3 and p-STAT3 in mICc12 cells in response to 40 ng/mL IL-6. (G) qRT-PCR analysis for miR-31 in mICc12 cells treated with IL-6 and STAT3 inhibitor, Stattic. **p<0.01; ***p<0.001. (H) Western blotting for p-STAT3 in mICc12 cells treated with IL-6 and Stattic. (I) qRT-PCR analysis for miR-31 in mICc12 cells treated with Stat3 siRNA. ***p<0.001. (J) Western blotting for STAT3 and p-STAT3 in mICc12 cells treated with STAT3 siRNA. (K) qRT-PCR analysis for miR-31 in cultured organoids treated with IL-6. n = 4 technical replicates. ***p<0.001. (L) Luciferase activity in lysates of mICc12 cells transfected with luciferase reporter plasmids of pGL3-basic empty vector (basic), wild type miR-31 promoter or mutant promoter with mutation of p-STAT3 binding sites. ***p<0.001. (M) Chromatin immunoprecipitation (ChIP) assay carried out on mICc12 cells using antibodies against p-STAT3 and Histone 3. The antibody against Histone 3 was used as a positive control. The enrichment of p-STAT3 binding to miR-31 promoter was quantified using qPCR. ***p<0.001.

Figure 8—source data 1. Source data for Figure 8.
DOI: 10.7554/eLife.29538.040

Discussion

The intestinal epithelium is one of the most rapidly renewing tissues (Leblond and Walker, 1956). Those Lgr5+ CBC stem cells residing at the base of crypts maintain the proliferative capacity necessary to meet this demands of high-turnover tissue, which is driven by activation of the canonical Wnt pathway, as well as repression of BMP signaling (Li and Clevers, 2010), (Li et al., 2014), (Kosinski et al., 2007). Wnt pathway activity and BMP inhibition are believed to be the niche for cycling CBCs. However, it is largely unknown how those Lgr5+ CBCs integrate the signals of Wnt antagonists and activators of BMP and TGFβ. Here we show that the miR-31 activates Wnt signaling by directly repressing a cohort of Wnt antagonists Dkk1, Axin1 and Gsk3b, and represses BMP/TGFβ signaling by directly inhibiting activators of the pathways, Smad3, Smad4 and Bmpr1a, pointing to an important role of miR-31 acting as a rheostat to integrating niche signals sensed by cycling CBCs. In agreement with this point, our in vivo analysis demonstrated that miR-31 induction increases the number of Lgr5+ CBCs whereas miR-31 deletion reduces CBC frequency. Niche Wnt signals likely originate from sub-epithelial telocytes whose presence is required for CBC activity, and possibly to a lesser extent from Paneth cells, who secrete Wnt ligands but are dispensable for CBC activity (Durand et al., 2012; Aoki et al., 2016; Sato et al., 2011; Kim et al., 2012; San Roman et al., 2014; Kabiri et al., 2014). BMP antagonists noggin and gremlin are similarly secreted by sub-mucosal tissues below the crypts (Kosinski et al., 2007), repressing the BMP signaling in CBCs. Thus, sub-epithelial mesenchyme constitutes an extrinsic niche for cycling ISCs. In contrast to secretory signals from an extrinsic niche, miR-31 appears to be an intrinsic coordinator of these extrinsic niche signals, supporting canonical Wnt and represses BMP/TGFβ signals within CBCs. Thus, we identify miR-31 as a cell-autonomous post-transcriptional regulator of the ISC niche, maintaining proliferative capacity of cycling CBC cells. In addition, we also noticed that miR-31 loss resulted in an increased apoptosis in CBC cells, suggesting the importance of miR-31 in maintaining cell survival. The molecular mechanism by which miR-31 protects against apoptosis warrants future study.

The response to high dose of γ-IR can be separated into two distinct stages. First, within 24 hours, the majority of CBCs die via apoptosis and subsequent mitotic death, caused by residual misrepaired and unrepaired of DNA double-strand breaks (Hua et al., 2012). Next, between 24 hours and 4 days after γ-IR, rare surviving CBCs and quiescent reserve ISCs enter the cell cycle and form regenerative foci that produce mitotically active Lgr5+ cells that repair lost epithelium (Yousefi et al., 2016; Hua et al., 2012). We assume that reserve ISCs also undergo the same process, although lack of direct evidence. In line with this, miR-31 is dramatically reduced within the first 24 hours post γ-IR, most likely due to loss of CBCs. Loss of miR-31 led to an marked increase in apoptosis in both CBCs and +4 cells 2 hours post-γ-IR. Based on our data, we conclude that during the first stage miR-31 acts as an anti-apoptotic factor, protecting CBCs and reserve ISCs against apoptosis. During the second stage, the surviving stem cells start proliferating to repopulate the depleted intestinal epithelium. The surviving stem cells are relatively damage-resistant (Tian et al., 2011; Takeda et al., 2011; Li et al., 2014; Yousefi et al., 2016; Ritsma et al., 2014), a property attributed to their quiescence, a state likely maintained by BMP/TGFβ signaling and inactivation of Wnt signaling (Li et al., 2014; Yousefi et al., 2016; He et al., 2004). We show that miR-31 is prominently induced at the regenerative foci 36 hr post-γ-IR and that miR-31 activates Wnt, and represses BMP/TGFβ activities. This points to the potential importance of miR-31 in activating the surviving ISCs. Given BMP/TGFβ inhibiting ability of miR-31, we speculate that the homeostatic insensitivity of reserve ISCs to Wnt ligands (Yan et al., 2012) results from their having active BMP and TGFβ pathways, that must be suppressed for cells to become competent to respond to Wnt ligands. Our findings suggest that miR-31 functions as an activator of dormant reserve ISCs. We also want to mention that the expression patterns of Bmi1 and Hopx are not specific to +4 position, as both of these transcripts are found non-specifically throughout the crypt base (Li et al., 2014; Muñoz et al., 2012; Itzkovitz et al., 2011). This means that miR-31-activated stem cells represent a complex population including +4 cells, surviving Lgr5+ cells, and those TA cells dedifferentiated in response to irradiation. Taken together, our findings suggest that miR-31 functions as the anti-apoptotic factor in ISCs during the early post-γ-IR stage, and, potentially, serves as the cell-intrinsic activator of surviving ISCs regenerative foci promoting regeneration. Future studies will be needed to comprehensively test this idea.

Many reports have showed that miR-31 is overexpressed in CRC tissues (Bandrés et al., 2006; Cottonham et al., 2010; Wang et al., 2009) and increases in progressively during progression from normal to inflammatory bowl disease (IBD) to IBD-related neoplasia (Olaru et al., 2011). We demonstrate that miR-31 promotes tumor development using several models, including cancer cells xenografting, AOM- and DSS- induced inflammation-driven tumors, and Apc-loss driven tumors, characterized by activated Wnt, and repressed BMP/TGFβ signalings. Indeed, several reports showed that miR-31 is overexpressed in colorectal cancer (CRC) tissues (Bandrés et al., 2006; Cottonham et al., 2010; Wang et al., 2009). Wnt signaling is aberrantly up-regulated in CRCs, which due primarily to mutations in the Wnt antagonist APC (Novellasdemunt et al., 2015). Our current study suggests that miR-31 up-regulation might also contribute to Wnt activation in CRCs. In addition, decreased BMP and TGFβ signaling is also often found in CRCs (Bellam and Pasche, 2010; Hardwick et al., 2008), and can be the consequence of miR-31 upregulation. As such, our data suggests that miR-31 acts as the oncogenic microRNA in CRCs. Moreover, tight association between miR-31 induction and STAT3 pathway activation in intestinal tissues is worth noting. Our molecular data suggest direct activation of miR-31 expression by STAT3 signaling pathway. Indeed, many reports showed that constitutive activation of STAT3 is frequently detected in primary human colorectal carcinoma (Kusaba et al., 2005; Corvinus et al., 2005) and contributes to invasion, survival, and growth of colorectal cancer cells (Tsareva et al., 2007; Lin et al., 2005). Therefore, our current study suggests a signaling pathway involving STAT3, miR-31 and WNT/BMP/TGFβ that promotes colorectal tumorigenesis.

In summary, we propose a model in which miR-31 functions as a cell-intrinsic master modulator of the intestinal stem cell niche signaling during normal homeostasis, regeneration and tumorigenesis (Figure 9). During homeostasis, miR-31 functions to integrate niche signals, supporting canonical Wnt activity and represses BMP/TGFβ signaling pathways within cycling CBC stem cells. MiR-31 is stress inducible and plays an important role in epithelial regeneration. In response to high dose of γ-IR, miR-31 is markedly induced via STAT3 signaling pathway, and appears capable of regulating the activation state of a population of dormant, radiation resistant reserve ISCs during regeneration. Further, we demonstrate that miR-31 acts as an oncomiR in promoting tumor growth.

Figure 9. The miR-31 working model in intestinal epithelial regeneration and tumorigenesis.

Figure 9.

Materials and methods

Animal experiments

All mouse experiment procedures and protocols were evaluated and authorized by the Regulations of Beijing Laboratory Animal Management and strictly followed the guidelines under the Institutional Animal Care and Use Committee of China Agricultural University (approval number: SKLAB-2011-04-03).

Mouse strains

To generate TRE-miR-31 transgenic mice, the mmu-miR-31 sequence was amplified using the following primers: Forward 5’-CTCGGATCCTGTGCATAACTGCCTTCA-3’ (BamHI site was added), and Reverse 5’-CACAAGCTTGAAGTCAGGGCGAGACAGAC-3’ (HindIII site was added), and was inserted into pTRE2 vector (Clontech) to generate a pTRE2-miR31 construct. TRE-miR31 transgenic mice were produced using standard protocols and crossed with Rosa26-rtTA mice which harboring the modified reverse tetracycline transactivator (M2rtTA) targeted to and under transcriptional control of the Rosa26 locus. Constitutive miR-31−/− mice were generated using CRISPR/Cas9 approach at the Nanjing Animal Center, and 402 bp DNA fragment containing miR-31 was deleted to produce the null allele. Conditional miR-31 KO allele was generated at the Shanghai Model Animal Center, the first exon (14806–15522) of miR-31 was targeted with flanking LoxP sites resulting in the 2 LoxP locus. Villin-Cre (Vil-Cre) mice were purchased from the National Resource Center of Model Mice (stock number:T000142). mTmG, Lgr5-eGFP-CreERT, Apc floxed, and Rosa26-LSL-lacZ mice were obtained from Jackson Laboratories (stock number: 007576, 008875, 009045 and 009427). Hopx-CreERT mice were obtained from John Epstein laboratory. Axin2-LacZ mice were obtained from Yi Zeng laboratory.

Cell culture

HCT116, SW480 and LOVO human colorectal cancer cell lines are purchased from American Type Culture Collection (ATCC) and the mouse mICc12 intestinal epithelial cell line was obtained from the Institute of Interdisciplinary Research (Fudan University, Shanghai, China) who originally obtained them from Dr A Vandervalle (Institut National de la Santé et de la Recherche Médicale, Faculté X, Paris, France). They were confirmed to come from a mouse cell line by Beijing Microread Genetics Co., Ltd using STR profiling. No cell lines are on the list of commonly misidentified cell lines. We have tested for mycoplasma contamination using a Mycoplasma Detection Kit, and no mycoplasma contamination was detected in any of the cultures. These cell lines were cultured in DMEM/F12 medium. The sequence of miR-31 inhibitor is 5’-AGCUAUGCCAGCAUCUUGCCU-3’. The sequence of Scramble RNA is 5’-CAGUACUUUUGUGUAGUACAA-3’. The Sequence of miR-31 mimics:

5’-AGGCAAGAUGCUGGCAUAGCU-3’

3’-CUAUGCCAGCAUCUUGCCUUU-5’

The sequence of negative control for miR-31 mimics:

5’-UUCUCCGAACGUGUCACGUUU-3’

3’-ACGUGACACGUUCGGAGAAUU-5’.

Doxycycline induction and isolation of intestinal epithelium

For the induction, 2 mg/mL Dox (Doxycycline hyclate, Sigma) was added to the drinking water along with 1% w/v sucrose. Mice were induced at 8 weeks of age. To isolate intestinal epithelial cells, mouse intestine was dissected longitudinally and rinsed three times with ice-cold 1x DPBS, then cut into 2–4 mm long pieces, incubated in 1x DPBS containing 2 mM EDTA and 0.2 mM DTT for 30 min at 4°C on a rotating platform. Suspended cells were then collected folowing gentle vortexing. To isolate intestinal crypts, rinsed small intestine was cut-opened and and villi were scraped using coverslip glass, the technique which left the crypts attached. Crypts were then detached after tissue incubation in 1x DPBS with 2 mM EDTA for 30 min at 4°C with gentle vortexing. Isolated crypts were counted and pelleted as previously described (Sato et al., 2009).

Flow cytometry

Dissected intestine was incubated with 5 mM EDTA and 1.5 mM DTT in HBSS for 30 min at 4°C. Single cell suspension was produced following Dispase (BD Biosciences) treatment and passing cells through 40 μm cell strainer. Flow cytometry analysis was performed using BD LSR Fortessa cell analyzer (BD Biosciences). PI-negative cells were selected, then gated for single cells based on the forward-scatter height vs. forward-scatter width (FSC-H vs. FSC-W) and side-scatter height vs. side-scatter width (SSC-H vs. SSC-W) profiles. The size of the nozzle for all sorting runs was 100 μm (20 psi). Lgr5-eGFP+ cells were quantified by flow cytometry in TRE-miR31;Lgr5-eGFP-CreERT and M2rtTA;Lgr5-eGFP-CreERT mice after two weeks of Dox treatment. Lgr5-eGFP+ cells in miR-31+/−;Lgr5-eGFP-CreERT and miR-31−/−;Lgr5-eGFP-CreERT mice were quantified using the same method.

Crypt organoid culture

Crypt culture was performed as previously described in Sato et al. (2009). A total of 500 isolated crypts from TRE-miR31, M2rtTA, Vil-Cre and Vil-Cre;miR31fl/fl (cKO) mice were mixed with 80 μL of matrigel (BD Bioscience) and plated in 24-well plates. After matrigel polymerization, 500 μL of crypt culture medium [advanced DMEM/F12 (Gibco), 2 mM Glutamax (Invitrogen), 100 U/mL penicillin, 100 μg/mL streptomycin (Sigma), 1 mM N-acetyl cysteine (Sigma), B27 supplement (Invitrogen), N2 supplement (Invitrogen), 50 ng/mL mouse, EGF (Peprotech), 100 ng/mL mouse Noggin (Peprotech) and 10% human R-spondin-1 (Peprotech)] was added to M2rtTA, Vil-Cre and Vil-Cre;miR-31fl/fl small intestine crypt cultures. For TRE-miR31 culture, human R-spondin-1 was removed from the medium, and instead 2 μg/mL of Dox was added.

Hybridization

For miR-31 in situ hybridizations, digoxigenin (DIG)-labeled probes (Exiqon) were used following the manufacturer’s protocol. Both DIG-labeled miR-31 and scrambled probes (Exiqon) were hybridized at 61°C. U6 probe was used as the positive control. In situ signals were detected by staining with Anti-DIG-AP antibody (Roche) and developed using BM purple substrate (Roche).

Quantitative RT-PCR

Total RNA was isolated from total mouse small intestinal epithelial cells using TRIzol reagent (Life Technologies) according to the manufacturer’s instructions. Each RNA sample was reverse transcribed with the M-MLV Reverse Transcriptase (Sigma) using Oligo (dT) primers. Real-time PCR was performed using the LightCycler 480 SYBR Green I master mix on a LightCycler 480 real-time PCR system (Roche). qRT-PCR primers were follows:

Axin1-forward: 5’- TTCTGGGTTGAGGAAGCAGC −3’; Axin1-reverse: 5’- GATTAGGGGCTGGATTGGGT-3’;

Axin2-forward: 5’- GGCTAGCTGAGGTGTCGAAG −3’; Axin2 -reverse: 5’- GCCAGTTTCTTTGGCTCTTT −3’;

Ctnnb1-forward: 5’- TCCTAGCTCGGGATGTTCAC −3’; Ctnnb1 -reverse: 5’- TTCTGCAGCTTCCTTGTCCT −3’;

Bmpr1a-forward: 5’- GCTGTCATCATCTGTTGTCCTGG −3’; Bmpr1a-reverse: 5’- CATTACCACAAGGGCTACACCACC −3’;

Myc-forward: 5’- CTACTCGTCGGAGGAAAG −3’; Myc-reverse: 5’- ACTAGACAGCATGGGTAAG −3’;

Ccnd1-forward: 5’- TGGTGAACAAGCTCAAGTGG −3’; Ccnd1-reverse: 5’- GGCGGATTGGAAATGAACT −3’;

Dkk1-forward: 5’- TCCGAGGAGAAATTGAGGAA −3’; Dkk1-reverse: 5’- CCTGAGGCACAGTCTGATGA −3’;

Gsk3b-forward: 5’- CCAACAAGGGAGCAAATTAGAGA −3’; Gsk3b-reverse: 5’- GGTCCCGCAATTCATCGAAA −3’;

Id1-forward: 5’- ACCCTGAACGGCGAGATC −3’; Id1-reverse: 5’- GCGGTAGTGTCTTTCCCAGA −3’;

Id2-forward: 5’- CTACTCGTCGGAGGAAAG −3’; Id2 -reverse: 5’- ACTAGACAGCATGGGTAAG −3’;

Id3-forward: 5’- TCCGGAACTTGTGATCTCCA −3’; Id3-reverse: 5’- GTAAGTGAAGAGGGCTGGGT −3’;

Junb-forward: 5’- CGGATGTGCACGAAAATGGA −3’; Junb-reverse: 5’- GACCCTTGAGACCCCGATAG −3’;

Msx1-forward: 5’- CAGAGTCCCCGCTTCTCC −3’; Msx1-reverse: 5’- CTGAGCGAGCTGGAGAATTC −3’;

Msx2-forward: 5’- TTCACCACATCCCAGCTTCT −3’; Msx2-reverse: 5’- TTCAGCTTTTCCAGTTCCGC −3’;

Cdkn2b-forward: 5’- GCCCAATCCAGGTCATGATG −3’; Cdkn2b-reverse: 5’- TCACACACATCCAGCCGC −3’;

Cdkn2a-forward: 5’- AGAGCTAAATCCGGCCTCAG −3’; Cdkn2a -reverse: 5’- CTCCCTCCCTCCTTCTGCT −3’;

Cdkn1a-forward: 5’- ATCACCAGGATTGGACATGG −3’; Cdkn1a -reverse: 5’- CGGTGTCAGAGTCTAGGGGA −3’;

Cdkn1b-forward: 5’- GGGGAACCGTCTGAAACATT −3’; Cdkn1b -reverse: 5’- AGTGTCCAGGGATGAGGAAG −3’;

Cdkn1c-forward: 5’- GTTCTCCTGCGCAGTTCTCT −3’; Cdkn1c -reverse: 5’- GAGCTGAAGGACCAGCCTC −3’;

Smad3-forward: 5’- ACAGGCGGCAGTAGATAACG −3’; Smad3-reverse: 5’- AACGTGAACACCAAGTGCAT −3’;

Smad4-forward: 5’- GGCTGTCCTTCAAAGTCGTG −3’; Smad4-reverse: 5’- GGTTGTCTCACCTGGAATTGA −3’;

Tgfbr2-forward: 5’- TTGTTGAGACATCAAAGCGG −3’; Tgfbr2-reverse: 5’- ATAAAATCGACATGCCGTCC −3’;

Rela-forward: 5’- agataccaccaagacccacc-3’; Rela-reverse: 5’- ggtgaccagggagattcgaa −3’;

Ikkb-forward: 5’-agaagtacaccgtgaccgtt-3’;Ikkb-reverse: 5’-gggaagggtagcgaacttga-3’;

IL-1-forward: 5’- tacctgtgtctttcccgtgg-3’; IL-1-reverse: 5’- ttgttcatctcggagcctgt-3’;

IL-6-forward: 5’- gccagagtccttcagagaga-3’; IL-6-reverse: 5’-ggtcttggtccttagccact-3’;

IL-18-forward: 5’- gtctaccctctcctgtaagaaca-3’; IL-18-reverse: 5’- tggcaagcaagaaagtgtcc-3’;

Tnf-forward: 5’- aatggcctccctctcatcag-3’; Tnf-reverse: 5’- cccttgaagagaacctggga-3’;

Stat3-forward: 5’- tgacatggatctgacctcgg-3’; Stat3-reverse: 5’- tgcccagattgcccaaagat −3’;

For quantification of microRNA expression, mature miR-31 was quantified using TaqMan microRNA assays according to the manufacturer’s instructions. U6 snRNA was used as the internal control (Applied Biosystems).

Histology, immunofluoresence, and immunochemistry

Intestines were rinsed with 1x DPBS, fixed in 10% formalin, paraffin-embedded and sectioned at 5 μm. Sections were stained with hematoxylin and eosin (H&E). For immunohistochemistry, antigen retrieval was performed by heating slides in 0.01 M citrate buffer (pH 6.0) in a microwave. Sections were then immunostained using ABC peroxidase method (Vector labs) with diaminobenzidine (DAB) as the enzyme substrate and hematoxylin as the counterstain. For immunofluorescence staining, paraffin sections were microwave pretreated in 0.01 M citrate buffer (pH 6.0), and incubated with primary antibodies, then incubated with secondary antibodies (Invitrogen) and counterstained with DAPI in the mounting medium (Vector labs). The following antibodies were used: anti-Ki67 (1:150, Leica), anti-GFP (1:200, Abcam), anti-Axin1 (1:100, Cell Signaling), anti-Gsk3β (1:2000, Abcam), anti-Dkk1 (1:50, Santa Cruz), anti-β-Catenin (1:500, Sigma), anti-BrdU (1:50, Abcam), anti-cleaved Caspase3 (1:100, Cell Signaling), anti-p-Smad1/5/8 (1:200, Cell Signaling), anti-p-Smad2/3 (1:200, Cell Signaling), anti-CyclinD1 (1:50, Abcam), anti-p65 (1:400, Cell Signaling), anti-p-STAT3 (1:800, Cell Signaling).

Dual luciferase activity assays

To generate reporter constructs for luciferase assays, 300–600 bp fragments in length containing predicted miR-31 target site in the 3’UTRs of Axin1, Dkk1, Bmpr1a, Gsk3b, Smad3 and Smad4 were cloned into the psiCHECK-2 vector (Promega) between the XhoI and NotI sites immediately downstream of the Renilla luciferase gene. To generate reporters with mutant 3’UTRs, nucleotides in the target site complementary to the sequence of the miR-31 seed region sequence were mutated using QuikChange Site-Directed Mutagenesis kit according to the manufacturer’s protocol (Stratagene).

293T cells were seeded in 96-well plates one day before transfection. 10 ng of each reporter construct was co-transfected with miR-31 mimics or scramble RNA at a final concentration of 50 nM into 293T cells using Lipofectamine 2000 according to the manufacturer’s protocol (Invitrogen). After 24 hr, firefly and renilla luciferase activities were measured with the Dual-Glo luciferase assay system according to the manufacturer’s instructions (Promega) and then be calculated using this formula (WT-mimics/WT-mimics NC) /(MUT-mimics/MUT-mimic NC).

The primers used for amplifying 3’-UTRs of candidate target genes of miR-31 were as follows:

Dkk1-forward: 5’-GCGCTCGAGTGGGCTTGAATTTGGTAT-3’; Dkk1-reverse:5’-TTAGCGGCCGCGTCCCGACTATCCTGTGA-3’;

Smad3-forward: 5’-CCGCTCGAGCACCACACCGAATGAATG-3’; Smad3-reverse: 5’-ATAAGAATGCGGCCGCTGGCAATCCTTTACCATAGC-3’;

Gsk3b-forward: 5’-TTAGCGGCCGCTCAGTTTCACAGGGTTAT-3’; Gsk3b-reverse: 5’-GCGCTCGAGACAAAGGCATTCAAGTAG-3’;

Axin1-forward: GCCTCGAGTCAGTCAGGTGGACAGCC; Axin1-reverse:TAGCGGCCGCACACGGACACTTGGAAGG;

Bmpr1a-forward: GCCTCGAGAATTAAACAATTTTGAGGGAG; Bmpr1a-reverse: TTGCGGCCGCCTACAGTTACAAGGTGGAT;

Smad4-forward: 5’- TTACTCCTAGCAGCACCC −3’; Smad4-reverse: 5’-CAGTTGTCGTCTTCCCTC-3’;

Western blotting

For western blotting assay, intestinal epithelial tissues were lysed in lysis buffer (Beyotime, China) with 1% PMSF (Phenylmethylsulfonyl fluoride). After quantification using a BCA protein assay kit (Beyotime, China), 30 μg of total protein was separated by 10% SDS-PAGE under denaturing conditions and transferred to PVDF membranes (GE Healthcare). Membranes were blocked in 5% nonfat dry milk in incubation buffer and incubated with primary antibodies, followed by incubation with the secondary antibody and chemiluminescent detection system (Pierce). The primary antibodies were: anti-GAPDH (Sigma), anti-β-Tubulin (Sigma), anti-CyclinD1 (Santa Cruz), anti-c-Myc (Santa Cruz), anti-β-Catenin (Sigma), anti-Dkk1 (Santa Cruz), anti-Gsk3β (Abcam), anti-Axin1 (Cell Signaling), anti-p-Smad2/3 (Cell Signaling), anti-p21(Santa Cruz), anti-Smad4 (Santa Cruz), anti-p-Smad1/5/8 (Cell Signaling), anti-Bmpr1a (Abcam), anti-p65 (Cell Signaling), anti-STAT3 (Cell Signaling), anti-p-p65 (Cell Signaling), anti-p-STAT3 (Cell Signaling).

Irradiation injury

For irradiation, 2-month-old adult mice were subjected to 12 Gy γ-IR and executed at appointed time.

Establishment of the AOM-DSS mouse model

Seven week-old control and miR-31−/− mice were intraperitoneally injected with AOM (Sigma-Aldrich,) at 10 mg/kg body weight. One week after AOM injection, mice were treated with the so-called DSS cycle, comprised of two steps in which mice were fed with 2.5% (w/v) DSS (molecular weight 36,000–50,000, MP Biomedicals) for 7 days followed by 14 days of normal water feeding. Mice were subjected to a total of three DSS cycles. After treatment, mice were sacrificed and distal colon tissues were collected and tumor number and volume were evaluated.

Luciferase assay for miR-31 promoter activity

The transcript of primary miR-31 is located at Chromosome 4, NC_000070.6 (88910557..88910662, complement) in the mouse genome. The upstream 2 kb region of transcript start site (TSS) was identified as the miR-31 promoter in this study, which is located at Chromosome 4, NC_000070.6 (88910663..88912663) and was cloned into the pGL3-Basic reporter constructs. The binding site of STAT3 is located at 88911572–88911582. The binding site 1 and 2 of p65 are located at 88912038–88912048 and 88912409–88912419, respectively.

Chromatin immunoprecipitation (ChIP) assay

ChIP assay was performed according to the manufacturer’s protocol with minor modifications, using Simple-ChIP enzymatic chromatin immunoprecipitation kit (Cell Signaling Technology). The sonicated nuclear fractions were divided for input control and for overnight incubated at 4°C with p-STAT3 or the positive control with H3, negative control with IgG. The recruited genomic DNA from the ChIP assays was quantified by qPCR with primers specific to p-Stat3 binding elements of the miR-31 promoter regions. Primers were as follows: p-STAT3-binding site forward: 5’-TCCAGGCAAGAAAGTGAGGG −3’; p-STAT3- binding site reverse: 5’- TGAGTAACAGTGCAACAGAGC-3’.

Apoptosis analysis

The 21nt oligonucleotide miR-31 inhibitor (5-AGCUAUGCCAGCAUCUUGCCU-3) or negative control Scramble RNA (5-CAGUACUUUUGUGUAGUACAA-3) were transfected into HCT116 cells with or without CHIR99021 (GSK3β inhibitor). The apoptotic cells were evaluated by FITC-Annexin V/PI staining (BD PharMingen) and analyzed by FACS (Becton, Dickinson).

RNA crosslinking, immunoprecipitation, and qRT-PCR (CLIP-PCR) assay

CLIP-PCR assay performed as previously described with modification (Wang et al., 2015). Cells were treated with scramble RNA or miR-31 inhibitor, and then harvested after being irradiated at 400 mJ/cm2 twice. They were then re-suspended in PXL buffer with RNAsin (Promega) and RQ1 DNAse (Promega), and spun at 15000 rpm for 30 min. Supernatant was collected. Protein A Dynabeads (Dynal, 100.02, Thermo Fisher) and goat anti-rabbit IgG (Jackson ImmunoResearch,) or Ago2 antibody were incubated for 4 hr at 4°C with rotation. The supernatant was added to the beads for 2–4 hr at 4°C. Beads were then washed twice and digested with Proteinase K (4 mg/ml) for 20 min at 37°C. RNA was then extracted using Trizol Reagent (Invitrogen) and quantified by qRT-PCR.

Statistical analysis

All analyses were performed in triplicate or greater and the means obtained were used for independent t-tests. Asterisks denote statistical significance (*p<0.05; **p<0.01; ***p<0.001). All data are reported as mean ±SD. Means and standard deviations from at least three independent experiments are presented in all graphs.

Acknowledgement

We are grateful to Bogi Andersen for editing the manuscript, and Yeguang Chen for providing the Apc floxed mice. ZY is supported by the National Natural Science Foundation of China (No. .81772984, 81572614, 31271584); Beijing Nature Foundation Grant (5162018); the Major Project for Cultivation Technology (2016ZX08008001, 2014ZX08008001); Basic Research Program (2015QC0104, 2015TC041, 2016SY001, 2016QC086); SKLB Open Grant (2015SKLB6-16). JS is supported by the National Natural Science Foundation of China (No. 31370830 and 11675134) and the 111 Project (No. B16029). MVP is supported by the NIH NIAMS grants R01-AR067273, R01-AR069653, and Pew Charitable Trust grant. TA is supported by the NIAMS/NIH grant R01 AR061474-01.

Funding Statement

The funders had no role in study design, data collection and interpretation, or the decision to submit the work for publication.

Contributor Information

Zhengquan Yu, Email: zyu@cau.edu.cn.

Roel Nusse, Stanford University, United States.

Funding Information

This paper was supported by the following grants:

  • National Institutes of Health R01 AR061474-01 to Thomas Andl.

  • National Institutes of Health R01-AR067273 to Maksim V Plikus.

  • National Institutes of Health R01-AR069653 to Maksim V Plikus.

  • National Natural Science Foundation of China 31370830 to Jinyue Sun, Jianwei Shuai.

  • National Natural Science Foundation of China 11675134 to Jinyue Sun, Jianwei Shuai.

  • National Natural Science Foundation of China 81572614 to Zhengquan Yu.

  • National Natural Science Foundation of China 31271584 to Zhengquan Yu.

  • National Natural Science Foundation of China 81772984 to Zhengquan Yu.

Additional information

Competing interests

No competing interests declared.

Author contributions

Data curation, Software, Formal analysis, Validation, Investigation, Methodology, Writing—original draft, Project administration.

Data curation, Formal analysis, Validation, Investigation, Methodology.

Data curation, Formal analysis, Validation, Investigation, Methodology.

Formal analysis, Methodology.

Formal analysis.

Formal analysis, Investigation, Methodology.

Formal analysis, Methodology.

Data curation.

Formal analysis, Writing—review and editing.

Investigation, Writing—review and editing.

Formal analysis, Writing—review and editing.

Investigation, Methodology, Writing—review and editing.

Formal analysis, Writing—review and editing.

Formal analysis, Writing—review and editing.

Conceptualization, Resources, Data curation, Formal analysis, Supervision, Funding acquisition, Validation, Investigation, Writing—original draft, Project administration, Writing—review and editing.

Ethics

Animal experimentation: All mouse experiment procedures and protocols were evaluated and authorized by the Regulations of Beijing Laboratory Animal Management and strictly followed the guidelines under the Institutional Animal Care and Use Committee of China Agricultural University (approval number: SKLAB-2011-04-03).

Additional files

Transparent reporting form
DOI: 10.7554/eLife.29538.042

References

  1. Aoki R, Shoshkes-Carmel M, Gao N, Shin S, May CL, Golson ML, Zahm AM, Ray M, Wiser CL, Wright CV, Kaestner KH. Foxl1-expressing mesenchymal cells constitute the intestinal stem cell niche. Cellular and Molecular Gastroenterology and Hepatology. 2016;2:175–188. doi: 10.1016/j.jcmgh.2015.12.004. [DOI] [PMC free article] [PubMed] [Google Scholar]
  2. Bandrés E, Cubedo E, Agirre X, Malumbres R, Zárate R, Ramirez N, Abajo A, Navarro A, Moreno I, Monzó M, García-Foncillas J. Identification by Real-time PCR of 13 mature microRNAs differentially expressed in colorectal cancer and non-tumoral tissues. Molecular Cancer. 2006;5:29. doi: 10.1186/1476-4598-5-29. [DOI] [PMC free article] [PubMed] [Google Scholar]
  3. Barker N, Ridgway RA, van Es JH, van de Wetering M, Begthel H, van den Born M, Danenberg E, Clarke AR, Sansom OJ, Clevers H. Crypt stem cells as the cells-of-origin of intestinal cancer. Nature. 2009;457:608–611. doi: 10.1038/nature07602. [DOI] [PubMed] [Google Scholar]
  4. Barker N, van Es JH, Kuipers J, Kujala P, van den Born M, Cozijnsen M, Haegebarth A, Korving J, Begthel H, Peters PJ, Clevers H. Identification of stem cells in small intestine and colon by marker gene Lgr5. Nature. 2007;449:1003–1007. doi: 10.1038/nature06196. [DOI] [PubMed] [Google Scholar]
  5. Barker N. Adult intestinal stem cells: critical drivers of epithelial homeostasis and regeneration. Nature Reviews Molecular Cell Biology. 2014;15:19–33. doi: 10.1038/nrm3721. [DOI] [PubMed] [Google Scholar]
  6. Bellam N, Pasche B. Tgf-beta signaling alterations and colon cancer. Cancer treatment and research. 2010;155:85–103. doi: 10.1007/978-1-4419-6033-7_5. [DOI] [PubMed] [Google Scholar]
  7. Chivukula RR, Shi G, Acharya A, Mills EW, Zeitels LR, Anandam JL, Abdelnaby AA, Balch GC, Mansour JC, Yopp AC, Maitra A, Mendell JT. An essential mesenchymal function for miR-143/145 in intestinal epithelial regeneration. Cell. 2014;157:1104–1116. doi: 10.1016/j.cell.2014.03.055. [DOI] [PMC free article] [PubMed] [Google Scholar]
  8. Clevers H, Loh KM, Nusse R. Stem cell signaling. An integral program for tissue renewal and regeneration: Wnt signaling and stem cell control. Science. 2014;346:1248012. doi: 10.1126/science.1248012. [DOI] [PubMed] [Google Scholar]
  9. Corvinus FM, Orth C, Moriggl R, Tsareva SA, Wagner S, Pfitzner EB, Baus D, Kaufmann R, Huber LA, Zatloukal K, Beug H, Ohlschläger P, Schütz A, Halbhuber KJ, Friedrich K. Persistent STAT3 activation in colon cancer is associated with enhanced cell proliferation and tumor growth. Neoplasia. 2005;7:545–555. doi: 10.1593/neo.04571. [DOI] [PMC free article] [PubMed] [Google Scholar]
  10. Cottonham CL, Kaneko S, Xu L. miR-21 and miR-31 converge on TIAM1 to regulate migration and invasion of colon carcinoma cells. Journal of Biological Chemistry. 2010;285:35293–35302. doi: 10.1074/jbc.M110.160069. [DOI] [PMC free article] [PubMed] [Google Scholar]
  11. Davies PS, Dismuke AD, Powell AE, Carroll KH, Wong MH. Wnt-reporter expression pattern in the mouse intestine during homeostasis. BMC Gastroenterology. 2008;8:57. doi: 10.1186/1471-230X-8-57. [DOI] [PMC free article] [PubMed] [Google Scholar]
  12. de Miranda NF, van Dinther M, van den Akker BE, van Wezel T, ten Dijke P, Morreau H. Transforming Growth Factor β Signaling in Colorectal Cancer Cells With Microsatellite Instability Despite Biallelic Mutations in TGFBR2. Gastroenterology. 2015;148:e1428. doi: 10.1053/j.gastro.2015.02.052. [DOI] [PubMed] [Google Scholar]
  13. De Robertis M, Massi E, Poeta ML, Carotti S, Morini S, Cecchetelli L, Signori E, Fazio VM. The AOM/DSS murine model for the study of colon carcinogenesis: From pathways to diagnosis and therapy studies. Journal of carcinogenesis. 2011;10:9. doi: 10.4103/1477-3163.78279. [DOI] [PMC free article] [PubMed] [Google Scholar]
  14. Durand A, Donahue B, Peignon G, Letourneur F, Cagnard N, Slomianny C, Perret C, Shroyer NF, Romagnolo B. Functional intestinal stem cells after Paneth cell ablation induced by the loss of transcription factor Math1 (Atoh1) PNAS. 2012;109:8965–8970. doi: 10.1073/pnas.1201652109. [DOI] [PMC free article] [PubMed] [Google Scholar]
  15. Emde A, Hornstein E. miRNAs at the interface of cellular stress and disease. The EMBO Journal. 2014;33:1428–1437. doi: 10.15252/embj.201488142. [DOI] [PMC free article] [PubMed] [Google Scholar]
  16. Furukawa K, Sato T, Katsuno T, Nakagawa T, Noguchi Y, Tokumasa A, Yokote K, Yokosuka O, Saito Y. Smad3 contributes to positioning of proliferating cells in colonic crypts by inducing EphB receptor protein expression. Biochemical and Biophysical Research Communications. 2011;405:521–526. doi: 10.1016/j.bbrc.2011.01.045. [DOI] [PubMed] [Google Scholar]
  17. Gangaraju VK, Lin H. MicroRNAs: key regulators of stem cells. Nature Reviews Molecular Cell Biology. 2009;10:116–125. doi: 10.1038/nrm2621. [DOI] [PMC free article] [PubMed] [Google Scholar]
  18. Gehart H, Clevers H. Repairing organs: lessons from intestine and liver. Trends in Genetics. 2015;31:344–351. doi: 10.1016/j.tig.2015.04.005. [DOI] [PubMed] [Google Scholar]
  19. Hardwick JC, Kodach LL, Offerhaus GJ, van den Brink GR. Bone morphogenetic protein signalling in colorectal cancer. Nature Reviews Cancer. 2008;8:806–812. doi: 10.1038/nrc2467. [DOI] [PubMed] [Google Scholar]
  20. He XC, Zhang J, Tong WG, Tawfik O, Ross J, Scoville DH, Tian Q, Zeng X, He X, Wiedemann LM, Mishina Y, Li L. BMP signaling inhibits intestinal stem cell self-renewal through suppression of Wnt-beta-catenin signaling. Nature Genetics. 2004;36:1117–1121. doi: 10.1038/ng1430. [DOI] [PubMed] [Google Scholar]
  21. Hua G, Thin TH, Feldman R, Haimovitz-Friedman A, Clevers H, Fuks Z, Kolesnick R. Crypt base columnar stem cells in small intestines of mice are radioresistant. Gastroenterology. 2012;143:1266–1276. doi: 10.1053/j.gastro.2012.07.106. [DOI] [PMC free article] [PubMed] [Google Scholar]
  22. Ibarra I, Erlich Y, Muthuswamy SK, Sachidanandam R, Hannon GJ. A role for microRNAs in maintenance of mouse mammary epithelial progenitor cells. Genes & Development. 2007;21:3238–3243. doi: 10.1101/gad.1616307. [DOI] [PMC free article] [PubMed] [Google Scholar]
  23. Ilyas M, Tomlinson IP, Rowan A, Pignatelli M, Bodmer WF. Beta-catenin mutations in cell lines established from human colorectal cancers. PNAS. 1997;94:10330–10334. doi: 10.1073/pnas.94.19.10330. [DOI] [PMC free article] [PubMed] [Google Scholar]
  24. Itzkovitz S, Lyubimova A, Blat IC, Maynard M, van Es J, Lees J, Jacks T, Clevers H, van Oudenaarden A. Single-molecule transcript counting of stem-cell markers in the mouse intestine. Nature Cell Biology. 2011;14:106–114. doi: 10.1038/ncb2384. [DOI] [PMC free article] [PubMed] [Google Scholar]
  25. Kabiri Z, Greicius G, Madan B, Biechele S, Zhong Z, Zaribafzadeh H, Edison, Aliyev J, Wu Y, Bunte R, Williams BO, Rossant J, Virshup DM. Stroma provides an intestinal stem cell niche in the absence of epithelial Wnts. Development. 2014;141:2206–2215. doi: 10.1242/dev.104976. [DOI] [PubMed] [Google Scholar]
  26. Kaler P, Augenlicht L, Klampfer L. Activating mutations in β-catenin in colon cancer cells alter their interaction with macrophages; the role of snail. PLoS One. 2012;7:e45462. doi: 10.1371/journal.pone.0045462. [DOI] [PMC free article] [PubMed] [Google Scholar]
  27. Kim TH, Escudero S, Shivdasani RA. Intact function of Lgr5 receptor-expressing intestinal stem cells in the absence of Paneth cells. PNAS. 2012;109:3932–3937. doi: 10.1073/pnas.1113890109. [DOI] [PMC free article] [PubMed] [Google Scholar]
  28. Kinzler KW, Nilbert MC, Su LK, Vogelstein B, Bryan TM, Levy DB, Smith KJ, Preisinger AC, Hedge P, McKechnie D. Identification of FAP locus genes from chromosome 5q21. Science. 1991;253:661–665. doi: 10.1126/science.1651562. [DOI] [PubMed] [Google Scholar]
  29. Kishimoto M, Fukui T, Suzuki R, Takahashi Y, Sumimoto K, Okazaki T, Sakao M, Sakaguchi Y, Yoshida K, Uchida K, Nishio A, Matsuzaki K, Okazaki K. Phosphorylation of Smad2/3 at specific linker threonine indicates slow-cycling intestinal stem-like cells before reentry to cell cycle. Digestive Diseases and Sciences. 2015;60:362–374. doi: 10.1007/s10620-014-3348-3. [DOI] [PubMed] [Google Scholar]
  30. Kosinski C, Li VS, Chan AS, Zhang J, Ho C, Tsui WY, Chan TL, Mifflin RC, Powell DW, Yuen ST, Leung SY, Chen X. Gene expression patterns of human colon tops and basal crypts and BMP antagonists as intestinal stem cell niche factors. PNAS. 2007;104:15418–15423. doi: 10.1073/pnas.0707210104. [DOI] [PMC free article] [PubMed] [Google Scholar]
  31. Kusaba T, Nakayama T, Yamazumi K, Yakata Y, Yoshizaki A, Nagayasu T, Sekine I. Expression of p-STAT3 in human colorectal adenocarcinoma and adenoma; correlation with clinicopathological factors. Journal of Clinical Pathology. 2005;58:833–838. doi: 10.1136/jcp.2004.023416. [DOI] [PMC free article] [PubMed] [Google Scholar]
  32. Leblond CP, Walker BE. Renewal of cell populations. Physiological reviews. 1956;36:255–276. doi: 10.1152/physrev.1956.36.2.255. [DOI] [PubMed] [Google Scholar]
  33. Leung AK, Sharp PA. MicroRNA functions in stress responses. Molecular Cell. 2010;40:205–215. doi: 10.1016/j.molcel.2010.09.027. [DOI] [PMC free article] [PubMed] [Google Scholar]
  34. Li L, Clevers H. Coexistence of quiescent and active adult stem cells in mammals. Science. 2010;327:542–545. doi: 10.1126/science.1180794. [DOI] [PMC free article] [PubMed] [Google Scholar]
  35. Li N, Nakauka-Ddamba A, Tobias J, Jensen ST, Lengner CJ. Mouse Label-Retaining Cells Are Molecularly and Functionally Distinct From Reserve Intestinal Stem Cells. Gastroenterology. 2016;151:298–310. doi: 10.1053/j.gastro.2016.04.049. [DOI] [PMC free article] [PubMed] [Google Scholar]
  36. Li N, Yousefi M, Nakauka-Ddamba A, Jain R, Tobias J, Epstein JA, Jensen ST, Lengner CJ. Single-cell analysis of proxy reporter allele-marked epithelial cells establishes intestinal stem cell hierarchy. Stem Cell Reports. 2014;3:876–891. doi: 10.1016/j.stemcr.2014.09.011. [DOI] [PMC free article] [PubMed] [Google Scholar]
  37. Lin Q, Lai R, Chirieac LR, Li C, Thomazy VA, Grammatikakis I, Rassidakis GZ, Zhang W, Fujio Y, Kunisada K, Hamilton SR, Amin HM. Constitutive activation of JAK3/STAT3 in colon carcinoma tumors and cell lines: inhibition of JAK3/STAT3 signaling induces apoptosis and cell cycle arrest of colon carcinoma cells. The American journal of pathology. 2005;167:969–980. doi: 10.1016/S0002-9440(10)61187-X. [DOI] [PMC free article] [PubMed] [Google Scholar]
  38. McKenna LB, Schug J, Vourekas A, McKenna JB, Bramswig NC, Friedman JR, Kaestner KH. MicroRNAs control intestinal epithelial differentiation, architecture, and barrier function. Gastroenterology. 2010;139:1654–1664. doi: 10.1053/j.gastro.2010.07.040. [DOI] [PMC free article] [PubMed] [Google Scholar]
  39. Mendell JT, Olson EN. MicroRNAs in stress signaling and human disease. Cell. 2012;148:1172–1187. doi: 10.1016/j.cell.2012.02.005. [DOI] [PMC free article] [PubMed] [Google Scholar]
  40. Miyoshi H. Wnt-expressing cells in the intestines: guides for tissue remodeling. Journal of Biochemistry. 2017;161:19–25. doi: 10.1093/jb/mvw070. [DOI] [PubMed] [Google Scholar]
  41. Montgomery RK, Carlone DL, Richmond CA, Farilla L, Kranendonk ME, Henderson DE, Baffour-Awuah NY, Ambruzs DM, Fogli LK, Algra S, Breault DT. Mouse telomerase reverse transcriptase (mTert) expression marks slowly cycling intestinal stem cells. PNAS. 2011;108:179–184. doi: 10.1073/pnas.1013004108. [DOI] [PMC free article] [PubMed] [Google Scholar]
  42. Muñoz J, Stange DE, Schepers AG, van de Wetering M, Koo BK, Itzkovitz S, Volckmann R, Kung KS, Koster J, Radulescu S, Myant K, Versteeg R, Sansom OJ, van Es JH, Barker N, van Oudenaarden A, Mohammed S, Heck AJ, Clevers H. The Lgr5 intestinal stem cell signature: robust expression of proposed quiescent '+4' cell markers. The EMBO Journal. 2012;31:3079–3091. doi: 10.1038/emboj.2012.166. [DOI] [PMC free article] [PubMed] [Google Scholar]
  43. Nagase H, Miyoshi Y, Horii A, Aoki T, Petersen GM, Vogelstein B, Maher E, Ogawa M, Maruyama M, Utsunomiya J. Screening for germ-line mutations in familial adenomatous polyposis patients: 61 new patients and a summary of 150 unrelated patients. Human Mutation. 1992;1:467–473. doi: 10.1002/humu.1380010603. [DOI] [PubMed] [Google Scholar]
  44. Novellasdemunt L, Antas P, Li VS. Targeting Wnt signaling in colorectal cancer. A Review in the Theme: Cell Signaling: Proteins, Pathways and Mechanisms. American Journal of Physiology - Cell Physiology. 2015;309:C511–C521. doi: 10.1152/ajpcell.00117.2015. [DOI] [PMC free article] [PubMed] [Google Scholar]
  45. Olaru AV, Selaru FM, Mori Y, Vazquez C, David S, Paun B, Cheng Y, Jin Z, Yang J, Agarwal R, Abraham JM, Dassopoulos T, Harris M, Bayless TM, Kwon J, Harpaz N, Livak F, Meltzer SJ. Dynamic changes in the expression of MicroRNA-31 during inflammatory bowel disease-associated neoplastic transformation. Inflammatory Bowel Diseases. 2011;17:221–231. doi: 10.1002/ibd.21359. [DOI] [PMC free article] [PubMed] [Google Scholar]
  46. Reynolds A, Wharton N, Parris A, Mitchell E, Sobolewski A, Kam C, Bigwood L, El Hadi A, Münsterberg A, Lewis M, Speakman C, Stebbings W, Wharton R, Sargen K, Tighe R, Jamieson C, Hernon J, Kapur S, Oue N, Yasui W, Williams MR. Canonical Wnt signals combined with suppressed TGFβ/BMP pathways promote renewal of the native human colonic epithelium. Gut. 2014;63:610–621. doi: 10.1136/gutjnl-2012-304067. [DOI] [PMC free article] [PubMed] [Google Scholar]
  47. Ritsma L, Ellenbroek SIJ, Zomer A, Snippert HJ, de Sauvage FJ, Simons BD, Clevers H, van Rheenen J. Intestinal crypt homeostasis revealed at single-stem-cell level by in vivo live imaging. Nature. 2014;507:362–365. doi: 10.1038/nature12972. [DOI] [PMC free article] [PubMed] [Google Scholar]
  48. Runtsch MC, Round JL, O'Connell RM. MicroRNAs and the regulation of intestinal homeostasis. Frontiers in Genetics. 2014;5:347. doi: 10.3389/fgene.2014.00347. [DOI] [PMC free article] [PubMed] [Google Scholar]
  49. San Roman AK, Jayewickreme CD, Murtaugh LC, Shivdasani RA. Wnt secretion from epithelial cells and subepithelial myofibroblasts is not required in the mouse intestinal stem cell niche in vivo. Stem Cell Reports. 2014;2:127–134. doi: 10.1016/j.stemcr.2013.12.012. [DOI] [PMC free article] [PubMed] [Google Scholar]
  50. Sangiorgi E, Capecchi MR. Bmi1 is expressed in vivo in intestinal stem cells. Nature Genetics. 2008;40:915–920. doi: 10.1038/ng.165. [DOI] [PMC free article] [PubMed] [Google Scholar]
  51. Sato T, van Es JH, Snippert HJ, Stange DE, Vries RG, van den Born M, Barker N, Shroyer NF, van de Wetering M, Clevers H. Paneth cells constitute the niche for Lgr5 stem cells in intestinal crypts. Nature. 2011;469:415–418. doi: 10.1038/nature09637. [DOI] [PMC free article] [PubMed] [Google Scholar]
  52. Sato T, Vries RG, Snippert HJ, van de Wetering M, Barker N, Stange DE, van Es JH, Abo A, Kujala P, Peters PJ, Clevers H. Single Lgr5 stem cells build crypt-villus structures in vitro without a mesenchymal niche. Nature. 2009;459:262–265. doi: 10.1038/nature07935. [DOI] [PubMed] [Google Scholar]
  53. Sun K, Lai EC. Adult-specific functions of animal microRNAs. Nature Reviews Genetics. 2013;14:535–548. doi: 10.1038/nrg3471. [DOI] [PMC free article] [PubMed] [Google Scholar]
  54. Takeda N, Jain R, LeBoeuf MR, Wang Q, Lu MM, Epstein JA. Interconversion between intestinal stem cell populations in distinct niches. Science. 2011;334:1420–1424. doi: 10.1126/science.1213214. [DOI] [PMC free article] [PubMed] [Google Scholar]
  55. Tian H, Biehs B, Warming S, Leong KG, Rangell L, Klein OD, de Sauvage FJ. A reserve stem cell population in small intestine renders Lgr5-positive cells dispensable. Nature. 2011;478:255–259. doi: 10.1038/nature10408. [DOI] [PMC free article] [PubMed] [Google Scholar]
  56. Tsareva SA, Moriggl R, Corvinus FM, Wiederanders B, Schütz A, Kovacic B, Friedrich K. Signal transducer and activator of transcription 3 activation promotes invasive growth of colon carcinomas through matrix metalloproteinase induction. Neoplasia. 2007;9:279–291. doi: 10.1593/neo.06820. [DOI] [PMC free article] [PubMed] [Google Scholar]
  57. Wang CJ, Zhou ZG, Wang L, Yang L, Zhou B, Gu J, Chen HY, Sun XF. Clinicopathological significance of microRNA-31, -143 and -145 expression in colorectal cancer. Disease Markers. 2009;26:27–34. doi: 10.1155/2009/921907. [DOI] [PMC free article] [PubMed] [Google Scholar]
  58. Wang S, Li N, Yousefi M, Nakauka-Ddamba A, Li F, Parada K, Rao S, Minuesa G, Katz Y, Gregory BD, Kharas MG, Yu Z, Lengner CJ. Transformation of the intestinal epithelium by the MSI2 RNA-binding protein. Nature Communications. 2015;6:6517. doi: 10.1038/ncomms7517. [DOI] [PMC free article] [PubMed] [Google Scholar]
  59. Yan KS, Chia LA, Li X, Ootani A, Su J, Lee JY, Su N, Luo Y, Heilshorn SC, Amieva MR, Sangiorgi E, Capecchi MR, Kuo CJ. The intestinal stem cell markers Bmi1 and Lgr5 identify two functionally distinct populations. PNAS. 2012;109:466–471. doi: 10.1073/pnas.1118857109. [DOI] [PMC free article] [PubMed] [Google Scholar]
  60. Yang MH, Yu J, Chen N, Wang XY, Liu XY, Wang S, Ding YQ. Elevated microRNA-31 expression regulates colorectal cancer progression by repressing its target gene SATB2. PLoS One. 2013;8:e85353. doi: 10.1371/journal.pone.0085353. [DOI] [PMC free article] [PubMed] [Google Scholar]
  61. Yi R, Fuchs E. MicroRNAs and their roles in mammalian stem cells. Journal of Cell Science. 2011;124:1775–1783. doi: 10.1242/jcs.069104. [DOI] [PMC free article] [PubMed] [Google Scholar]
  62. Yousefi M, Li N, Nakauka-Ddamba A, Wang S, Davidow K, Schoenberger J, Yu Z, Jensen ST, Kharas MG, Lengner CJ. Msi RNA-binding proteins control reserve intestinal stem cell quiescence. The Journal of Cell Biology. 2016;215:401–413. doi: 10.1083/jcb.201604119. [DOI] [PMC free article] [PubMed] [Google Scholar]

Decision letter

Editor: Roel Nusse1

In the interests of transparency, eLife includes the editorial decision letter and accompanying author responses. A lightly edited version of the letter sent to the authors after peer review is shown, indicating the most substantive concerns; minor comments are not usually included.

[Editors’ note: a previous version of this study was rejected after peer review, but the authors submitted for reconsideration. The first decision letter after peer review is shown below.]

Thank you for submitting your work entitled "Stress Responsive miR-31 is the Master-modulator of Intestinal Stem Cells during Regeneration and Tumorigenesis" for consideration by eLife. Your article has been evaluated by Fiona Watt (Senior Editor) and three reviewers, one of whom is a member of our Board of Reviewing Editors. The reviewers have opted to remain anonymous.

Our decision has been reached after consultation between the reviewers. Based on these discussions and the individual reviews below, we regret to inform you that your work will not be considered further for publication in eLife.

As you will see, the reviewers find your work of interest but they raise substantial concerns as well. At this moment, these concerns preclude us from accepting the manuscript. If you think however that you can address the comments from the reviewers in a satisfactory and timely manner, we will consider a revised version for another round of reviews.

Specifically, we urge to use functional readouts rather than relying on changes in marker expression in analyzing the consequences of miR-31 genetic manipulation on intestinal stem cells. This could possibly be done by in vivo lineage tracing assays and/or by quantified organoid assays. We also urge you to be specific on which part of the intestinal track you are examining: the small intestine, colon or both. As an additional point, you need to be more accurate in detailing the endogenous expression of the miR-31 together with the short-term and long-term effects of modifying miR-31 expression on the epithelium using lineage markers, IHC/in-situ hybridization.

In the individual reviews, you will find other detailed comments that when addressed should improve your manuscript significantly.

Reviewer #1:

The authors make the interesting observation that one microRNA, miR-31 controls the fate of intestinal stem cells. miR-31 does so during homeostasis, regeneration and in cancer. It targets both Wnt and BMP signaling, activating Wnt and repressing BMP. The function of miR-31 is assessed by loss- and gain-of-function experiments in mutant mice.

Figure 1A – the authors heavily focus on the localization of miR-31 expression in Lgr5+ cells, however they do not show whether this transcript is also expressed in other cell populations in the intestine under normal conditions. For example, is miR-31 expressed in the +4 stem cell population under normal conditions? A higher magnification of the in situ in Figure 1——figure supplement 1A may help clarify this issue.

Figure 1F-L – the authors show a decrease in intestine Lgr5+ cells in miR-31 deletion mouse model and an increase in the miR-31 overexpression model. However, they do not fully describe the consequences of these changes in stem cell numbers under normal circumstances. Is intestine tissue homeostasis affected? Are there changes in other intestine cell populations (enterocytes, goblet cells, paneth cells, entero-endocrine cells)? The phenotypes of these models under are important to characterize before making conclusions about injury or tumorigenesis. Also, what happens to mice overexpressing miR-31 for an extended amount time (beyond 2 weeks)? This question is also relevant to Figure 7.

Figure 4J – to demonstrate that miR-31 induction is sufficient to maintain organoid growth in the absence of R-spondin, the authors should also perform a cell propagation assay over a period of a few passages.

Figure 7 – the authors claim that miR-31 plays an oncogenic role in intestinal cancer, however they do not show what happens to the intestine when miR-31, itself, is overexpressed for an extended period of time? Is amplification of miR-31, itself, oncogenic or just leads to hyperproliferation? This is especially interesting to know if one where to do miR-31 agonism experiments to induce regeneration during damage or restore barrier function.

Reviewer #2:

This manuscript by Tian et al. describes an analysis of the role of miR-31 in physiological and stress-induced intestinal epithelial proliferation, uncovering a novel role for this miRNA as a cell-autonomous positive regulator of epithelial proliferation in this tissue. These effects correlate with induction of Wnt signaling and repression of TGFb/BMP signaling by miR-31. A few targets of miR-31 that may explain these effects (negative regulators of Wnt signaling and components of the TGF/BMP pathways) were validated. miR-31 is also shown to be a direct target transcript of STAT and NF-κB transcription factors, which can explain its upregulation in multiple models of intestinal injury. The strength of this study is the analysis of robust gain- and loss-of-function mouse models which convincing support the proposed role for miR-31 in intestine. Despite the somewhat superficial mechanistic analyses (simply showing regulation of a few targets in the Wnt/TGFb/BMP pathways), the overall findings are significant and, in principle, appropriate for publication in eLife. However, many aspects of the study are sloppy or poorly described, so major revisions and additional experiments are needed prior to publication, as described in detail below.

1) The phrase "…miR-31 is the master modulator of intestinal stem cells…" in the title is hyperbolic and should be toned down (perhaps, "a major modulator" would be more appropriate).

2) Figure 1—figure supplement 1A: In situ hybridizations require negative controls (ideally miR-31-/- sections).

3) A better characterization of the miR-31 transgenic and knockout alleles is needed. For example, in what tissues is the miR-31 transgene expressed upon Dox administration? Are there any overt phenotypes associated with acute miR-31 induction or germline miR-31 deletion? Are miR-31 knockout alleles transmitted at the expected Mendelian ratios? Expression in what tissues is shown in Figure 1—figure supplement 1D, G?

4) The BrdU pulse experiments in Figure 1D-E should be followed out for 24, 48, and 72 hours which may reveal clearer differences between the genotypes. The images showing BrdU staining in miR-31+/- vs. miR-31-/- crypts (Figure 1D) do not look overtly different.

5) The finding of reduced Hopx-derived crypts after injury (Figure 2E) can be fully explained by the finding of increased apoptosis in +4 cells after irradiation (Figure 2C). This should be acknowledged in the text.

6) Figure 1—figure supplement 2D: Simple growth curves (i.e. cell counts over time) would be preferable to these Ki67 stains of cultured cells. Since these cells are uniformly proliferating, albeit possibly at different rates, they all should be Ki67 positive. In addition, a description of this cell line is needed in the Materials and methods (how was Dox-inducible miR-31 established in these cells?). Also, what is the "control" condition used in this experiment (and Figure 4H-I)? It is unlikely that the same control would be appropriate for anti-miR-31 and Dox. The former needs a scrambled anti-miR and the latter needs untreated cells.

7) In multiple experiments, "scrambled RNA" is used as a negative control for anti-miR-31 (e.g. Figure 5F, 7A, etc.). The source of the anti-miR-31 is not described (please add), but it is unlikely that a scrambled RNA molecule would be the appropriate control. Anti-miRs are usually modified oligonucleotides and a scrambled oligo of the same composition should be used as a negative control.

8) Figure 1—figure supplement 2F: Showing an image of a single crypt is not sufficient to make the point that the stem cell compartment is expanded in TRE-miR-31 colon. Quantification of numerous crypts in multiple mice is needed to make this point.

9) The histologic analysis shown in Figure 1—figure supplement 2A-C (crypt height, Ki67) should be shown in Vil-Cre; miR-31fl/flmice as well.

10) Insufficient Vil-Cre; miR-31fl/flmice are examined after irradiation or DSS (n=2 or n=3, respectively). Given the inherent variability of the effects of these treatments, analysis of more mice is needed. Weight loss and clinical scores should be examined in these mice after DSS so the phenotype can be more completely compared to the germline KO mice.

11) The ISH experiments in Figure 7—figure supplement 1 are inadequate to make the point that miR-31 is upregulated in colon cancer (many samples would be needed with quantification). If this is previously established in the literature, I would recommend removing these data (or greatly expanding these analyses so the results are meaningful).

12) Figure 7H: Quantification of tumor burden in these experiments needed. n=3 is a very small number for these types of experiments. The image quality is very poor in these figure panels.

13) Figure 8A, M: How was the miR-31 promoter defined (genomic coordinates, including coordinates of STAT, NF-κB binding sites)? What specifically was cloned to make the promoter reporter constructs? These plasmids are not described in the Materials and methods.

Reviewer #3:

Using a variety of KO/over-expression mouse models and in vitro culture systems, the authors investigate the role of miR-31 in regulating stem cell-driven homeostasis, regeneration and cancer in the intestine. Evidence is presented for miR-31 modulating Wnt, BMP and TGF-β signaling pathway activity to levels compatible with efficient homeostasis, regeneration and disease in vivo. These findings are proposed to identify miR-31 as a valuable new therapeutic target for intestinal disease.

Overall, there are some interesting findings presented that clearly define an important role for miR-31 in the intestine. However, the major claim that miR-31 exerts its effects via specifically regulating stem cell activity in vivo is poorly substantiated.

1) The experiment data are mainly relate to the intestine but there is sporadic inclusion of data from the colon. Analyses should either be extended to include both organs or the focus restricted to only one of them to make it easier for the reader to follow.

2) In-situ hybridization panels for miR-31 throughout the manuscript are difficult to interpret and need replacing with much higher resolution images to accurately document the location and relative levels of endogenous miR-31 expression in the small intestine and colon. Is expression confined to the crypt base (stem cells + Paneth cells) or present throughout the TA compartment Perhaps RNAscope would help here? Intestinal tissue from the miR-31 null mice should be included as a negative control.

3) The up-regulation of miR-31 seems to occur at relatively late phase (4-5 days after damage-induced stress). Is there any reason that it does not express in acute phase despite it apparently being such a critical modulator of epithelial regeneration? Wouldn't you expect rapid induction of expression to effect epithelial repair and establish barrier function?

4) Figure 1B – where does miR-31 expression accumulate in the intestinal epithelium following irradiation? Is it uniform across the epithelium in regenerating areas or is it restricted to certain lineages? Again, high quality in-situ hybridization analysis is needed here.

5) Figure 1—figure supplement 1 – why was analysis of the miR-31 overexpression phenotype only conducted after 2 weeks? A detailed time-course with early time-points is needed to determine when the phenotype first presents and in which cell-type (using lineage markers) – is it selectively driven from the stem cell compartment? Any apoptosis apparent following gain/loss of miR-31 expression? Any effect on the Paneth cells (important regulators of stem cell activity)?

6) What happens to the villi in the mice with hyperproliferative crypts? One would assume they increase in length if no additional apoptosis is present at the villus tips. Are the phenotypes observed following modulation of miR-31 expression consistent throughout the small intestine? Does the length of the intestine/colon change in the various miR-31 mouse strains?

7) Why was HCT116 chosen for the in vitro gain/loss of function experiments? Is the phenotype also consistent for other colon cancer cells harboring different mutation spectra (for example APC mutations in place of the β-catenin mutation)?

8) Figure 1D, E – the increased movement of crypt cells in the miR-31 gain/loss experiments is not at all evident to me from the BrdU pulse-chase experiment figure panels. Entire crypt/villus units should be included here to document the more rapid emergence of BrdU-labelled cells onto the villi from the crypts. Do the villi get longer as a result of the enhanced cell migration or is there more apoptosis at the villus tips?

9) Figure 1F, G – the observed increase in Lgr5-driven GFP expression following overexpression of miR-31 does not necessarily indicate increased stem cell numbers/activity as claimed. If miR-31 is indeed a potent Wnt enhancer, then overexpression may simply be activating Lgr5 expression (as a Wnt target gene) on non-stem cells. To properly document an increase in Lgr5+ stem cell activity, in vivo lineage tracing must be performed. One would then expect an increase in the number of long-term tracing units observed or an increase in the organoid forming frequency of isolated crypts or sorted GFPhi cells.

The increased organoid budding depicted in Figure 1I is not very convincing – there appears to be a very modest increase in relation to the observed several fold-increase in putative Lgr5+ stem cells in vivo. A better way to functionally evaluate the proposed increase in Lgr5+ Stem cells would have been to sort for EGFPhi cells and to determine their organoid forming capacity in comparison to GFPhi cells isolated from crypts with endogenous miR-31 expression levels.

Is the increase in apoptosis observed in the organoids following loss of miR-31 expression evident in vivo?

10) What is the miR-31 loss/gain phenotype in the colon? Any changes to the frequency of Lgr5+ cells with tracing/organoid forming capacity?

11) Figure 2 – does overexpression of miR-31 increase the regeneration rate of the small intestine and colon following sub-lethal doses of γ-irradiation? Lgr5+ stem cells have actually been found to be quite radioresistant (Hua et al., Gastroenterology 2012) and Lgr5+ stem cells are indispensable for crypt regeneration following irradiation (Metcalfe et al., Cell Stem cell 2014) – these observations argue that Lgr5+ stem cells are driving crypt regeneration rather than reserve stem cell populations. Considering this, does Lgr5 expression change in response to miR-31 gain/loss of expression following irradiation?

Bmi1 has been shown to be expressed throughout the entire crypt (including stem cells) and Hopx expression is enriched in the Lgr5+ stem cell compartment (Munoz et al., EMBOJ 2012). This should at least be discussed/noted in the manuscript rather than referring to these markers as being irrefutable +4/reserve stem cell markers.

12) Figure 2E – it is very difficult to conclude anything from this Hopx-tracing experiment. What are the figure panels meant to be showing? All I can surmise from this is that Hopx-derived tracing from the crypt base is absent in miR-31 null mice, which is to be expected from the increase in apoptosis observed at the crypt base (harboring the Hopx+ cells) following irradiation. I don't see how you can conclude that miR-31 is required for reserve stem cell activity. I think it far more likely that miR-31 expression is a general proliferation driver proliferation within the crypt, including TA cells which can re-acquire stem cell functions to drive regeneration (see recent papers on plasticity observed within secretory/absorptive progenitors following damage).

Do Hopx expression levels change in response to modulation of miR-31 expression levels? Accordingly, does Hopx-driven lineage tracing change?

13) Figure 3 – is colonic regeneration following DSS withdrawal accelerated in miR-31 overexpressing mice?

14) Figure 1—figure supplement 2 – phenotype needs far better characterization, incorporating a proper time-course. What happens within the epithelium following miR-31 deletion? Is the phenotype more general TA cell driven or does it originate from within the stem cell compartment? Apoptosis evident as observed with the miR31 null mice?

15) Figure 4Axin2 expression isn't completely abrogated following loss of miR-31, so it is not correct to claim that Wnt signaling is absent. Since Axin2 expression encompasses both the stem cell and TA cell compartments in the crypt, the dramatic down-regulation throughout the crypt supports a more general effect on the entire proliferative crypt compartment rather than selectively on the stem cells.

I would like to see IHC for β-catenin performed on the intestines of the different miR-31 mice lines (including an early time-point for the miR-312 overexpression line) to document the effects on Wnt signaling status (including nuclear β-catenin) on the different crypt/villus compartments.

Figure 4C/D – Although the effects on Wnt signaling are well documented, I would like to have seen a more unbiased approach towards deciphering the direct result of modulating miR-31 expression in the intestine – comparative microarray expression profiling of WT vs. mir-31 null vs. mir31-overexpressing crypts would likely have shed additional light onto the pathways being directly regulated by miR-31. Such analyses at early time-points would also have indicated which cell types are initially being affected. Better validation in the form of IHC/In-situ analysis of expression changes to Wnt pathway targets (and targets of the BMP/TGF-β pathways) would also have helped to clarify which cells are responding to the changes in miR-31 expression within the crypts/villi. Are the target genes first changing within the stem cell compartment or is it a more general response? Are similar changes found in both the small intestine and colon?

Figure 4J – please accurately quantify the organoid data.

16) Figure 6 – again, a time-course would be helpful here to determine which genes are likely responding directly to miR-31 expression changes. Since there are obviously working antibodies available for some of the target genes, it would also be nice to see IHC validation of changes occurring in the epithelium in the absence of irradiation. This would document where the changes are taking place within the intestinal epithelium. Are the findings also applicable to the colon?

17) Figure 7 – the tumor-suppressive effect of miR-31 loss is clear, although not surprising given the proliferative block imposed on the cells. Does increased miR-31 expression enhance tumor formation in this model? Given the increased expression of miR-31 expression in human colon tumors, it would be interesting to see the effect of deleting miR-31 in established mouse intestinal tumors – this would be more indicative of the therapeutic potential of blocking miR-31 expression.

Figure 1A – again, why was HCT116 chosen for this experiment. Is the effect of miR-31 expression modulation restricted to β-catenin mutants or also present in other mutant backgrounds (such as APC null)?

Figure 7H – the swiss role histology pictures appear to show a complete lack of tumors in the miR-31 null mice, yet there are clearly tumors present on the whole-mount image of the intestine. A more representative picture should be used.

Why do some tumors still arise in an APC mutant background in miR31 null mice? What is their Wnt status?

18) Is miR-31 also up-regulated during epithelial regeneration in human intestine (organoids?)? I would like to know its expression status in inflammatory disease patients according to their therapeutic status. Is miR-31 down-regulated when inflammation is well suppressed?

[Editors’ note: what now follows is the decision letter after the authors submitted for further consideration.]

Congratulations, we are pleased to inform you that your article, "Stress Responsive miR-31 is a Major Modulator of Mouse Intestinal Stem Cells during Regeneration and Tumorigenesis", has been accepted for publication in eLife.

The authors report on the function of a microRNA, miR-31 as controlling the fate of intestinal stem cells. miR-31 can function as such during homeostasis, regeneration and in cancer. They find that miR-31 targets both the Wnt and BMP signaling pathways, activating Wnt and repressing BMP. The function of miR-31 is assessed by loss- and gain-of- function experiments in mutant mice.

If you have selected our "Publish on Acceptance" option, your PDF will be published within a few days; if you have opted out of the "Publish on Acceptance" option, your work will be published in about four weeks' time. Please take note of the points below and we hope you will continue to support eLife going forwards.

After an initial round of reviewing, the authors have come back with a revised version that is satisfactory to two of the first three reviewers. The other original reviewer was unable to review the revision but the editor feels that the paper passes the criteria to be accepted.

Reviewer #1:

The authors have done a good job in replying to the concerns I raised during the first round of reviewing. I recommend accepting the paper in its current form.

Reviewer #2:

The authors have substantially revised the manuscript in response to the extensive reviewer critique. The vast majority of my concerns have been adequately addressed, although I am somewhat disappointed that they failed to directly assay the proposed increase in Lgr5+ stem cells with the best functional assay available – namely the organoid formation assay. I do not understand why they were unable to determine the organoid forming efficacy of sorted Lgr5-GFP+ cells in their mouse model – this is a well-established model, which would have directly proven an increase in true Lgr5+ stem cells rather than simply an increase in Lgr5-driven GFP expression in non-stem cells.

eLife. 2017 Sep 5;6:e29538. doi: 10.7554/eLife.29538.044

Author response


[Editors’ note: the author responses to the first round of peer review follow.]

As you will see, the reviewers find your work of interest but they raise substantial concerns as well. At this moment, these concerns preclude us from accepting the manuscript. If you think however that you can address the comments from the reviewers in a satisfactory and timely manner, we will consider a revised version for another round of reviews.

Specifically, we urge to use functional readouts rather than relying on changes in marker expression in analyzing the consequences of miR-31 genetic manipulation on intestinal stem cells. This could possibly be done by in vivo lineage tracing assays and/or by quantified organoid assays.

As the editors suggested, we first performed new organoid culture assays with control and TRE-miR31 (miR-31 overexpressing) crypts. Both control and TRE-miR31 mice were pretreated with Dox for two weeks. Compared to the controls, TRE-miR31 crypts gave rise to more budding organoids (Figure 2E), suggesting an increase of intestinal stem cells (ISCs) in TRE-miR31 crypts. In our original manuscript, we showed that deleting miR-31 within the intestinal epithelium results in a higher frequency of apoptotic organoids and compromised budding (Figure 2K). Together, our findings strongly support the notion that miR31 functionally promotes expansion of the ISCs.

Furthermore, we took advantage of Lgr5-eGFP-CreERT;R26-LSL-LacZ mice to perform lineage-tracing assay following 2, 4 and 7 days of miR-31 induction. It revealed that miR-31 overexpression increases the height of LacZ+ units at different time points, suggesting it promotes generation of new lineages from Lgr5+ ISCs (Figure 2F, G and Figure 2—figure supplement 1C), From this we conclude that miR-31 increases Lgr5+ stem cell numbers. We also noticed that the number of individual LacZ+ units derived from Lgr5+ stem cells is not significantly altered in miR-31 overexpressing intestine, as compared to controls (Figure 2G). We believe that this observation can be explained by the mosaic and inefficient activation of Cre in the inducible Lgr5-eGFP-CreERT;R26-LSLLacZ mouse model and that miR-31 overexpression does not alter its efficiency.

We also urge you to be specific on which part of the intestinal track you are examining: the small intestine, colon or both.

This is a great suggestion. For this revision, we decided to focus the manuscript on the role of miR-31 in small intestine during homeostasis, epithelial regeneration and tumorigenesis. Due to many differences between small intestine and colon, the DSS-treated colon data, while important, likely requires further in-depth investigation. Thus, in order to keep the manuscript focused on the core set of findings in the small intestine, for this revision we opted to remove the colon data.

As an additional point, you need to be more accurate in detailing the endogenous expression of the miR-31.

To address this criticism, we performed cell sorting to isolate Lgr5-GFPhigh, Lgr5-GFPlow, Lgr5-GFPneg cell subpopulations using Lgr5-eGFP-CreERT mice, and also isolate Hopx+ and Hopx- cells, which is based on Hopx-CreERT;mTmG mice 15 hours after Tamoxifen injection. We quantified miR-31 expression levels in isolated cells using qRT-PCR and found that miR-31 expression levels are the highest in the Lgr5-GFPhigh cell population with high progenitor potential, intermediate in Lgr5-GFPlow transient amplifying progenitor cells and the lowest in Lgr5-GFPneg populations (Figure 1A). Furthermore, higher levels of miR-31 were also found in Hopx+ reserve stem cells as compared to Hopx- epithelial cells (Figure 1A). Furthermore, we performed miR-31 in situhybridization. It shows that miR-31 expression levels are generally higher in the crypts than in the villi (Figure 1B). Together with the qRT-PCR results, these findings suggest that miR-31 is broadly expressed in epithelial cells of the intestinal crypt and peaks inLgr5high ISCs.

Together with the short-term and long-term effects of modifying miR-31 expression on the epithelium using lineage markers, IHC/in-situ hybridization.

To address this criticism, we examined the effect of miR-31 overexpression on different types of differentiated cells following 2-weeks (short-term) and 1-year (long-term) of Dox induction, respectively. Dox treatment of TRE-miR31 mice for 2 weeks resulted in (i) proliferative expansion of intestinal crypts (Figure 1F, G and Figure 1—figure supplement 3A, B), (ii) reduction of differentiated cells such as enteroendocrine, goblet and paneth cells (Figure 1—figure supplement 4), and (iii) increase in apoptotic cells at the tip of the TRE-miR31 villi (Figure 1H). Surprisingly, sustained miR-31 overexpression for 1 year resulted in very similar phenotypes as the 2-week induction (Figure 1—figure supplement 2C, E and Figure 1—figure supplement 3 and Figure 1—figure supplement 4). Thus, we conclude that the long-term effects of miR-31 overexpression are quite similar to its short-term effects.

Next, we examined the effect of miR-31 deletion on intestinal development at two weeks, two and eight months of ages. At these different time points, miR31 deletion also produces consistent intestinal phenotypes that can be summarized as follows:

i) Deletion of miR-31 significantly reduces crypt height and causes fewer proliferative cells in the crypts (Figure 1I and Figure 1—figure supplement 5C, D).

ii) Deletion of miR-31 induces apoptosis throughout thecrypt-villus axis (Figure 1—figure supplement 5C, D). At the same time, apoptotic cells were predominantly present at the tips of control villi and very rare apoptotic cells appear in the control crypt-villus axis (Figure 1—figure supplement 5C, D).

iii) Deletion of miR-31 increases the number of enteroendocrine and Paneth cells, without the significant effect on goblet cells (Figure 1—figure supplement 6A, B).

Compared to the 2-week-old miR-31 KO mice, 2- and 8-month-old mutant mice exhibit slightly stronger phenotypes in terms of the changes in crypt height and apoptotic cell levels (Figure 1—figure supplement 5C, D). The mutant phenotypes are quite similar between 2- and 8-month-old animals (Figure 1—figure supplement 5C, D and Figure 1—figure supplement 6A, B).

In the individual reviews, you will find other detailed comments that when addressed should improve your manuscript significantly.

Reviewer #1:

[…] Figure 1A – the authors heavily focus on the localization of miR-31 expression in Lgr5+ cells, however they do not show whether this transcript is also expressed in other cell populations in the intestine under normal conditions. For example, is miR-31 expressed in the +4 stem cell population under normal conditions? A higher magnification of the in situ in Figure 1—figure supplement 1A may help clarify this issue.

We appreciate the reviewer’s suggestions. This criticism is essentially the same as the Editor’s point above. Please see our detailed third response to the Editor above.

Figure 1F-L – the authors show a decrease in intestine Lgr5+ cells in miR-31 deletion mouse model and an increase in the miR-31 overexpression model. However, they do not fully describe the consequences of these changes in stem cell numbers under normal circumstances. Is intestine tissue homeostasis affected? Are there changes in other intestine cell populations (enterocytes, goblet cells, paneth cells, entero-endocrine cells)? The phenotypes of these models under are important to characterize before making conclusions about injury or tumorigenesis.

This is an important point! To address it, we first characterized the phenotypes of miR-31 overexpressing transgenic mice. Our findings were summarized below:

i) Following 2-week Dox induction, TRE-miR31 mice exhibited a significant reduction in body weight (Figure 1E) and their intestines were moderately, but significantly shorter than in controls (Figure 1E).

ii) miR-31 induction resulted in expansion of intestinal crypts with more proliferative cells (Figure 1F, G). Also, more apoptotic cells were detected at the tips of TRE-miR31 villi (Figure 1H), suggesting enhanced epithelial cell turnover. However, the length of villi was mildly reduced in TRE-miR31 mice, and the length of crypt/villus was not significantly altered in TRE-miR31 mice, as compared to controls (Figure 1—figure supplement 2A).

iii) We pulse-chased epithelial cells along the crypt-villus axis after a single dose of BrdU. Consistently, upward movement of BrdU+ cells from crypt to villi was enhanced in TRE-miR31 mice (Figure 1—figure supplement 8).

iv) Fewer goblet, enteroendocrine and paneth cells were found in intestines from TRE-miR31 mice following 2-week Dox induction, suggesting impaired cell differentiation (Figure 1—figure supplement 4A, B).

Together, these results suggest that miR-31 induction accelerates the conveyer belt-like movement of ISC progeny into the villi and their shedding into the lumen, which could comprise the differentiation of specialized intestinal cell types.

Next, we examined the consequence of miR-31 loss in both miR-31 germline knockout (KO) and Villin-Cre-driven intestinal epithelial conditional KO (cKO) mice. We followed these mice up to six months. Both miR-31 KO and cKO mice are viable and fertile with no apparent gross phenotypes observed. Upon closer examination of their intestines, we found that:

i) Deletion of miR-31 leads to a significant reduction in crypt height with fewer proliferative cells (Figure 1I and Figure 1—figure supplement 5C, D).

ii) Deletion of miR-31 gives rise to apoptotic cells throughout thecrypt-villus axis. At the same time, apoptotic cells were predominantly present at the tips of control villi and very rare apoptotic cells appear in the control cryptvillus axis (Figure 1—figure supplement 5C, D). Analogous phenotypes were also found in the cKO mice (Figure 1—figure supplement 7A, B).

iii) Deletion of miR-31 led to increased number of enteroendocrine and paneth cells, while the number of goblet cells is not altered in miR-31 KO intestines (Figure 1—figure supplement 6A, B).

iv) In a pulse-chase experiment after a single dose of BrdU, upward movement of BrdU+ cells from crypts to villi was impaired in KOmice (Figure 1—figure supplement 8).

Also, what happens to mice overexpressing miR-31 for an extended amount time (beyond 2 weeks)? This question is also relevant to Figure 7.

To examine the long-term effect of miR-31 induction, we treated control and TRE-miR31 mice with Dox for 1 year. We found that long-term miR-31 induction gives rise to proliferative expansion of crypts, increased apoptosis at

the tip of the villi and reduction in the differentiated cell numbers (Figure

1—figure supplement 2C, E and Figure 1—figure supplement 3 and Figure 1—figure supplement 4). This phenotype is quite similar to that of TRE-miR31 mice induced for two weeks. This data suggests that sustained miR-31 increases proliferation levels, but is not able on its own to induce tumor formation.

Figure 4J – to demonstrate that miR-31 induction is sufficient to maintain organoid growth in the absence of R-spondin, the authors should also perform a cell propagation assay over a period of a few passages.

Per reviewer’s suggestion, we performed cell propagation assay for five passages. We found that the Dox-treated and R-Spondin-freeTRE-miR31 organoids can be normally passaged for at least five times, which is similar to the control organoids cultured with R-Spondin. These results suggest that miR-31 induction can compensate for R-Spondin and activate Wnt signaling pathway.

These data are now included in Figure 4L.

Figure 7 – the authors claim that miR-31 plays an oncogenic role in intestinal cancer, however they do not show what happens to the intestine when miR-31, itself, is overexpressed for an extended period of time? Is amplification of miR-31, itself, oncogenic or just leads to hyperproliferation?

This is an important question, and it is the same as that above.

Please see our detailed third response to reviewer 1 above.

This is especially interesting to know if one where to do miR-31 agonism experiments to induce regeneration during damage or restore barrier function.

We agree with the reviewer that it will be very interesting to examine the function of miR-31 agonism in barrier restoration. Histology and immunohistochemistry for Ki67 show that Dox-induced miR-31 overexpression promotes intestinal epithelial regeneration after irradiation (Figure 3—figure supplement 1B). Further, lineage-tracing assay shows that miR-31 induction accelerates generation of new progeny from Lgr5+ ISCs in response to irradiation (Figure 3D, E). These findings suggest that miR-31 agonism is likely to accelerate regeneration and barrier restoration. To our knowledge, another effective approach for testing this idea would be to deliver miR-31 mimics to injury area using nanoparticles. However, this technically challenging experiment lies out of the scope of the current study. We hope, future follow-up studies will investigate the role of miR-31 in barrier restoration more comprehensively.

Reviewer #2:

[…] However, many aspects of the study are sloppy or poorly described, so major revisions and additional experiments are needed prior to publication, as described in detail below.

1) The phrase "…miR-31 is the master modulator of intestinal stem cells…" in the title is hyperbolic and should be toned down (perhaps, "a major modulator" would be more appropriate).

We agree with the reviewer. Following this suggestion, we changed the title to “Stress Responsive miR-31 is a Major Modulator of Mouse Intestinal Stem

Cells during Regeneration and Tumorigenesis”.

2) Figure 1—figure supplement 1A: In situ hybridizations require negative controls (ideally miR-31-/- sections).

We thank the reviewer for pointing this out. In the revised manuscript, we used miR-31 KO intestinal sections as the negative control. We also included TRE-miR31 (miR-31 overexpressing) intestinal sections as the positive control.

These new data are now included in Figure 1B.

3) A better characterization of the miR-31 transgenic and knockout alleles is needed. For example, in what tissues is the miR-31 transgene expressed upon Dox administration?

To determine the expression pattern of miR-31 in Rosa26-rtTA;TRE-miR31 mice,we performed in situ hybridization for miR-31 and found it to be predominantly expressed in the intestinal epithelial cells, albeit Rosa26 promoter is expected to be active in all tissues. This data is shown in Figure 1—figure supplement 1H.

Are there any overt phenotypes associated with acute miR-31 induction or germline miR-31 deletion?

This question is nearly identical to a point by the first reviewer. Please see our second response to reviewer 1.

Are miR-31 knockout alleles transmitted at the expected Mendelian ratios?

We have performed statistic analysis and found the transmission of miR31 knockout alleles generally meets the Mendelian ratios. This data is now included in Figure 1—figure supplement 5B.

Expression in what tissues is shown in Figure 1—figure supplement 1D, G?

Intestinal epithelial tissues were used to detect miR-31 expression levels in both TRE-miR31 and miR-31 KO mice. We clarified it in the figure legends of the revised manuscript. These data are now included in Figure 1—figure supplement 1B, E.

4) The BrdU pulse experiments in Figure 1D-E should be followed out for 24, 48, and 72 hours which may reveal clearer differences between the genotypes. The images showing BrdU staining in miR-31+/- vs. miR-31-/- crypts (Figure 1D) do not look overtly different.

This is a great suggestion. For this revision, we analyzed the outcomes of pulse-chase experiments on epithelial cells in both TRE-miR31 and miR-31-/- mice at 24, 48, and 72 hours following single dose of BrdU. We found that upward movement of BrdU+ cells from crypts to villi was enhanced in TRE-miR31 mice, and impaired in miR-31-/- mice at all time points, which is consistent with our original results. These new data are now included in Figure 1—figure supplement 8.

5) The finding of reduced Hopx-derived crypts after injury (Figure 2E) can be fully explained by the finding of increased apoptosis in +4 cells after irradiation (Figure 2C). This should be acknowledged in the text.

We agree with the reviewer. We have now acknowledged this possibility in the text: “…miR-31 deficiency-mediated reduction in proliferation and increase in apoptosis within both CBC and reserve ISC compartments could account for the impaired regeneration of miR-31 null intestine…”.

6) Figure 1—figure supplement 2D: Simple growth curves (i.e. cell counts over time) would be preferable to these Ki67 stains of cultured cells. Since these cells are uniformly proliferating, albeit possibly at different rates, they all should be Ki67 positive.

This is a good suggestion. We agree with the reviewer that Ki67 immunofluorescence is not a highly definitive method for detecting proliferation of cultured cells. Instead, we have examined the effect of miR-31 on proliferation of HCT116, SW480 and LOVO colorectal cancer cells using MTT assay. This new data has been shown in the Figure 7−figure supplement 1A.

In addition, a description of this cell line is needed in the Materials and methods (how was Dox-inducible miR-31 established in these cells?).

To make the Dox-inducible miR-31 cells, HCT116 cells were cultured in DMEM medium until 90-95% confluence. 4 μg of pTet-On plasmid (Clontech) were transfected using LipofectamineTM 2000 according to the manufacturer’s instructions. Positive clones were selected following treatment with 800 μg/mL G418 for 2 weeks. Clones were seeded into 24-well plates with DMEM medium and genotyped by PCR. Positive clones were co-transfected with TRE-miR31 plasmid and selection vector pTK-Hyg (Clontech) at a molar ratio of 20:1, and selected by addition of 600 μg/mL Hygromycin for 2 weeks. Surviving clones were PCR genotyped. The cells containing pTet-On and TRE-miR31 plasmids were used to induce miR-31 overexpression with Dox.

For this revision, instead of Dox-inducible miR-31 cells, we chose to examine the effect of miR-31 mimics on proliferation of HCT116 colorectal cancer cells using MTT assay in the revised manuscript. Thus, we have removed the data on Dox-induced miR-31 overexpression in HCT116 cells, and we do not include this method in the revised manuscript.

Also, what is the "control" condition used in this experiment (and Figure 4H-I)? It is unlikely that the same control would be appropriate for anti-miR-31 and Dox. The former needs a scrambled anti-miR and the latter needs untreated cells.

In the original manuscript, we used the scramble RNA as a control to both anti-miR-31 and Dox induction. We agree with the reviewer that scramble RNA is not the most stringent control. In the revised manuscript, we repeated these assays using miR-31 mimics instead of Dox-induced miR-31 over-expression. We used miR-31 inhibitor-NC and miR-31 mimics-NC as the negative controls for miR-31 inhibitor and mimics, respectively. Information of miR-31 inhibitor-NC and miR-31 mimics-NC is now included in the Materials and methods section. Thus, we removed old Dox-induction data and added new data in Figure 4H, I.

7) In multiple experiments, "scrambled RNA" is used as a negative control for anti-miR-31 (e.g. Figure 5F, 7A, etc.). The source of the anti-miR-31 is not described (please add), but it is unlikely that a scrambled RNA molecule would be the appropriate control. Anti-miRs are usually modified oligonucleotides and a scrambled oligo of the same composition should be used as a negative control.

The sequence of miR-31 inhibitor is 5’-AGCUAUGCCAGCAUCUUGCCU3’, while the sequence of Scramble RNA is 5’-CAGUACUUUUGUGUAGUACAA-

3’. This information is now included under the Cell Culture section of the Materials and methods. Although the nucleotide composition of Scramble RNA is not exactly same as Anti-miR-31, they are quite similar. To our knowledge, this particular scramble RNA has been used as a common negative control to microRNA inhibitors in multiple previous studies (Qin et al., 2014; Zhang et al., 2016). Thus, we believe that this scramble RNA is acceptable as a validated negative control for Anti-miR-31.

8) Figure 1—figure supplement 2F: Showing an image of a single crypt is not sufficient to make the point that the stem cell compartment is expanded in TRE-miR-31 colon. Quantification of numerous crypts in multiple mice is needed to make this point.

In response to suggestions from the editor and reviewer #3 we focused this revised manuscript solely on the role of miR-31 in small intestine. Thus, we removed this piece of data. Generally, we agree with the reviewer that quantification of numerous crypts in multiple mice is necessary. We plan to consolidate this data in our future study, which will focus on the role of miR-31 in colon.

9) The histologic analysis shown in Figure 1—figure supplement 2A-C (crypt height, Ki67) should be shown in Vil-Cre; miR-31fl/fl mice as well.

In the revised manuscript, we included histological analysis on Vil-Cre; miR-31fl/fl(cKO)mice. We found that specific deletion of miR-31 in the intestinal epithelium also led to a significant reduction in crypt height with fewer proliferative cells. This is consistent with the miR-31 germline KO results. We included new cKO data in Figure 1—figure supplement 7.

10) Insufficient Vil-Cre; miR-31fl/fl mice are examined after irradiation or DSS (n=2 or n=3, respectively). Given the inherent variability of the effects of these treatments, analysis of more mice is needed. Weight loss and clinical scores should be examined in these mice after DSS so the phenotype can be more completely compared to the germline KO mice.

We improved the robustness of our irradiation data by increasing the total number of Vil-Cre and cKO mice to n = 5 each.

Also, as mentioned above, all of the colon data has been removed in the revised manuscript. We will report DSS-treated colon data in the future follow-up study.

11) The ISH experiments in Figure 7—figure supplement 1 are inadequate to make the point that miR-31 is upregulated in colon cancer (many samples would be needed with quantification). If this is previously established in the literature, I would recommend removing these data (or greatly expanding these analyses so the results are meaningful).

This is a good suggestion! We have removed this piece of data from the revised manuscript. Instead, we now cite the following articles to demonstrate that miR-31 is up-regulated in colorectal cancers.

References:

1) Bandres, E., Cubedo, E., Agirre, X., Malumbres, R., Zarate, R., Ramirez, N., Abajo, A., Navarro, A., Moreno, I., Monzo, M., et al. 2006. Identification by Real-time PCR of 13 mature microRNAs differentially expressed in colorectal cancer and non-tumoral tissues. Mol Cancer 5:29.

2) Cottonham, C.L., Kaneko, S., and Xu, L. 2010. miR-21 and miR-31 converge on TIAM1 to regulate migration and invasion of colon carcinoma cells. J Biol Chem 285:35293-35302.

3) Wang, C.J., Zhou, Z.G., Wang, L., Yang, L., Zhou, B., Gu, J., Chen, H.Y., and Sun, X.F. 2009. Clinicopathological significance of microRNA-31, -143 and -145 expression in colorectal cancer. Dis Markers 26:27-34.

4) Yang, M.H., Yu, J., Chen, N., Wang, X.Y., Liu, X.Y., Wang, S., and Ding, Y.Q. 2013. Elevated microRNA-31 expression regulates colorectal cancer progression by repressing its target gene SATB2. PLoS One 8:e85353.

12) Figure 7H: Quantification of tumor burden in these experiments needed. n=3 is a very small number for these types of experiments. The image quality is very poor in these figure panels.

In the revised manuscript, 6 Vil-Cre;APCfl/+ and 6 Vil-Cre;APCfl/+;miR-31-/- mice have been analyzed in the APC mutant tumor model experiment. We quantified the tumor burden in both Vil-Cre;APCfl/+ and Vil-Cre;APCfl/+;miR-31-/- mice, and found that loss of miR-31led to its remarkable reduction in tumor burden. Further, we examined proliferation and apoptosis in Vil-Cre;APCfl/+ and Vil-Cre;APCfl/+;miR-31-/- tumors. Consistent to the reduced tumor burden, we found a decrease in the number of proliferating cells and reduced numbers of nuclear β-catenin+ cells in Vil-Cre;APCfl/+;miR-31-/- tumors. These new data are now shown in Figure 7G-J.

We have replaced the Figure 7H with higher resolution images. As they are low magnification images, it is hard to make them very clear. If needed, we could provide the original high-quality images.

13) Figure 8A, M: How was the miR-31 promoter defined (genomic coordinates, including coordinates of STAT, NF-κB binding sites)? What specifically was cloned to make the promoter reporter constructs? These plasmids are not described in the Materials and methods.

The transcript of primary miR-31 is located on Chromosome 4 at NC_000070.6 (88910557..88910662, complement) in the mouse genome. The 2 Kb region upstream of the transcription start site (TSS) was identified as the miR31 promoter in this study. It is located on the Chromosome 4 at NC_000070.6 (88910663..88912663) and was cloned into the pGL3-Basic reporter constructs.

The binding site for STAT3 is located at 88911572-88911582. The p65 binding sites #1 and #2 are located at 88912038-88912048 and 88912409-88912419, respectively. This information is now included in the Materials and methods.

Reviewer #3:

[…] Overall, there are some interesting findings presented that clearly define an important role for miR-31 in the intestine. However, the major claim that miR-31 exerts its effects via specifically regulating stem cell activity in vivo is poorly substantiated.

1) The experiment data are mainly relate to the intestine but there is sporadic inclusion of data from the colon. Analyses should either be extended to include both organs or the focus restricted to only one of them to make it easier for the reader to follow.

We appreciate reviewer’s criticism. Following additional considerations, we made a strategic decision to solely focus our revised manuscript on the role of miR-31 in small intestine during homeostasis, epithelial regeneration and tumorigenesis. Thus, all colon data has been removed from the revised manuscript.

2) In-situ hybridization panels for miR-31 throughout the manuscript are difficult to interpret and need replacing with much higher resolution images to accurately document the location and relative levels of endogenous miR-31 expression in the small intestine and colon. Is expression confined to the crypt base (stem cells + Paneth cells) or present throughout the TA compartment Perhaps RNAscope would help here? Intestinal tissue from the miR-31 null mice should be included as a negative control.

In the revised manuscript, we have included higher magnification images of miR-31 in situ hybridization under both homeostatic and injury conditions (Figure 1B, D). As the reviewer suggested, we have used miR-31 KO intestinal sections as negative control. We also used TRE-miR31 (miR-31 overexpressing) intestinal sections as positive control. The in situ assay reveals that miR-31 expression levels are generally higher in the crypts than in the villi and that miR-31 is predominantly expressed in the epithelial cells of intestinal crypt, including Lgr5+ and Hopx+ stem cells, and transit amplifying cells. These data is now included in Figure 1B, D.

RNAScope is an excellent method for detecting RNA species at a higher resolution. We have consulted with the company producing these reagents. However, it does not work for mature microRNAs due to its short nucleotide sequence. We thus have to detect miR-31 expression using traditional digoxigenin (DIG)-labeled probes (Exiqon) following the manufacturer’s protocol, as well as qRT-PCR.

3) The up-regulation of miR-31 seems to occur at relatively late phase (4-5 days after damage-induced stress). Is there any reason that it does not express in acute phase despite it apparently being such a critical modulator of epithelial regeneration? Wouldn't you expect rapid induction of expression to effect epithelial repair and establish barrier function?

In response to DSS treatment, miR-31 level is continuously upregulated with time, while it is not significantly changed within the first 24 hours. In our original manuscript, we have shown that miR-31 is regulated by both NF-κB and STAT3 signaling pathways, which are important inflammation signals. We believe that those inflammation signals are not activated within 24 hours after DSS treatment, resulting in no significant change of miR-31 level. Considering the revised manuscript focuses on the role of miR-31 in small intestine, we have removed the colon data.

Following 12 Gy γ-IR, miR-31 levels transiently and markedly drop by 24 hours (full proliferative arrest/DNA damage response) (Figure 1C), and then sharply upregulated 48 hours post-γ-IR (during initiation of regenerative proliferation from radioresistant ISCs), returning to baseline levels within one week (after full recovery) (Figure 1C). We believe that reduction in miR-31 levels during early phase results from severe loss of Lgr5+ cells. Indeed, most Lgr5+ cells, that highly express miR-31, were depleted within 24 hours following 12 Gy γ-IR. However, between 24 to 48 hours post-IR miR-31 becomes markedly upregulated, and this coincides with the miR-31 promoter activation by STAT3 signaling pathway (Figure 8). We hope that this clarifies the causes behind the observed miR-31 dynamics.

4) Figure 1B – where does miR-31 expression accumulate in the intestinal epithelium following irradiation? Is it uniform across the epithelium in regenerating areas or is it restricted to certain lineages? Again, high quality in-situ hybridization analysis is needed here.

In situ hybridization data showed that miR-31 is dramatically upregulated in the regenerative foci, but not uniformly so across the intestinal epithelium. New in situ images have been included in Figure 1D of the revised manuscript.

5) Figure 1—figure supplement 1 – why was analysis of the miR-31 overexpression phenotype only conducted after 2 weeks?

Indeed, we performed time-course histological analysis in both M2rtTA and TRE-miR31 mice. It revealed that the heights of intestinal crypts in the control M2rtTA mice were not significantly altered at different time points in response to Dox treatment. In contrast, crypts were significantly expanded in TRE-miR31 mice following 14 days of Dox treatment, and the height of expanded crypts stabilized and was maintained for up to 1 year upon continuous Dox induction (Figure 1—figure supplement 2C-E). Given that crypt elongation reached it maximum levels within 2-weeks of Dox induction, we thus conducted most of the subsequent assays at this timepoint.

A detailed time-course with early time-points is needed to determine when the phenotype first presents and in which cell-type (using lineage markers) – is it selectively driven from the stem cell compartment?

To address this question, we characterized the phenotypes of TRE-miR31 mice following 7, 10 and 14 days of Dox induction. No apparent phenotypes were found in TRE-miR31 mice following 7-day Dox induction (Figure 1—figure supplement 2C, E). The phenotype of crypt expansion started presenting in TRE-miR31 mice after 10 days of Dox treatment (Figure 1—figure supplement 2C, E). Next, we examined various differentiated cells using lineage markers and found that the numbers of Paneth cells in the crypts were prominently reduced, while goblet and enteroenderocrine cells reduced mildly, yet significantly in TRE-miR31 villi (Figure 1—figure supplement 4A, B). We also showed that the numbers of Lgr5+ intestinal stem cells increases in TRE-miR31 mice following 10 days of Dox induction (Figure 1—figure supplement 3C, D). Based on the above findings, we conclude that the effect of miR-31 induction on intestine is extensive, and not restricted to Lgr5+ ISCs only.

Any apoptosis apparent following gain/loss of miR-31 expression?

To address this question, we performed immunohistochemistry for cleaved Caspase 3 in intestine from both miR-31 KO and TRE-miR31 mice. We found that loss of miR-31 gave rise to a certain number of apoptotic cells throughout miR-31 KO crypt-villus axis, while apoptotic cells are predominantly presented at the tip of control villi and very rare apoptotic cells are presented in crypt-villus axis (Figure 1—figure supplement 5C, D). Consistently, we also found that conditional deletion of miR-31 gave rise to a certain number of apoptotic cells in cKO crypt-villus axis, particular in the crypt region (Figure 1—figure supplement 7C, D), while only rare cleaved-caspase3+ apoptotic cells were found in control crypts, and apoptotic cells was also mainly located at the tip of control villi. Morphometric analysis revealed that ectopic apoptosis was mainly restricted to the CBC cells of cKO crypts (Figure 2J). By contrast, more apoptotic cells were found at the tip of TRE-miR31 villi as compared to controls, while no significant change were found for apoptotic cells throughout crypt-villus axis between both control and TRE-miR31 mice (Figure 1—figure supplement 3). Together, these findings suggest that miR-31 loss induces ectopic apoptosis in the intestinal epithelium, particularly in the CBC cells.

Any effect on the Paneth cells (important regulators of stem cell activity)?

In the revised manuscript, we have performed immunofluorescence for Lysozyme that detects paneth cells in TRE-miR31 mice. There are fewer paneth cells in TRE-miR31 intestines, relative to controls (Figure 1—figure supplement 4). Conversely, more Paneth cells were found in miR-31 KO intestines (Figure 1—figure supplement 6A, B). Considering that the Paneth cells were thought to be the niche of Lgr5+ intestinal stem cells (Sato et al., 2011), the reduction of Paneth cells is contrary to the increased number of Lgr5+ cells in TRE-miR31 mice. Thus, we do not believe that the expansion of intestinal stem cells in TRE-miR31 mice is dependent on the niche signals from Paneth cells. This also brings up recent findings that conclusively show that Paneth cells are not actually important regulators of ISC activity or a critical source of Wnt ligands, as Paneth cell ablation, or ablation of Wnt production in all epithelial cells (via porcupine deletion) has no adverse effect on ISCs (Durand et al., 2012) (Kim et al., 2012) (Aoki et al., 2016) (San Roman et al., 2014).

6) What happens to the villi in the mice with hyperproliferative crypts? One would assume they increase in length if no additional apoptosis is present at the villus tips.

This is a good point. Immunohistochemistry assay for cleaved Caspase 3 showed more apoptotic cells at the tips of TRE-miR31 villi (Figure 1H and Figure 1—figure supplement 3A). Furthermore, we found that the length of villi is significantly, albeit moderately, shortened in TRE-miR31 transgenic mice (Figure 1—figure supplement 2A). At the same time, the total length of the crypt/villus units is not significantly altered (Figure 1—figure supplement 2A). The findings suggest that miR-31 induction promotes turnover of intestinal epithelial cells, but it does not significantly affect the length of the crypt/villus units.

Are the phenotypes observed following modulation of miR-31 expression consistent throughout the small intestine?

To address this question, we characterized histology of the duodenum, jejunum and Ileum in TRE-miR31 mice treated with Dox for 2 weeks. The phenotype of crypt expansion in TRE-miR31 mice is consistent in different intestinal segments. This new data is now included in Figure 1—figure supplement 2B.

Does the length of the intestine/colon change in the various miR-31 mouse strains?

The intestine length in TRE-miR31 mice was moderately but significantly shorter than in control animals following 2 weeks of Dox induction. This data is now shown in Figure 1E.

No apparent differences in intestinal lengths was found between control and miR-31 KO mice (Figure 1—figure supplement 5A).

7) Why was HCT116 chosen for the in vitro gain/loss of function experiments?

We have documented the reasons of choosing HCT116 colorectal cancer cells below:

i) Firstly, we examined miR-31 expression levels between several

colorectal cancer cell lines using qRT-PCR and found them to be the highest in HCT116 cells. qRT-PCR results are shown in Author response image 1.

Author response image 1.

qRT-PCR analysis for miR-31 in HCT116, LOVO, COCA2, HT29 and SW480 colorectal cancer cells.

**p < 0.01; ***p < 0.001.

Author response image 1.

ii) Secondly, it is well known that HCT116 cells are able to form tumors

after xenografting. Thus, we selected HCT116 cells for their robust performance in the xenograft experiments.

iii) Thirdly, HCT116 cells are heterozygous for β-catenin, harboring one

wild type and one mutant allele (Ilyas et al., 1997). The mutation in HCT116 cells (deletion of codon 45) results in loss of highly conserved serine residues in the region of the protein that may be a target for the enzyme GSK3β. However, prior works showed that Wnt activity in HCT116 cells is regulated by both Gsk3β (Kaler et al., 2009), and Wnt3a (Wu et al., 2012) (Voloshanenko et al., 2013). Thus, although heterozygous for β-Catenin mutation, HCT116 cells are still responsive to Wnt signaling modulation, rather than having Wnt pathway constitutively and highly active.

For these three reasons, we believe that HCT116 cell line is suitable for studying miR-31 functions.

Is the phenotype also consistent for other colon cancer cells harboring different mutation spectra (for example APC mutations in place of the β-catenin mutation)?

To address whether miR-31 also functions in APC mutated cells, we examined the effect of miR-31 mimics and the inhibitor on LOVO colorectal cancer cells. We show that miR-31 mimics significantly promote proliferation of LOVO cells, and conversely miR-31 inhibitor represses it (Figure 7—figure supplement 1A). Thus, our findings suggest that miR-31 has shared functions in both types of colorectal cancer cells, with either β-Catenin or APC mutations.

8) Figure 1D, E – the increased movement of crypt cells in the miR-31 gain/loss experiments is not at all evident to me from the BrdU pulse-chase experiment figure panels. Entire crypt/villus units should be included here to document the more rapid emergence of BrdU-labelled cells onto the villi from the crypts.

Per reviewer’s suggestion, the revised manuscript shows the entire crypt/villus units. We also performed BrdU pulse-chase experiment on epithelial cells in both TRE-miR31 and miR-31-/- mice, tracing cells for 24, 48, and 72 hours after a single pulse of BrdU. We found that upward movement of BrdU+ cells from crypts to villi was enhanced in TRE-miR31 mice, and impaired in miR-31-/- mice. This is consistent to our original results. This new data is now included in Figure 1—figure supplement 8.

Do the villi get longer as a result of the enhanced cell migration or is there more apoptosis at the villus tips?

We believe this question largely overlaps with the reviewer 3’s point 6. Please see our first response to point 6 above.

9) Figure 1F, G – the observed increase in Lgr5-driven GFP expression following overexpression of miR-31 does not necessarily indicate increased stem cell numbers/activity as claimed. If miR-31 is indeed a potent Wnt enhancer, then overexpression may simply be activating Lgr5 expression (as a Wnt target gene) on non-stem cells. To properly document an increase in Lgr5+ stem cell activity, in vivo lineage tracing must be performed. One would then expect an increase in the number of long-term tracing units observed or an increase in the organoid forming frequency of isolated crypts or sorted GFPhi cells.

This question overlaps with the Editor’s point. Please refer to our first response to Editor’s comments.

The increased organoid budding depicted in Figure 1I is not very convincing – there appears to be a very modest increase in relation to the observed several fold-increase in putative Lgr5+ stem cells in vivo.

To consolidate this data, we have carefully quantified the budding organoids from control and TRE-miR31 crypts. We found that miR-31 induction significantly increases the frequency of budding organoids (Figure 2E), supporting the notion that miR-31 overexpression increases the number of Lgr5+ stem cells. The quantification analysis on budding number and crypt length was based on 3 independent experiments and 10 organoids were quantified at each set of experiment at day 3, day 5 and day 7. We conclude that miR-31 induction significantly, albeit moderately, increases bud number per organoid and leads to more elongated crypts. This data is now shown in Figure 2—figure supplement 1B.

A better way to functionally evaluate the proposed increase in Lgr5+ Stem cells would have been to sort for EGFPhi cells and to determine their organoid forming capacity in comparison to GFPhi cells isolated from crypts with endogenous miR-31 expression levels.

We agree that this would be a good method for determining the organoid forming capacity of Lgr5-GFPhigh cells. For this revision, we made several attempts to isolate and culture Lgr5-GFPhigh cells; however, due to technical difficulties, we were not able to optimize this assay sufficiently enough so that it produces consistent and reproducible results.

Is the increase in apoptosis observed in the organoids following loss of miR-31 expression evident in vivo?

10) What is the miR-31 loss/gain phenotype in the colon? Any changes to the frequency of Lgr5+ cells with tracing/organoid forming capacity?

Considering that the revised manuscript is focused on the role of miR-31 in small intestine during homeostasis, epithelial regeneration and tumorigenesis, we chose to remove all colon data. We plan to investigate the colonic phenotypes in miR-31 gain- and loss-of function models in our future, follow-up study.

11) Figure 2 – does overexpression of miR-31 increase the regeneration rate of the small intestine and colon following sub-lethal doses of γ-irradiation?

To address this question, we examined histology and proliferation in control and TRE-miR31 intestines two and four days after 6 Gy of γ-IR following 2-week Dox induction. Surprisingly, we found that miR-31 induction did not significantly affect the regenerative rate of small intestine after 6 Gy irradiation.

This data is shown in Author response image 2.

Author response image 2.

H&E and immunohistochemistry for Ki67 in intestines from M2rtTA control and TRE-miR31 mutant mice 2 and 4 days post 6 Gy irradiation.

M2rtTA and TRE-miR31 mice were pretreated with Dox for 2 weeks. Scale bar: 50 µm.

Author response image 2.

Lgr5+ stem cells have actually been found to be quite radioresistant (Hua et al., Gastroenterology 2012) and Lgr5+ stem cells are indispensable for crypt regeneration following irradiation (Metcalfe et al., Cell Stem cell 2014) – these observations argue that Lgr5+ stem cells are driving crypt regeneration rather than reserve stem cell populations. Considering this, does Lgr5 expression change in response to miR-31 gain/loss of expression following irradiation?

To address this question, we have performed qRT-PCR analysis for Lgr5 in intestines from TRE-miR31 and miR-31 KO mice at 2 hours, 2 days and 4 days post-irradiation. Lgr5 expression levels were remarkably up-regulated in TRE-miR31 mice at different time points. Notably, Lgr5 increases over 100 folds 4 days post-irradiation. Conversely, Lgr5 expression levels were prominently reduced in miR-31 KO mice at different time points. The data is now included in Figure 3C. The results support the notion that miR-31 protects Lgr5+ cells against apoptosis at the early stage after irradiation and promotes regeneration of de novo Lgr5+ cells at the late stages post irradiation.

Bmi1 has been shown to be expressed throughout the entire crypt (including stem cells) and Hopx expression is enriched in the Lgr5+ stem cell compartment (Munoz et al., EMBOJ 2012). This should at least be discussed/noted in the manuscript rather than referring to these markers as being irrefutable +4/reserve stem cell markers.

We thank the reviewer for pointing this out. We discuss this point in the revised manuscript as follows:

“…We also want to mention that the expression patterns of Bmi1 and Hopx are not specific to +4 position, as both of these transcripts are found nonspecifically throughout the crypt base (Itzkovitz et al., 2011; Li et al., 2014; Munoz et al., 2012). This means that miR-31-activated stem cells represent a complex population including +4 cells, surviving Lgr5+ cells, and those TA cells dedifferentiated in response to irradiation …”

12) Figure 2E – it is very difficult to conclude anything from this Hopx-tracing experiment. What are the figure panels meant to be showing? All I can surmise from this is that Hopx-derived tracing from the crypt base is absent in miR-31 null mice, which is to be expected from the increase in apoptosis observed at the crypt base (harboring the Hopx+ cells) following irradiation. I don't see how you can conclude that miR-31 is required for reserve stem cell activity. I think it far more likely that miR-31 expression is a general proliferation driver proliferation within the crypt, including TA cells which can re-acquire stem cell functions to drive regeneration (see recent papers on plasticity observed within secretory/absorptive progenitors following damage).

We agree with the reviewer that this conclusion is overstated. In the revised manuscript we changed it to say: “miR-31 deficiency-mediated reduction in proliferation and increase in apoptosis within the ISC compartments could account for the impaired regeneration of miR-31 null intestine.”

Do Hopx expression levels change in response to modulation of miR-31 expression levels? Accordingly, does Hopx-driven lineage tracing change?

To address this question, we examined Hopx expression in response to miR-31 induction and miR-31 deletion. During homeostasis, the expression levels of Hopx are down-regulated in TRE-miR31 intestine following 2-week Dox treatment, and, conversely, up-regulated in cKO intestine (Figure 2H). Further, we performed lineage-tracing experiments with Hopx-CreERT;R26-LSL-LacZ mice. We found that miR-31 induction markedly represses generation of lineages from Hopx+ cells during homeostasis. Interestingly, this is opposite to the effect of miR-31 induction on Lgr5+ cells. These new data are now included in Figure 2I and Figure 2—figure supplement 1D.

13) Figure 3 – is colonic regeneration following DSS withdrawal accelerated in miR-31 overexpressing mice?

As mentioned above, we removed all colon data form the revised manuscript and focused it solely on the role of miR-31 in small intestine during homeostasis, epithelial regeneration and tumorigenesis. Colonic phenotypes will be investigated in more details in our future study.

14) Figure 1—figure supplement 2 – phenotype needs far better characterization, incorporating a proper time-course. What happens within the epithelium following miR-31 deletion?

This question is very similar to the Editor’s comment. Please also see our last response to the Editor above.

To address this question, we have carefully characterized the intestinal phenotypes of miR-31 KO mice at 2 weeks, 2 months and 8 months of ages. At these different time points, deletion of miR-31 produces very similar phenotypes in the intestine as follows:

i) Deletion of miR-31 led to a significant reduction in crypt height with fewer proliferative cells (Figure 1I and Figure 1—figure supplement 5C, D).

ii) Deletion of miR-31 gave rise to apoptotic cells throughout thecrypt-villus axis, while normally apoptotic cells are restricted to the tips of villi (Figure 1—figure supplement 5C, D).

iii) Deletion of miR-31 led to increased numbers of enteroendocrine and paneth cells, while the numbers of goblet cells were not significantly altered (Figure 1—figure supplement 6A, B).

Compared to the 2-week-old mice, crypt height and apoptotic phenotypes become somewhat more severe at 2 and 8 months of age (Figure 1—figure supplement 5C, D), and no significant differences were observed between 2- and 8-months-old animals (Figure 1—figure supplement 5C, D and Figure 1—figure supplement 6A, B).

Is the phenotype more general TA cell driven or does it originate from within the stem cell compartment?

In this study, we showed that the frequency of actively proliferating Lgr5+ ISCs is lower in miR-31-/- mice compared to controls (Figure 2B, C). We also showed that proliferation of Lgr5+ ISCs is markedly suppressed in miR-31-/- mice (Figure 2D). Further, our results showed more apoptotic CBCs in cKOmice (Figure 2J) and higher frequency of apoptotic organoids derived from cKO crypts

(Figure 2K). These data strongly indicate that miR-31 deletion inhibits proliferative expansion of Lgr5+ CBCs, and concomitantly induces their apoptosis, and that these are major contributors to miR-31 KO phenotype. Admittedly, we cannot completely rule out that compromised transit amplifying cell proliferation also contributes to the phenotype.

Apoptosis evident as observed with the miR31 null mice?

We believe this question is similar to point 5 above. Please see our third response to reviewer 3’s point 5.

15) Figure 4 – Axin2 expression isn't completely abrogated following loss of miR-31, so it is not correct to claim that Wnt signaling is absent.

We agree with the reviewer. We changed the manuscript text to say: “Wnt pathway activity was absent from CBCs of miR-31-/-crypts, appearing only faintly above the crypt base in the early TA zone.”

Since Axin2 expression encompasses both the stem cell and TA cell compartments in the crypt, the dramatic down-regulation throughout the crypt supports a more general effect on the entire proliferative crypt compartment rather than selectively on the stem cells.

I would like to see IHC for β-catenin performed on the intestines of the different miR-31 mice lines (including an early time-point for the miR-312 overexpression line) to document the effects on Wnt signaling status (including nuclear β-catenin) on the different crypt/villus compartments.

As the reviewer suggested, we now include β-catenin immunohistochemistry results in the revised manuscript. The number of nuclear β-catenin+ cells increases in the TRE-miR31 intestine following 2-week and 2-month Dox induction, while it is not significantly altered following 7-day Dox induction. Conversely, it decreases in the miR-31 KO intestine at two and four months of age. These findings indicate that miR-31 activates Wnt signaling pathway, which is consistent with the Wnt reporter Axin2-LacZ results. These new data are now shown in Figure 4—figure supplement 1A, B.

Figure 4C/D – Although the effects on Wnt signaling are well documented, I would like to have seen a more unbiased approach towards deciphering the direct result of modulating miR-31 expression in the intestine – comparative microarray expression profiling of WT vs. mir-31 null vs. mir31-overexpressing crypts would likely have shed additional light onto the pathways being directly regulated by miR-31. Such analyses at early time-points would also have indicated which cell types are initially being affected.

As the reviewer suggested, we performed microarray analysis on intestinal tissues from three controls and three TRE-miR31 mice following 7-day Dox induction, when phenotype is still not apparent. Transcriptome data from one pair of mice was excluded from analysis due to its low quality. Thus, our analyses are based on two control and two TRE-miR31 mice. The heatmap analysis reveals that miR-31 induction drives rapid and robust change in gene expression (see Author response image 3A). Interestingly, Gene ontology (GO) analysis on both the biological process and KEGG pathways reveals significant enrichment for “Wnt signaling pathway” (Author response image 3B, C), which is consistent with our earlier findings. Other top GO categories of interest include: (i) “Basal cell carcinoma”, (ii) “Hedgehog (Hh) signaling pathway”, (iii) “α-Linolenic Acid metabolism”, (iv)” GnRH signaling pathway”, and (v) “pathways in cancer” (Author response image 3C). Considering that data is based on just two pairs of samples, we opted not to include it in the manuscript. However, if the reviewer thinks that it is worth including it into the supplement, we will be happy to do so.

Author response image 3.

Transcriptome profiling of miR-31 overexpressing intestines.

(A) Heatmap ofintestinal transcriptomeprofiles from two controls and two TRE-miR31 mice treated with Dox for 7 days. (B) Go analysis for biological process on differentially expressed genes in TRE-miR31 intestines. (C) KEGG pathway analysis on differentially expressed genes in TRE-miR31 intestines.

Author response image 3.

Better validation in the form of IHC/In-situ analysis of expression changes to Wnt pathway targets (and targets of the BMP/TGF-β pathways) would also have helped to clarify which cells are responding to the changes in miR-31 expression within the crypts/villi. Are the target genes first changing within the stem cell compartment or is it a more general response? Are similar changes found in both the small intestine and colon?

To validate the effect of miR-31 on Wnt signaling pathway, we first performed immunohistochemistry for β-Catenin in intestines from miR-31 KO mice at 2 and 4 months of ages. We found that less nuclear β-Catenin positive cells were found in miR-31 KO intestinal crypts, as compared to controls (Figure 4—figure supplement 1A). Next, we treated both control and TRE-miR31 mice with Dox for 7, 14 days and 2 months. The numbers of nuclear β-Catenin positive cells are greater in TRE-miR31 intestinal crypts than controls following 14-day and 2-month Dox induction, while no significant difference were found between control and TRE-miR31 mice following 7-day Dox induction (Figure 4—figure supplement 1B). Further, we also showed that much less nuclear β-Catenin positive cells were found in miR-31 null APC mutant tumors, as compared to APC mutant tumors (Figure 7I). Together, these data strongly indicate that miR31 activates Wnt signaling pathway. Nuclear β-Catenin positive cells were not found in intestinal villi from both miR-31 KO and TRE-miR31 mice (Author response image 4A). It suggests that the response of Wnt signaling upon the changes of miR-31 occur within intestinal crypts.

Author response image 4.

Immunohistochemistry for β-Catenin (A), p-Smad1/5/8 (B), and p-Smad2/3 (C) in intestinal villi from M2rtTA and TRE-miR31 mice, as well as miR-31+/- and miR-31-/- mice.

M2rtTA and TRE-miR31 mice was pretreated with Dox for 7 and 14 days Dox induction. Scale bar: 25 µm. These corresponding immunostainings in intestinal crypts were shown in Figure 4—figure supplement 1 and Figure 5—figure supplement 1.

Author response image 4.

To validate the effect of miR-31 on BMP and TGFβ signaling pathways, we examined p-Smad2/3 and p-Smad1/5/8 with immunohistochemistry in miR-31 KO and TRE-miR31 mice. We found that signals of p-Smad2/3 and p-Smad1/5/8 were upregulated in miR-31 KO intestinal crypts, while they are down-regulated in TRE-miR31 intestinal crypts following 7- and 14-day Dox induction (Figure 5—figure supplement 1A, B). It suggests that miR-31 represses BMP and TGFβ signaling pathways. Interestingly, we found that signals of p-Smad1/5/8 was upregulated in miR-31 KO intestinal villi, and down-regulated in TRE-miR31 intestinal villi (Author response image 4B). No p-Smad2/3 positive cells were found in intestinal villi from M2rtTA and TRE-miR31 mice, as well as control and miR-31 KO mice (Author response image 4C). The results suggest that the response of BMP signaling upon the changes of miR-31 occur in both intestinal crypts and villi, while TGFβ signaling only do within intestinal crypts.

To further confirm this idea, we performed the rescue experiment with in vitro organoid culture system. We found that increasing concentrations of the BMP inhibitor Noggin in organoid culture was able to rescue the budding defect in miR-31 cKO organoidsin a dose-dependent manner (Figure 5H, I). Together, our findings strongly indicated an inhibitory role of miR-31 in BMP and TGFβ signaling pathways.

Considering that the revised manuscript is focused on the role of miR-31 in small intestine, we thus do not examine them in colon.

Figure 4J – please accurately quantify the organoid data.

The quantification results are now included in Figure 4K in the revised manuscript.

16) Figure 6 – again, a time-course would be helpful here to determine which genes are likely responding directly to miR-31 expression changes. Since there are obviously working antibodies available for some of the target genes, it would also be nice to see IHC validation of changes occurring in the epithelium in the absence of irradiation. This would document where the changes are taking place within the intestinal epithelium. Are the findings also applicable to the colon?

To address this question, we have carefully performed immunohistochemistry for miR-31 target genes such as Dkk1, Axin1, Gsk3β and Bmpr1a in intestines from TRE-miR31 mice following 7 and 14 days of Dox induction during homeostasis. No apparent phenotype is present in the TRE-miR31 mice following 7-day Dox induction. However, we found that the target genes are prominently reduced in intestinal crypts of TRE-miR31 mice at 7-day time point, and that these changes persist at 14 days (Figure 6—figure supplement 2B, C). Conversely, these genes are generally upregulated in miR31-/- intestinal crypts (Figure 6—figure supplement 2A). No apparent difference of these genes was found in intestinal villi from M2rtTA and TRE-miR31 mice, as well as control and miR-31 KO mice (Author response image 5). The results suggest that these target genes are primarily responded to miR-31 expression changes within intestinal crypts, which is consistent to higher expression level of miR-31 in crypts. Together, these findings support the notion that the above genes are the direct targets of miR-31. To further confirm this notion, we performed RNA crosslinking, immunoprecipitation, and RT-PCR (CLIP-PCR) assays with Ago2 antibodies. The results show that transcripts of Axin1, Dkk1, Gsk3β, Smad3, Smad4 and Bmpr1a are highly enriched in Ago2 immunoprecipitates, and that increasing miR-31 activity augments their enrichment (Figure 6G), providing evidence that miR-31 directly binds to these transcripts. Considering that the revised manuscript is focused on the role of miR-31 in small intestine, we thus do not examine these miR-31 targets in colon.

Author response image 5.

Immunohistochemistry for Dkk1, Axin1, Gsk3β and Bmpr1a in intestinal villi from M2rtTA and TRE-miR31 mice, as well as miR-31+/- and miR-31-/- mice.

M2rtTA and TRE-miR31 mice was pretreated with Dox for 7 and 14 days Dox induction. Scale bar: 25 µm. These corresponding immunostainings in intestinal crypts were shown in Figure 6—figure supplement 2.

Author response image 5.

17) Figure 7 – the tumor-suppressive effect of miR-31 loss is clear, although not surprising given the proliferative block imposed on the cells. Does increased miR-31 expression enhance tumor formation in this model?

To address this question, we transfected HCT116 colorectal cancer cells with miR-31 mimics for 36 hours and then performed xenograft assays. Thirty days after grafting, tumor volume and weight were significantly increased in miR31 mimics-treated tumors. These data are now included in Figure 7A.

Given the increased expression of miR-31 expression in human colon tumors, it would be interesting to see the effect of deleting miR-31 in established mouse intestinal tumors – this would be more indicative of the therapeutic potential of blocking miR-31 expression.

Intestinal adenomas form in this mouse model upon loss of heterozygosity at the APC locus, which is relevant to human disease in that spontaneous loss of APC is found in the vast majority of human colorectal cancers (Kinzler et al., 1991; Nagase et al., 1992). Thus, we deleted miR-31 in Villin-Cre;APCfl/+mice in this study. Loss of miR-31in this animal model remarkably reduced tumor burden (Figure 7G-H), accompanied with the decrease in cell proliferation (Figure 7J). These data suggest a therapeutic potential for miR-31 inhibitor in blocking human colon cancer development.

Figure 1A – again, why was HCT116 chosen for this experiment.

In our opinion, this question relates to the point 7. Please see our detailed response above.

Is the effect of miR-31 expression modulation restricted to Β-catenin mutants or also present in other mutant backgrounds (such as APC null)?

To test this idea, we examined the effect of miR-31 mimics and inhibitor on proliferation of LOVO colorectal cancer cells containing APC mutation. We show that miR-31 mimics promote proliferation, and, conversely, miR-31 inhibitor represses it (Figure 7—figure supplement 1). Here we also show that miR-31 deletion remarkably inhibits growth of APC null tumors in vivo(Figure 7G-J). Thus, we believe that the effect of miR-31 modulation is also present in the APC mutant background.

Figure 7H – the swiss role histology pictures appear to show a complete lack of tumors in the miR-31 null mice, yet there are clearly tumors present on the whole-mount image of the intestine. A more representative picture should be used.

A more representative picture has been included in the revised manuscript, which is now shown in Figure 7H.

Why do some tumors still arise in an APC mutant background in miR31 null mice? What is their Wnt status?

To address this questions, we performed immunohistochemistry for β-Catenin to detect Wnt activity in Vil-Cre;APCfl/+and Vil-Cre;APCfl/+;miR-31-/-tumors.The numbers of nuclear β-Catenin+ cells were dramatically reduced in Vil-Cre;APCfl/+;miR-31-/-tumors as compared to Vil-Cre;APCfl/+tumors (Figure 7I), suggesting reduced Wnt activity in miR-31 null tumors. However, few nuclear β-Catenin+ cells were still present in miR-31 null tumors, indicating that Wnt activity is not completely repressed. We speculate that these Wnt-active cells could give rise to tumors in Vil-Cre;APCfl/+;miR-31-/-mice.

18) Is miR-31 also up-regulated during epithelial regeneration in human intestine (organoids?)? I would like to know its expression status in inflammatory disease patients according to their therapeutic status. Is miR-31 down-regulated when inflammation is well suppressed?

Multiple reports have shown that miR-31 is upregulated in human inflammatory bowel disease (Beres et al., 2017; Lin et al., 2014; Olaru et al., 2011), as compared to normal intestinal and colonic tissues. We assume that miR-31 levels go back to normal upon resolution of inflammation, meaning down-regulation of miR-31. We agree with the reviewer that it would be very interesting to investigate miR-31 expression levels according to therapeutic status. However, human inflamed intestinal tissues and their corresponding inflammation-suppressed ones are not available to us using our resource (we attempted, unsuccessfully, to collaborate with local clinical researchers). Thus, at present we cannot confirm this idea directly. We hope that the reviewer can agree with us that this piece of data is outside of the scope of the present study.

Associated Data

    This section collects any data citations, data availability statements, or supplementary materials included in this article.

    Supplementary Materials

    Figure 1—source data 1. Source data for Figure 1C,E,F,G,H and I.
    DOI: 10.7554/eLife.29538.012
    Figure 1—source data 2. Source data for Figure 1—figure supplements 13.
    DOI: 10.7554/eLife.29538.013
    Figure 1—source data 3. Source data for Figure 1—figure supplements 47.
    DOI: 10.7554/eLife.29538.014
    Figure 2—source data 1. Source data for Figure 2.
    DOI: 10.7554/eLife.29538.017
    Figure 2—source data 2. Source data for Figure 2—figure supplement 1.
    DOI: 10.7554/eLife.29538.018
    Figure 3—source data 1. Source data for Figure 3.
    DOI: 10.7554/eLife.29538.021
    Figure 3—source data 2. Source data for Figure 3—figure supplement 1.
    DOI: 10.7554/eLife.29538.022
    Figure 4—source data 1. Source data for Figure 4.
    DOI: 10.7554/eLife.29538.025
    Figure 4—source data 2. Source data for Figure 4—figure supplement 1.
    DOI: 10.7554/eLife.29538.026
    Figure 5—source data 1. Source data for Figure 5.
    DOI: 10.7554/eLife.29538.029
    Figure 6—source data 1. Source data for Figure 6.
    DOI: 10.7554/eLife.29538.034
    Figure 7—source data 1. Source data for Figure 7.
    DOI: 10.7554/eLife.29538.037
    Figure 7—source data 2. Source data for Figure 7—figure supplement 1.
    DOI: 10.7554/eLife.29538.038
    Figure 8—source data 1. Source data for Figure 8.
    DOI: 10.7554/eLife.29538.040
    Transparent reporting form
    DOI: 10.7554/eLife.29538.042

    Articles from eLife are provided here courtesy of eLife Sciences Publications, Ltd

    RESOURCES