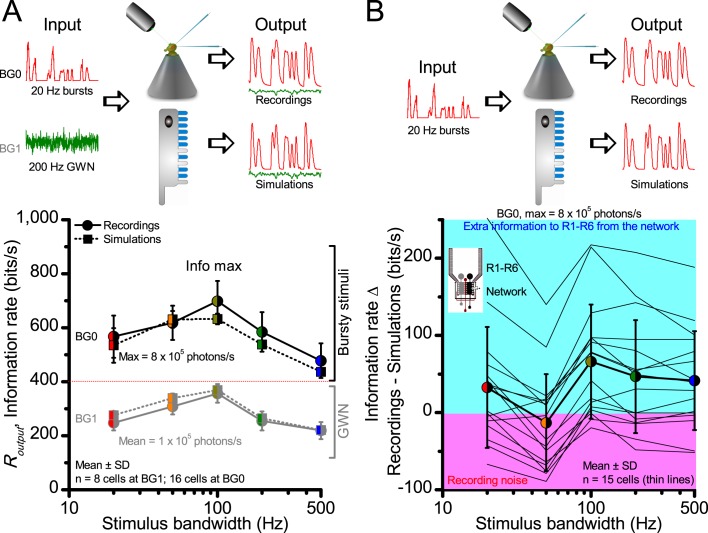
Appendix 2—figure 4. Information transfer rate estimates, Routput, of in vivo recordings and model simulations show similar encoding dynamics.
(A) Comparison of corresponding information transfer rates of R1-R6 recordings and stochastic model simulations to light bursts and Gaussian white noise (GWN) stimuli of different bandwidths. The recorded and simulated information transfer estimates correspond closely over the whole tested encoding space (cf. Figure 2—figure supplement 1 and Figure 4). (B) Their differences to light bursts help to identify extra information in the recordings, which likely comes from the lamina network (through gap-junctions (Wardill et al., 2012) and feedback synapses [Zheng et al., 2006]) to individual photoreceptors. The clear variability between different recordings from individual cells (continuous thin lines) indicates that some R1-R6s may receive up to 200–250 bits/s of information from the network, whereas others receive less (cyan background). Some recordings likely contained more instrumental/experimental noise (pink background), which could render their information transfer rates (in particular to low-frequency bursts) less than that of the model; some of this noise likely comes from low-frequency eye and photoreceptor movements (cf. Figure 2—figure supplement 2). Thick line and error bars give the average information transfer rate difference between the recordings and the model (~0–50 bits/s). The data implies that the extra network information to R1-R6s in vivo is mostly at high burst frequencies (100–500 Hz).

