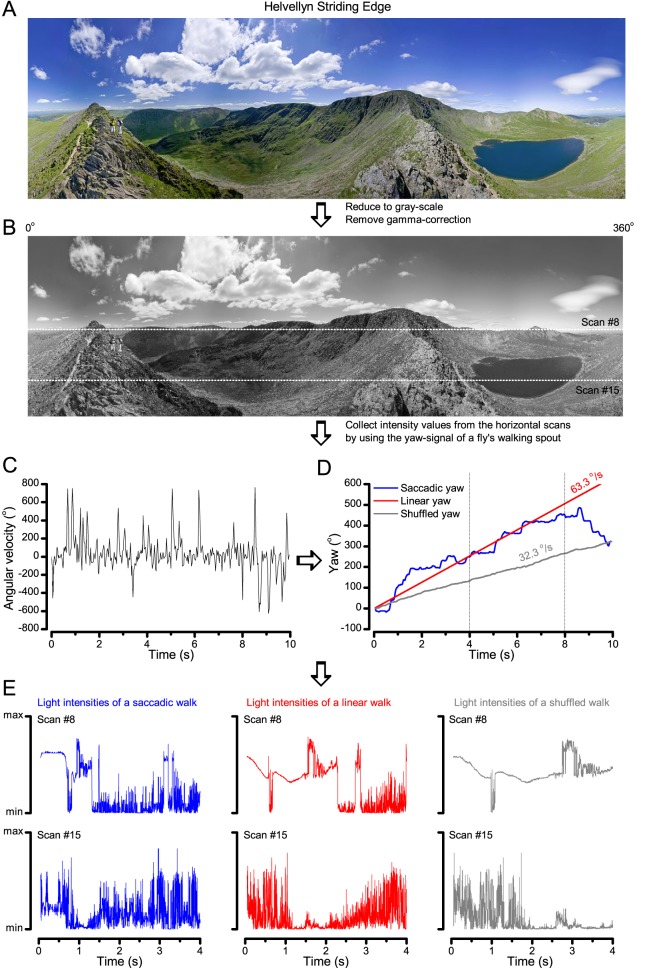
Appendix 3—figure 2. Image processing steps.
(A) 360o panoramic natural images were downloaded from the internet. (B) The images were reduced to gray-scale and their gamma-correction was removed to expose their underlying intensity differences more accurately. We then used 15 evenly spaced horizontal (x-axis) line scans to sample their relative intensity values at different vertical (y-coordinate) position. The white dotted lines show two of these scan lines. (C) Angular velocities during a free fly’s walk, from (Geurten et al., 2014). (D) These velocities were translated to a yaw signal (degree values) over time (named saccadic: blue trace). Red trace shows the linear (median) yaw signal, which corresponds to a fly walking in one direction with the fixed speed of 63.3 o/s. The shuffled yaw (gray trace) is generated by randomly selecting angular velocity values from the recorded walk (in C). (E) These three different yaw signals (o). were then used to sample intensity values from the linear line scans (in B; here shown for #8 and #15) at each 1 ms time-bin, generating unique light intensity time series from the panoramic image. Here the corresponding traces are shown for the first 4 s to highlight how differences in locomotion cause large differences in temporal light stimulation (i.e. light input to photoreceptors). Video 1 shows how these three different walking (or locomotion) dynamics (saccadic, linear and shuffled) affect the image stream to the eyes, using the panoramic ‘swamp forest’ scene (Figure 6C).

