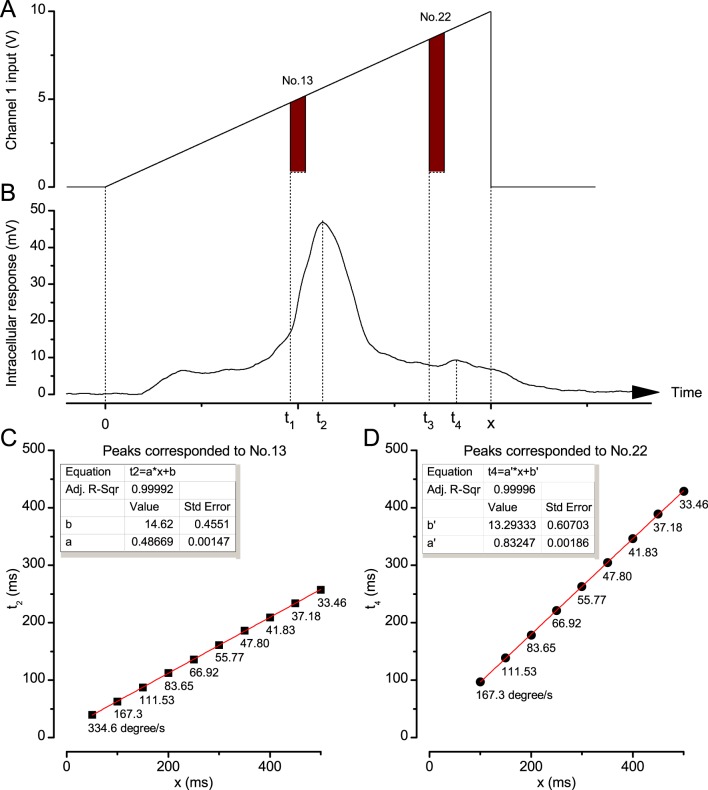
Appendix 6—figure 3. Photoreceptor response maxima lag moving objects.
(A) Channel 1 input was driven by an incremental ramp to create an image of a bright dot (point-object) moving from the No.1 light-point to the No.25 (front-to-back). Similar decremental ramps were used to produce back-to-front motion. (B) Intracellular responses of Calliphora photoreceptors to a moving point-object showed two response peaks: a large peak at t2, which corresponded to the moment it travelled pass the cell’s optical axis at t1, and a smaller peak at t4 caused by the exceptional brightness of light-point No.22, which was turn on at t3. x was the object’s travelling time. (C) An example of the linear correlation between t2 and x. Below each data point is its corresponding stimulus (dot) velocity. (D) An example of the linear correlation between t4 and x. Again, the corresponding dot velocities are shown.

