Figure 10. Optomotor behavior in a flight simulator system confirms hyperacute vision.
Classic open-loop experiments using high-resolution panoramas. (A) 360o hyperacute black-and-white bar panorama, with 1.16o or 2.88o wavelengths (= 0.58o and 1.44o inter-bar-distances), rotated counterclockwise and clockwise (grey, arrows) around a tethered fly, with a torque meter measuring its optomotor responses. (B) Controls: the same flies’ optomotor responses to white (no bars) and wide-bar (14.4o wavelength) rotating panoramas. (C) Every Drosophila responded to the hyperacute panoramas (wavelength < interommatidial angle, Δφ, yellow area; Figure 10—figure supplement 1), but not to the white panorama (orange), which thus provided the recording noise level. The flies optomotor responses were the strongest to the wide-bar panorama (perception index = 1). As the flies’ optomotor responses followed the rotation directions consistently, irrespective of the tested bar wavelengths, the hyperacute visual panorama did not generate perceptual aliasing. (D) Optomotor responses of five flies to hyperacute panorama with 3.9o wavelength, rotating at 50o/s and saccadic speeds of 200 and 300o/s. (E) Control responses of the same flies to 14.4o wavelength panorama at the same speeds. (F) The flies’ ability to follow hyperacute panorama reduces dramatically when the stimulation approaches the photoreceptors’ predicted acuity limit, which for ~4o point resolution is just over 300o/s (cf. Figure 9A). Details in Appendix 10.
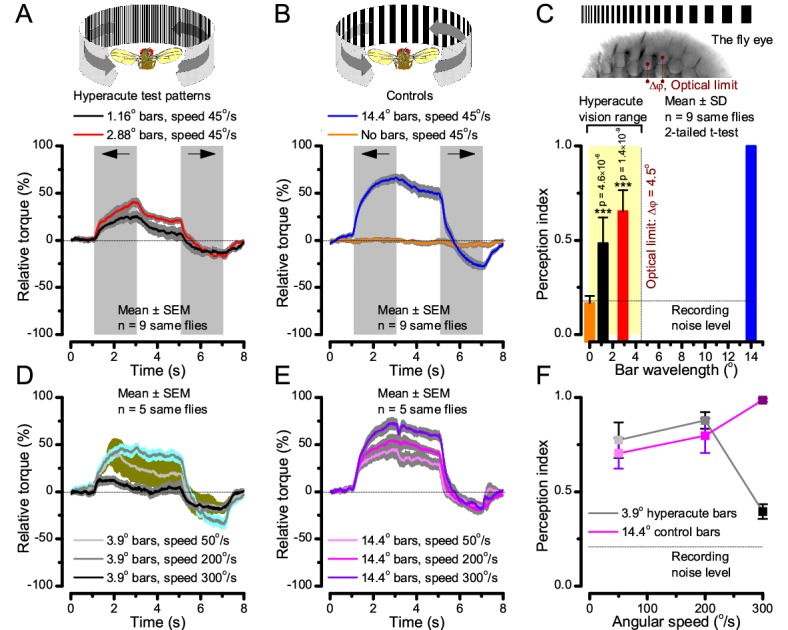
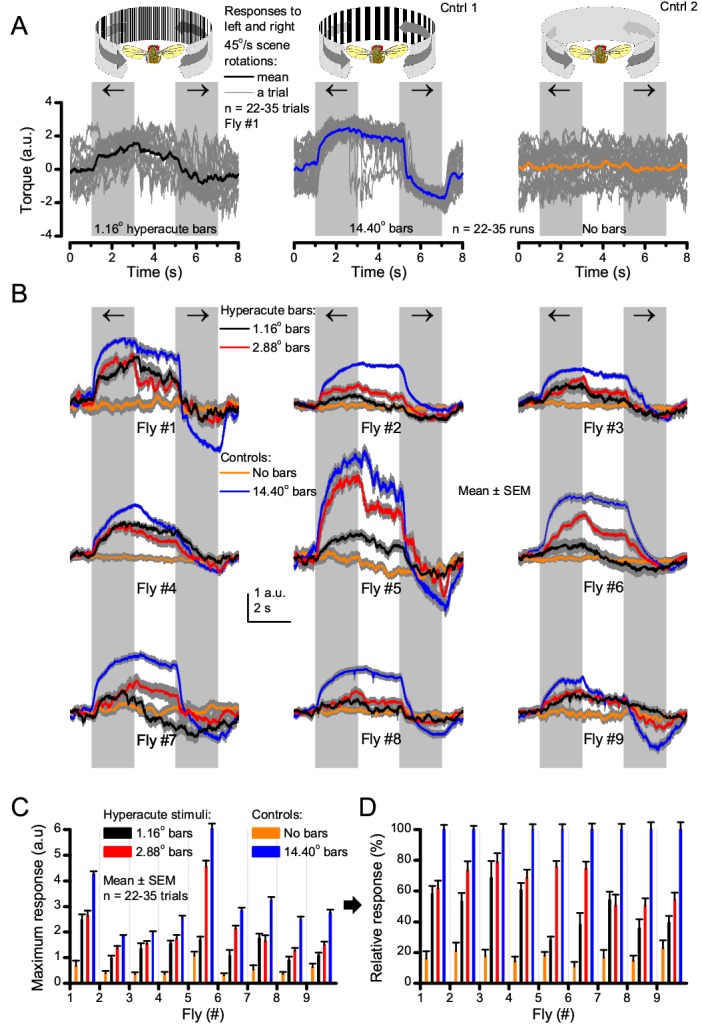
Figure 10—figure supplement 1. Optomotor behavior in a flight simulator system demonstrates that Drosophila see hyperacute visual patterns.