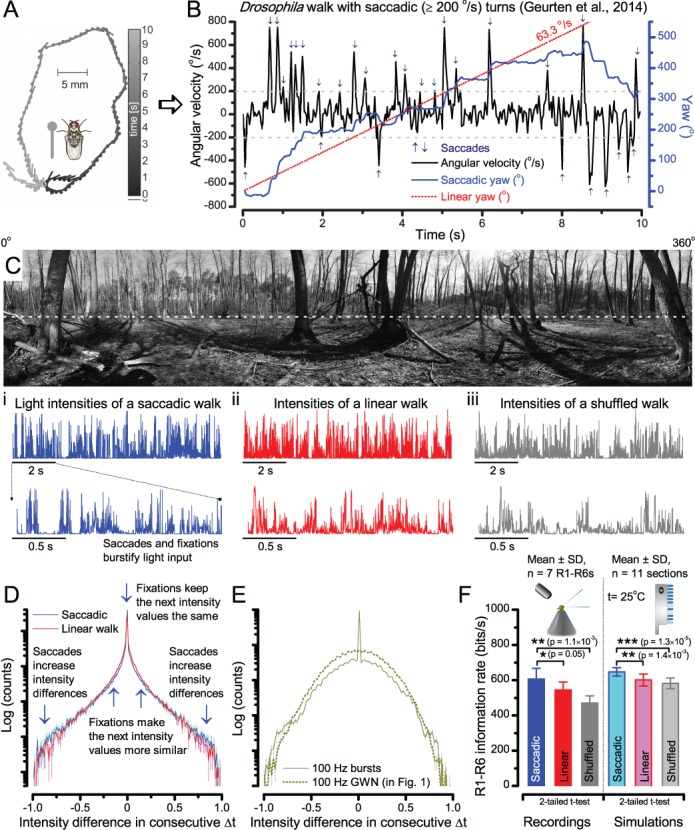
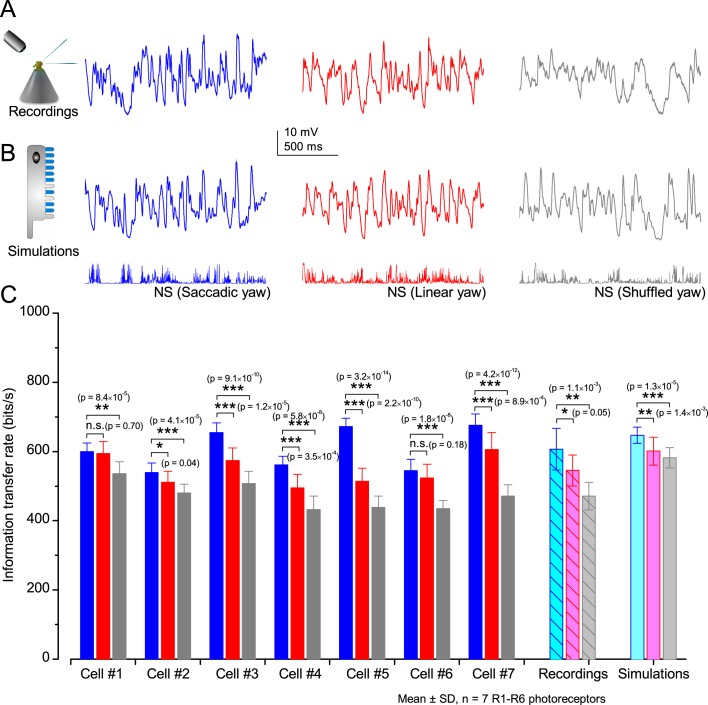
Figure 6. A Drosophila’s saccadic turns and fixation periods generate bursty high-contrast time series from natural scenes, which enable R1-R6 photoreceptors (even when decoupled from visual selection) to extract information more efficiently than what they could by linear or shuffled viewing.
(A) A prototypical walking trajectory recoded by Geurten et al. (2014) (B) Angular velocity and yaw of this walk. Arrows indicate saccades (velocity ≥ |±200| o/s). (C) A 360o natural scene used for generating light intensity time series: (i). ) by translating the walking fly’s yaw (A–B) dynamics on it (blue trace), and (ii) by this walk’s median (linear: 63.3 o/s, red) and (iii) shuffled velocities. Dotted white line indicates the intensity plane used for the walk. Brief saccades and longer fixation periods ‘burstify’ light input. (D) This increases sparseness, as explained by comparing its intensity difference (first derivative) histogram (blue) to that of the linear walk (red). The saccadic and linear walk histograms for the tested images (Appendix 3; six panoramas each with 15 line-scans) differed significantly: Peaksac = 4478.66 ± 1424.55 vs Peaklin = 3379.98 ± 1753.44 counts (mean ± SD, p=1.4195 × 10⁻³², pair-wise t-test). Kurtosissac = 48.22 ± 99.80 vs Kurtosislin = 30.25 ± 37.85 (mean ± SD, p=0.01861, pair-wise t-test). (E) Bursty stimuli (in Figure 1, continuous) had sparse intensity difference histograms, while GWN (dotted) did not. (F) Saccadic viewing improves R1-R6s’ information transmission, suggesting that it evolved with refractory photon sampling to maximize information capture from natural scenes. Details in Appendix 3.


