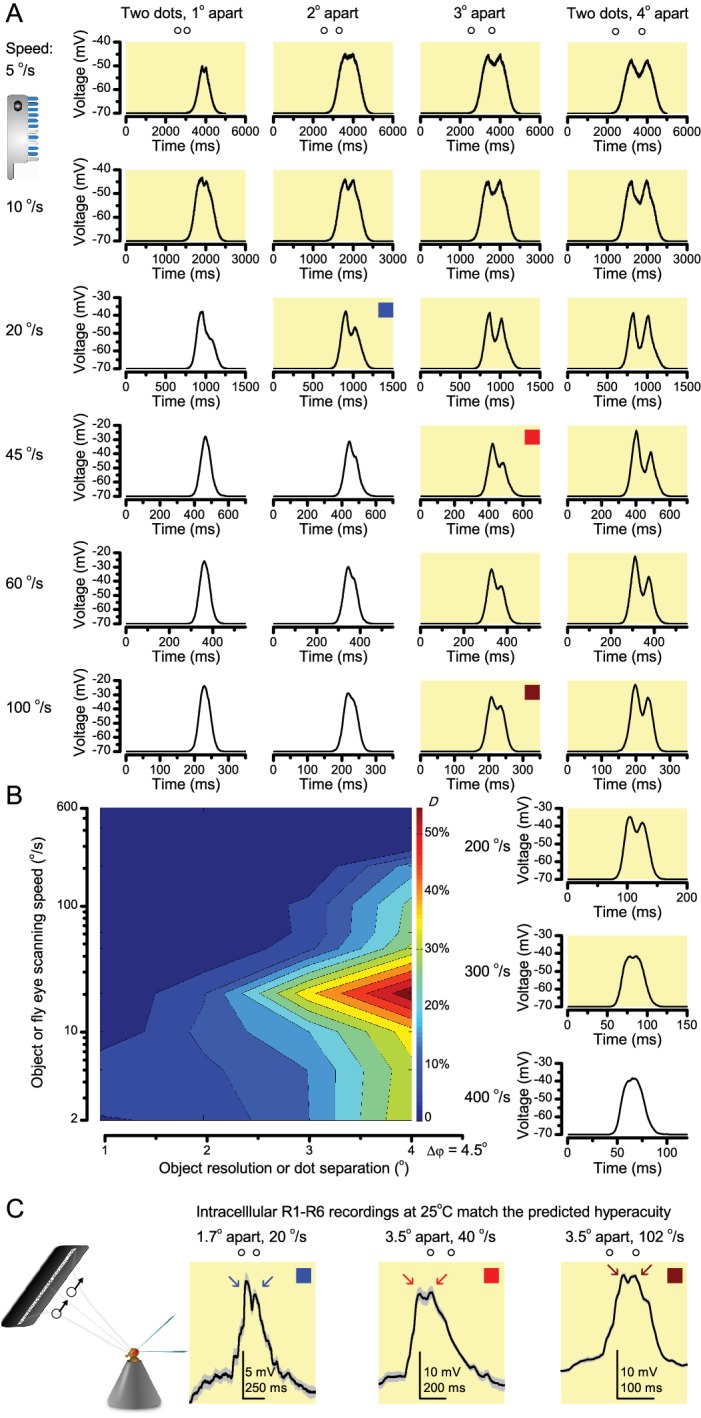
Figure 9. ‘Microsaccadic sampling’ hypothesis predicts visual hyperacuity.
(A) Simulated R1-R6 output to two dots, at different distances apart, crossing the photoreceptor’s receptive field at different speeds. The yellow backgrounds indicate those inter-dot-distances and speeds, which evoked two-peaked responses. The prediction is that the real R1-R6s could resolve (and Drosophila distinguish) these dots as two separate objects, whereas those on the white backgrounds would be seen as one object. The simulations were generated with our biophysically realistic R1-R6 model (Song et al., 2012; Song and Juusola, 2014; Juusola et al., 2015), which now included the estimated light input modulation by photomechanical rhabdomere movements (Figure 8H). (B) The resulting object resolution/speed heat-map, using the Raleigh criterion, D (Figure 7C), shows the stimulus/behavioral speed regime where Drosophila should have hyperacute vision. Thus, by adjusting its behavior (from gaze fixation to saccadic turns) to changing surroundings, Drosophila should see the world better than its compound eye’s optical resolution. (C) Intracellular R1-R6 responses resolved the two dots, which were less that the interommatidial angle (Δφ = 4.5o) apart when these crossed the cell’s receptive field at the predicted speed range. Arrows indicate the two response peaks corresponding to the dot separation. Cf. Figure 9—figure supplement 1; details in Appendixes 7–8. These results reveal remarkable temporal acuity, which could be used by downstream neurons (Zheng et al., 2006; Joesch et al., 2010; Behnia et al., 2014; Yang et al., 2016) for spatial discrimination between a single passing object from two passing objects.

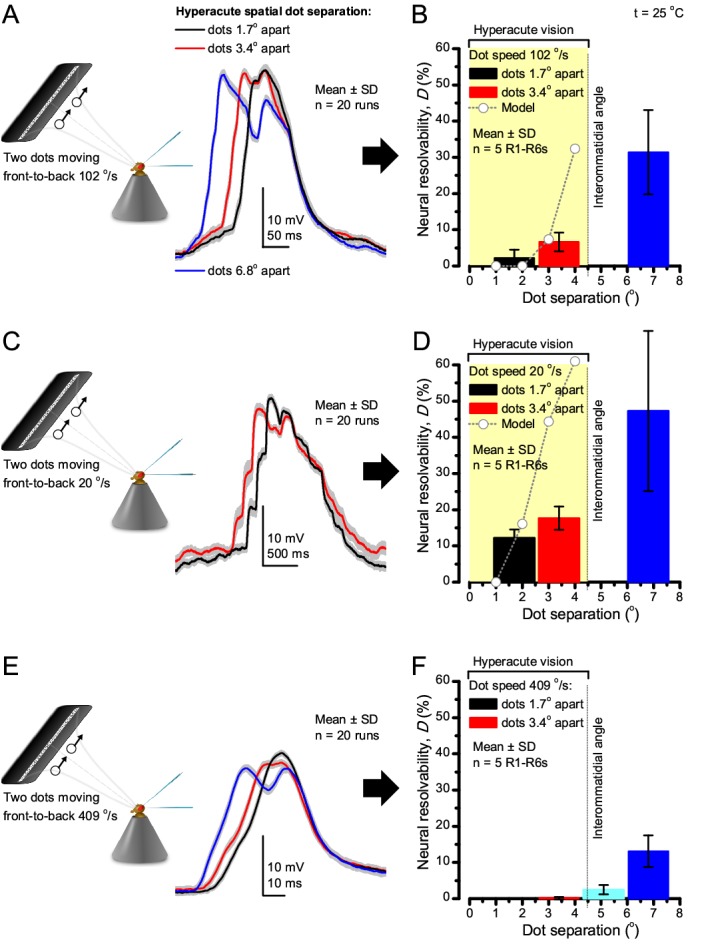
Figure 9—figure supplement 1. Encoding space in time - intracellular R1-R6 recordings to two bright dots crossing the receptive field show how their responses convey hyperacute spatial information in time.

