Abstract
We present Brain Modulyzer, an interactive visual exploration tool for functional magnetic resonance imaging (fMRI) brain scans, aimed at analyzing the correlation between different brain regions when resting or when performing mental tasks. Brain Modulyzer combines multiple coordinated views—such as heat maps, node link diagrams and anatomical views—using brushing and linking to provide an anatomical context for brain connectivity data. Integrating methods from graph theory and analysis, e.g., community detection and derived graph measures, makes it possible to explore the modular and hierarchical organization of functional brain networks. Providing immediate feedback by displaying analysis results instantaneously while changing parameters gives neuroscientists a powerful means to comprehend complex brain structure more effectively and efficiently and supports forming hypotheses that can then be validated via statistical analysis. To demonstrate the utility of our tool, we present two case studies—exploring progressive supranuclear palsy, as well as memory encoding and retrieval.
Index Terms: Linked Views, Neuroinformatics, Brain Imaging, Functional Magnetic Resonance Imaging (fMRI), Graph Visualization
1 Introduction
Understanding the large-scale connectivity of the human brain is crucial to comprehending the brain’s overall cognitive functioning. Connectivity in the human brain encompasses multiple spatial scales, ranging from individual neurons to entire brain regions and systems. When studying large-scale brain organization, neuroscientists often focus on high-level activity patterns of these spatially distinct brain regions through non-invasive recording procedures, such as functional Magnetic Resonance Imaging (fMRI). The correlation of activity between regions yields a measure of functional connectivity between regions, providing essential information about how neurons and neural networks process information.
Neuroscience has established the existence of a relatively small number of intrinsic networks, containing sets of brain regions, also known as communities, that are densely connected within themselves and sparsely connected to each other. These networks underlie specific processes such as lower- and higher-order vision, hearing, sensory-motor processing and spatial processing [1], [2]. Graph-theoretic techniques, such as community detection [3], can identify these intrinsically connected networks. Furthermore, the modular structure of the brain is hierarchically organized. The study of these hierarchical modules has revealed specialized cognitive sub-modules within larger communities. These sub-modules dynamically change their coupling with each other based on the cognitive process that the brain engages in.
Studying the hierarchical and modular properties of brain networks can provide answers to questions such as how brain networks vary across subjects, how the networks change when subjects age [4], [5], and how networks differ under different pshychological and neurological disorders [6], [7], [8], [9], [10]. Although such analysis typically uses statistical models [11], graph theoretic methods and visualization systems provide a means to explore and communicate unforeseen connectivity patterns in the data [12]. Toolkits that support interactive in-depth exploration of organizational properties of brain networks and portray them in their spatial context are currently still lacking.
Existing visualization methods for functional connectivity are primarily designed to communicate scientific findings, not comprehensively supporting exploration of connectivity data. Moreover, existing tools do not run analyses interactively for various parameter combinations and provide immediate visual feedback about the modular structure of brain networks at various hierarchical levels. Such a feedback would will allow scientists to formulate or reject hypotheses early in the analysis process.
Brain Modulyzer (Fig. 1) solves this challenge and facilitates a thorough understanding of the connectivity data by integrating multiple coordinated views to introduce novel interaction techniques that explore the hierarchical and modular properties of functional brain networks. The methods and visualization system described in this paper are the result of a close collaboration involving neuroscientists and computer scientists, driven by the need to build such a tool. Specifically, our system supports (i) abstract views—show connectivity information (Figs. 1A, 1C) and analysis results (Figs. 1D, 1E, 1F), enabling quick identification of patterns of interest; (ii) anatomical views—relate this information to the anatomy (Fig. 1B); and (iii) community analysis— compute and identify modules (Figs. 1D, 1E), their hierarchical structure (Fig. 1F) and graph theoretic measures, all collectively providing overall insight into the topology of the brain network.
Fig. 1.
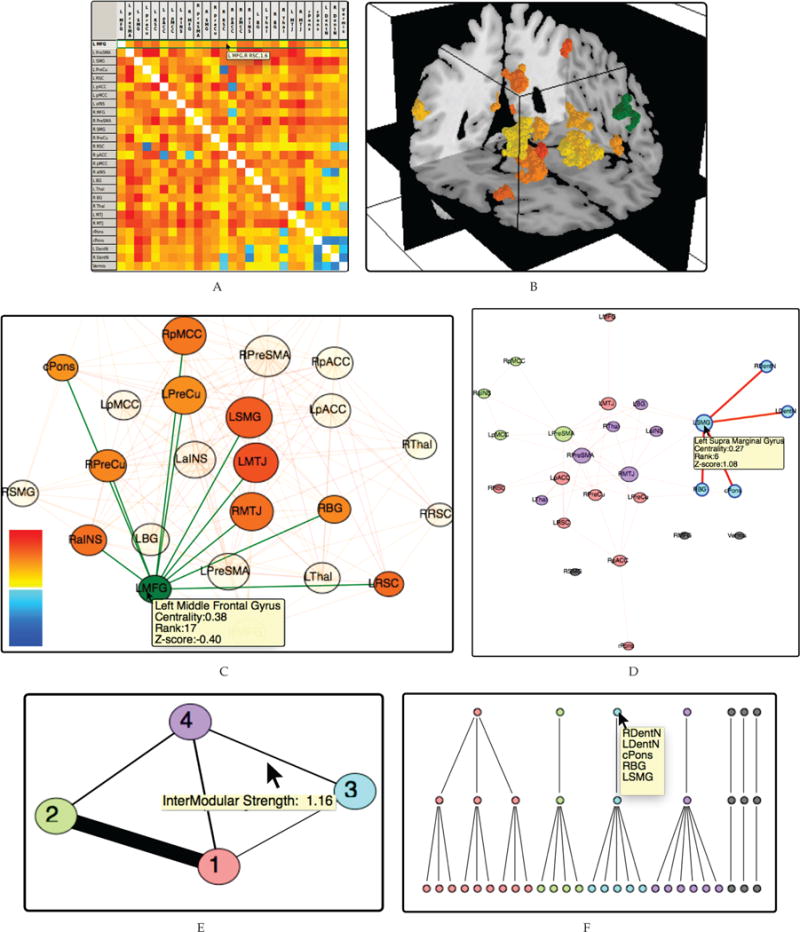
Our system links multiple views showing different data aspects to allow neuroscientists to investigate modular and hierarchical organisation of brain networks. A) Heat maps show the pairwise correlation matrix between parcellated regions. B) Selecting a region of interest—colored green in the figure—and coloring all other parcellated regions based on their correlation shows connectivity in relation to anatomy. C) Node-link diagrams—considering only connections above a threshold—show connectivity. D) Integrating community detection and coloring nodes according to the community memberships highlights groups of brain regions with strong internal connectivity. E) The community graph provides a high-level overview over communities in Fig. 1B by representing them as nodes. F) Dendrograms represent the hierarchical organization of the modules.
This paper makes the following contributions:
We employ overview+focus+detail visualizations of the modular structure and hierarchical organization of brain networks. These visualizations explicitly show inter- and intra-modular connectivity relationships.
We provide methods that dynamically compute various topological properties of brain networks such as graph statistics, community structure and its associated hierarchy, all based on a user-specified connection strength threshold.
We introduce an integrated system that uses the concept of brushing and linking to combine multiple views highlighting different data aspects and develop novel interaction techniques to explore functional brain connectivity.
We present two case studies that demonstrate the usefulness of our visualization tool.
2 Background
2.1 Functional Connectivity
Resting state fMRI captures intrinsic brain connectivity when the brain is not performing any task [18]. With such data, neuroscientists are especially interested in developing a better understanding of the impact of diseases on brain networks. For example, scientists can better characterize the effect of diseases on the cognitive abilities of the human brain based on changes reflected in rs-fMRI network data of the subjects involved.
Brain connectivity based on fMRI analysis is defined in terms of correlation matrices where each matrix entry ci,j encodes the statistical similarity between the time courses of parcellated brain regions i and j. Other imaging modalities used to study connectivity include diffusion tensor imaging (DTI) that map the anatomy of the white matter tracts non-invasively.
2.2 Modularity Analysis in Functional Brain Networks
Modularity in complex networks measures the division of a network into sets of modules where each module possesses dense internal or intra-modular connectivity and sparse external or inter-modular connectivtity [19]. Large complex systems like brain networks exhibit modular organization [4] and have a hierarchical network structure at multiple scales [20], [21]. This property of the brain ensures that the network is robust, adaptable and able to evolve [20].
Analysis of modular organization of brain networks typically aims at answering high-level questions such as [22]:
How diverse are inter—modular connections?
How does one module specialized in performing a certain task interact with other modules?
What nodes in a module are responsible for global inter-modular integration?
Exploring and ultimately answering these questions requires techniques that dynamically explore both inter-modular, and intra-modular connectivity data.
Visualizations showing the modular organization at varying levels are helpful to neuroscientists for gaining insights into the topology of the brain network, which allows them to come to qualitative conclusions about the data. For example, when analyzing the properties of brain networks of diseased subjects diagnosed with schizophrenia, the subjects exhibited a significantly reduced hierarchy which might indicate that their brain networks were less efficiently wired [23].
3 Related Work
We provide a brief review of visualization methods in three domains: visual analysis in functional brain networks, visualizations in hierarchical modular structures, and visualization of communities in functional brain networks.
3.1 Visual Analysis Tools in Functional Brain Networks
Functional connectivity data can be visualized as heat map—coloring each matrix cell ci,j (See Section 2.1) based on a connection strength or as a node link diagram where nodes represent brain regions and edges represent matrix entries ci,j. The edge between nodes i and j encodes the connection strength entry ci,j.
To visualize this data, prior work mainly used two common layout techniques, i.e., spatial and non-spatial layout principles. Spatial data layout techniques take into account the anatomy of the brain regions while non-spatial techniques do not.
Abstract, non-spatial visualization techniques include spring embedding graphs, matrix bitmaps and scatter plots [24]. Fair et al. [25] and Deshpande et al. [26] used spring-embedding algorithms to visualize the brain network as 2D node-link diagrams. An alternative approach to visualizing this non-spatial data is to view directly the correlation matrix [27], [28], [29], [30].
Three-dimensional (3D) node-link diagrams [31], [32], [33] that place the nodes at the spatial coordinates of the anatomical view address this shortcoming. Tools that utilize anatomical 3D spatial information, include the CoCoMac Paxinos 3D viewer [32], BrainNet Viewer [15] (Fig. 2D), Brain Voyager QX d [34], and Visual Analysis Tool by Li et al. [13] (Fig. 2A). Although visualizing functional connectivity data as 3D node-link diagrams allows neuroscientists to inspect visually the structural patterns in the brain, they lead to cluttered and occluded visualizations. One way to overcome such clutter and occlusion is to filter edges based on the connection strength threshold [31]. Adopting a 2D anatomical layout whose nodes are projections on 2D planes (based on two anatomical axes) also reduces this clutter to some extent [30].
Fig. 2.
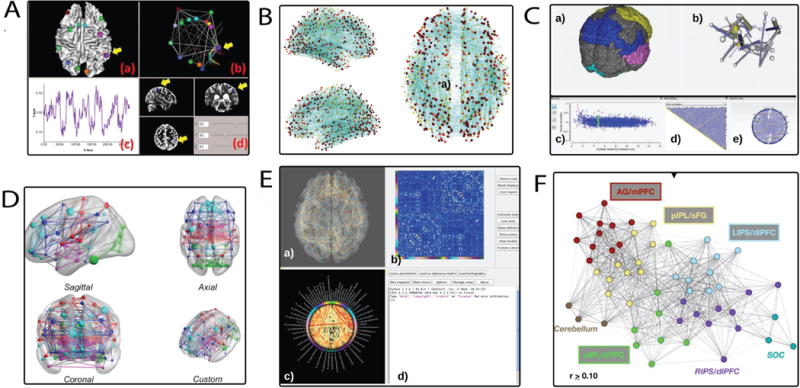
Typical analysis and visualization methods used for fMRI connectivity data. A) The visual analysis tool by Li et al. [13] shows fMRI/DTI data as a 3D node-link diagram linked with an anatomical view. B) The connectome viewer toolkit [14] embeds a 3D node-link diagram in the anatomical view, the nodes are located at the centroid of their brain region parcellation. C) The Functional Brain Connectvity tool visualizes functional fMRI data in these views: a) anatomical view, b) anatomical network, c) scatterplot, d) matrix bitmap, e) hierarchical edge bundling view D) The BrainNet Viewer [15] visualizes 3D node-link diagrams where the nodes are scaled by nodal strengths E) The Connectome Visualization Utility(CVU) [16] visualizes connectivity information in three different modalities (MEG, fMRI and DTI) through linked views, a) Anatomical View, b) Matrix Views, c) Circle View F) Nelson et al. [17], defined regions based on modularity assignments. The 2D node-link diagram represents modularity assignments based on the color of each node
Spatial representations help neuroscientists orient themselves with respect to the brain regions while 2D non-spatial graph layouts provide the necessary flexibility for visualizing modifications to the connectivity data [12]. Combining both representations enables scientists to seamlessly investigate whether network topology interacts with the spatial domain of the data, providing the ability to draw more detailed conclusions. The Functional Brain Connectivity Explorer [35] (Fig. 2C) was among the first published tools combining the strengths of non-spatial and spatial visualization techniques. Other papers concerned with visual analysis of brain connectivity data include that by Akers et al. [36], Bruckner et al. [37], Beyer et al. [38], Jianu et al. [39], Whitfield et al. [40], Ribeiro et al. [41] and Brown et al. [42] (See also Figure 2). However, there is still a need for additional visualization techniques that can help neuroscientists answer more in-depth questions and perform more specific analysis of modular structures of functional brain connectivity data.
3.2 Visualization of Hierarchical Modular Structures
Early work in visualizing communities [43] by Heer et al. [44] paved the path for automatically computing and visualizing communities. Later, research by Corinna et al. [45] sought to solve the problem of visualizing overlapping communities. However, these published approaches do not focus on visualizing modular structures at multiple levels. To address this problem, Herman et al. [46] described various techniques to visualize hierarchical modular structures. These techniques include tree-map [47], cone-tree [48] and information cube [49]. Another technique, presented in the ASK-Graph-View [50] solves the problem of visualizing hierarchical structures by juxtaposing an interactive visualization of a hierarchical tree with a graph and a matrix view. However, this tool only visualizes user-selected clusters from the hierarchical tree, hiding the overall connectivity information between sub-clusters. Such visualizations make the analysis of interrelationships between sub-clusters difficult. Analyzing these interrelationships is of importance to interpreting overall topology of the modular structure of hierarchical networks [20]. Summary graph [51], community matrix visualizations [52], and dendrograms [53] provide the foundation for visualizing hierarchical modular organizations of the functional brain networks. In our work, we expand on the aforementioned visual analysis techniques for visualizing hierarchical modular data specifically in the domain of functional brain connectivity data.
Our research builds on these methods and expands their capabilities by emphasizing the visualization of hierarchically organized modular data.
3.3 Visualization of Modular Structures Based on Functional Brain Connectivity
Little progress has been made concerning the interactive visualization of the modular and hierarchical organization of brain networks. The Connectome Visualization Utility (CVU) [16] (Fig. 2E) is a tool used for exploring the modular structure of brain networks. However, CVU is limited to identifying and visualizing modular structures at a single scale/level. Furthermore, the visualization features of this tool do not provide an overview of the communities or relationships between them.
Current systems typically suffer from information overload, occlusion, or lack of overview visualization. Information overload occurs when views provide few insights because of the overwhelming number of visual elements. Occlusion results when visualizations contain a large number of elements that overlap with each other, inhibiting the comprehension of the data. Not providing an overview of the data inhibits overall data comprehension as it only captures the relationship of an individual brain region/node while not providing the global context.
We address these problems and improve the current technology by supporting these capabilities: (i) juxtaposed visualization views in a detail+overview style; (ii) easy-to-use navigational and explorational techniques that support analysis of intra-modular, inter-modular or both types of connectivity information; (iii) concurrent access to all the representations of the same data by linked views; (iv) easy manageability of modular and hierarchical information through the inclusion of a network measure table.
4 Overall Approach
To support the two complimentary tasks of exploring connectivity between brain regions and answering questions based on their modular structure (Section 2), Brain Modulyzer supports two analysis modes: correlation mode and community mode (Fig. 3). The correlation mode focuses on direct visualization of the correlation matrix, showing correlation strength between individual brain region and putting this information in an anatomical context. The community mode displays the results of analyzing the modular and hierarchical properties of brain networks. Switching between the two modes provides in-depth insight into brain connectivity and the modular structure arising from it in its anatomical context, making it possible to formulate new hypotheses that can subsequently be verified by offline statistical analysis.
Fig. 3.
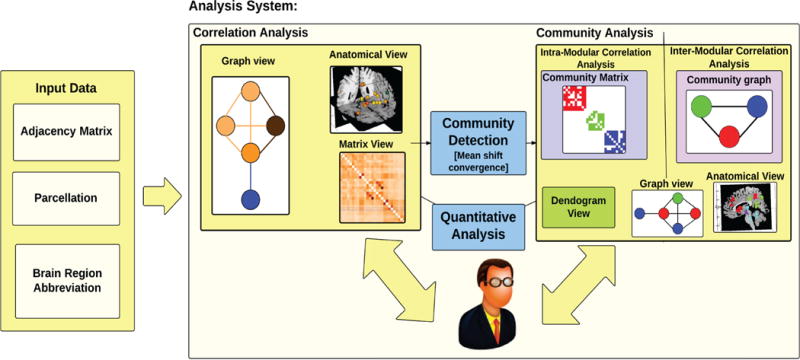
Our system uses the connectivity matrix and its associated parcellation as input. The system operates in two modes—correlation mode and community mode. Correlation mode focuses on analysis of correlation network data, and the Community mode supports modular analysis.
4.1 Anatomical Views
To understand functional connectivity between brain regions, neuroscientists need to determine how it relates to the anatomy. For example, it is often important to know whether two functionally correlated regions are also anatomically close or how detected communities are distributed over the brain. Anatomical views in Brain Modulyzer provide this information by coloring brain regions either based on their correlation strength to a selected region—in correlation mode—or based on their community membership—in community mode—to effectively combine connectivity information with the anatomy.
The Brain parcellation view provides a comprehensible overall picture of the brain by visualizing parcellated regions of interest in their anatomical context. Each brain region is displayed as a set of contiguous voxels comprising it (Fig. 4A).
Parcel centroid view: Visualizing brain regions as voxels often suffers from from occlusion and visual clutter. The parcel centroid view addresses this issue by displaying just a sphere at the centroid of each brain region using the same color scheme as the brain parcellation view (Fig. 4C).
Slice views: Parcellated brain region are often sparse and fill only a small portion of the volume. As a consequence, it is difficult to identify their exact location in the brain. The slice views (Fig. 4B) display structural data from an MRI scan, providing the spatial cues necessary to locate the parcellated regions. Users can qualitatively assess the anatomical locations of the brain regions within the three complimentary planes: sagittal, coronal and axial. The view displays grayscale images of the MRI scan (registered with the parcellation volume) to provide the 2D spatial context of the 3D volume view.
Fig. 4.
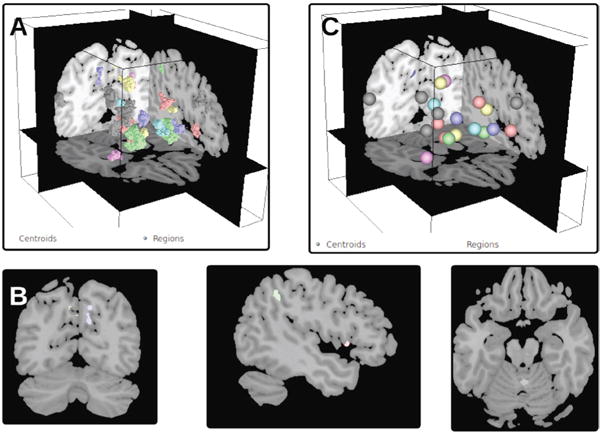
Results of community detection with respect to anatomy. Each community is represented by a distinct color, and each region is colored according to its community membership. Parcellated brain regions can be shown as outlines in Fig. 4A or centroid depiction via a sphere Fig. 4C.
To provide additional anatomical context for the 3D views (brain parcellation view and parcel centroid view), our tool displays a semi-transparent contextual isosurface representing the brain surface in the 3D views.
4.2 Abstract Views
The abstract views support identifying, exploring, and analyzing patterns of interest underlying the correlation data. By removing the anatomical constraints on the visualizations, the 2D non-spatial abstract views with flexible layouts convey changes in connectivity in an explicit way.
The matrix view supports quickly assessing connectivity trends across the entire data set [54], [55], [56]. The view provides users with information about general correlation or relationships between brain regions. Each matrix entry ci,j is color-coded according to the correlation strength between the i-th brain region and j-th brain region. As the data is symmetric, the ci,j value is equal to the cj,i value.
The Graph view allows users to easily identify topological patterns of interest and perform qualitative graph theoretical analysis. The view shows the brain network encoded in the functional connectivity data matrix as a node-link diagram. Nodes depict brain regions, and edges indicate the (pairwise) correlation strength between the nodes.
The following capabilities support performing high-level brain analysis tasks with our tool:
Node coloring: Often neuroscientists are interested in a node and its correlation with the other nodes to investigate its topological role in the network. Our tool allows users to dynamically select brain regions and explicitly highlight their edge strengths with respect to other nodes in the graph. The changes are highlighted by coloring the nodes and the edges in the graph view according to their correlation data values.
Thresholding: Visualizing all the information provided in the matrix produces a complete graph, e.g., the 27 region graph in Fig. 1C, would have 576 edges. Such a graph suffers from clutter and overdraw, inhibiting users to perform any meaningful qualitative analysis. Brain Modulyzer supports filtering connectivity data based on a specific threshold value to remove clutter-causing edges in the graph. This feature allows users to selectively focus on the strongest connections between brain regions.
Dynamic layout change: Different graph layouts possess varying degrees of user preference and aesthetics, highlighting different properties of network data. Circular-layouts, for e.g., focus on neutrality [57], i.e., displaying all the nodes equidistant from each other, allowing users to better focus on connections rather than its underlying topology. Brain Modulyzer supports the most widely used graph layout algorithms used by neuroscientists, including the neato graph layout [58], force-directed-layout [59], and circular or shell layouts [60].
Annotations: To provide in-depth details of regions of interest, all of the linked views provide interactive tooltips that convey useful quantitative information about network measures, correlation strength and the abbreviation of the region selected.
4.3 Community Detection and Visualization
The community detection mode in our tool facilitates the exploration of the modular property of brain networks. Community detection is performed on the data to identify and explore modules and its hierarchies. We apply community detection, e.g., Louvain’s method [3], to detect communities from the input correlation data and assign colors with a maximum perceptive distance [61] to each of these communities.
To enable real-time interaction with the user, the tool detects and renders communities dynamically when the threshold for the connections changes. The following abstract views support community mode:
-
The community matrix supports detailed analysis of outlier connections or connectivity trends within each module. This view (Fig. 5) shows intra-modular connections by coloring a cell cij based on its community membership. The data is only visualized if it corresponds to a connection within a community and has a connection strength above a given threshold. To allow easy extraction of connectivity trends within modules, rows and columns of the matrix are contiguously sorted [62] such that colored cells are squeezed along the diagonal of the matrix view.
A larger number of colored cells in the community matrix view indicate strong intra-modular connections. For example, out of the twelve identified communities shown in Fig. 5, only six are connected internally, i.e., have edges within the module. As the other seven communities are single region communities, they do not possess any colored cells in the community matrix view.
-
The community graph provides an overview of the entire community structure of the brain network, enabling users for easy identification of inter-modular connectivity patterns. This view supports a high-level investigation of modules that are highly correlated or anti-correlated with each other.
Nodes in the community graph (Fig. 7A) represent individual communities and the edges thickness depict inter-modular correlation. The inter-modular correlation strength between two communities A and B is computed as the mean strength of all edges that start from nodes in community A and end at nodes in community B.
To support visual correlation between community graph view and graph view, we ensure that the modules are placed consistently in both views. Community nodes are placed at the average node coordinates of all the nodes in the original graph layout (Fig. 7A and 7C) comprising their community.
Fig. 5.
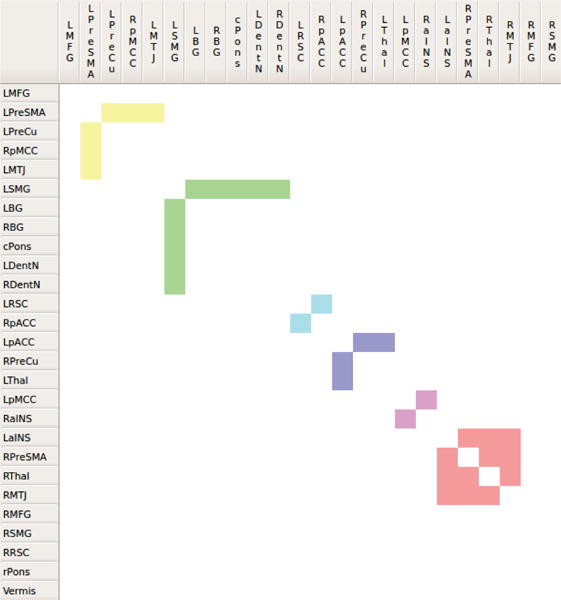
The matrix view shows twelve communities identified by the modularity optimization algorithm (Fig. 7). Six of the twelve communities are connected internally. Color coded cells of the matrix view represent intra-modular connections.
Fig. 7.
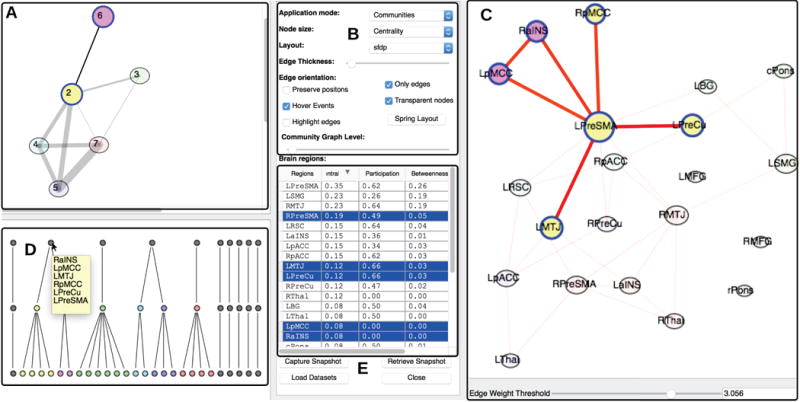
A) The community graph highlights the subcommunities associated with the community selected in the dendrogram view. B) Configuration options provide various choices for interactivity, such as toggling hovering/clicking, choosing graph layout and varying the opacity of highlighted nodes. C) The brain region graph displays highlighted nodes associated with selected sub communities. D) (While the dataset is same as Fig. 1F, the threshold value for this visualization view is different)
The dendrogram view displays the hierarchy of communities. The communities that do that not have any edges emanating from them are grayed out. E) A table view lists important graph properties of the graph shown in Fig. 7C.
The anatomical views color parcellated brain regions according to the communities identified in the corresponding abstract views. This coloring provides an anatomical context for the detected communities, allowing users to quickly investigate whether anatomically close regions are also members of the same community.
4.4 Dendrogram View
Common hierarchical brain analysis tasks often require qualitative analysis of correlation information of sub-communities. The dendogram view not only supports interactive exploration and analysis of modular information at varying levels of hierarchy but also allows the investigation of the structure of the modular hierarchy itself.
The Louvain method [3] outputs a hierarchy of modules that we visualize in the form of a dendrogram. Nodes in the lowest level of the hierarchy denote individual brain regions while the nodes in the highest level denote the resulting communities. The nodes that are neither of these denote sub-communities.
We construct the dendrograms (Fig. 6) in our system as follows: given the hierarchical modular information, we maintain a tree-like data structure that maps nodes in the dendrogram view to the nodes in the graph view. We visualize the cluster data using a layout that places the nodes in hierarchical order, i.e., it places nodes in the same hierarchy level at the same height starting with leaf nodes at the bottom and community nodes at the top. Changing the threshold for community analysis interactively results in an updated dendrogram view. The highly interactive features of the dendrogram view are what makes the view a significant feature for the modular analysis. For simplicity, we assume that the modularity-optimization algorithm provides us with three levels of hierarchy, i.e., higher-level communities, mid-level sub-communities and lower-level brain regions.
Fig. 6.
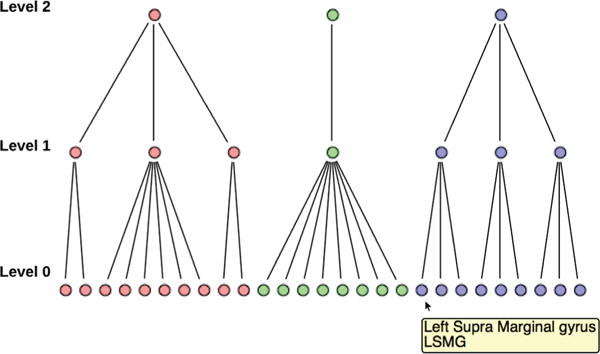
The Dendrogram view showing the hierarchical modular information of a community corresponding to threshold value 3.309. Level 1 of the dendrogram represents sub-communities formed when optimizing modularity locally with the nodes in level 0; level 2 nodes represent the final community emerging from the sub-communities identified in level 1.
The leaf nodes and subcommunity nodes of the dendrogram view are color-coded according to their community/sub-community membership. All of the nodes in the dendrogram view are ordered based on the hierarchical structure of the data.
In order to provide an overview of interactions between sub-communities, the tool allows the user to pick a level in the dendrogram hierarchy and investigate how communities merge or split across the hierarchy. For example, in Fig. 7A, the community graph visualizes sub-communities formed by the modularity optimization algorithm at level 1. Highlighted sub-communities colored in yellow and pink later merge into one community in the next stage of the hierarchy.
4.5 Network Measure Table
Measures used in graph theory often convey useful information about connectivity profiles of individual brain regions [22], [63], [64]. The graph theoretic measures that we utilize in our tool include:
Degree centrality: This measure captures the fraction of nodes a node is connected to [65]. A high value indicates that a node is a local hub that integrates information from its neighbors.
Participation coefficient: This measure reflects the distribution of links of a node with all the modules in the network [66]. A high value indicates that a node acts as a bridge between modules.
Betweenness Centrality: This measure is the sum of the fraction of the shortest paths from all vertices to all others that pass through a node [67], [68]. A high value characterizes nodes that enable rapid distribution of information from one part of a network to another part.
Within-module degree z-score: This measure represents the connectedness of a node to other nodes in the same module [22]. A high value indicates that the node is a provincial hub within its module.
We present these measures in a table showing one row per brain region, supporting the identification of anomalies or patterns in brain networks. Tooltips provide additional information regarding Z-score values and the relative rank of the measure that is selected. A user can sort the table using any network measure by selecting the table headers.
The table shown in Fig. 7E provides statistics for communities identified for the threshold value 3.056, sorted by descending centrality. Additionally, one can examine the measures of brain regions that belong to a selected community in the dendrogram view. For example, the brain region RPreSMA has a centrality value of 0.19 and is ranked fourth based on the sorting criteria. One can deduce that the node has a relatively average participation index of value 0.49 and a low betweenness value.
Visualizing Graph Measures as Graph Properties
To convey qualitative patterns that are not so obvious when presenting network statistics alone, our tool maps visually maps network statistics to graph properties. Fig. 7C, uses node size (a graph property) to represent centrality (a network measure), where larger node sizes indicate higher centrality.
4.6 Linking and Interactivity
All views are coordinated and linked together with a rich set of interactions enabling the users to gain multi-level insights for community analysis. Interactivity combined with various linking features in our tool allow the user to perform in-depth exploration of modules/brain regions of interest across the modular hierarchy.
Users can select a brain region of interest in a particular view of interest and explore its representations in all the other views. For example in Fig. 7D, the user selects a community in the dendrogram view and can simultaneously examine its representation network measure table, overview graph, and community graph view.
Brain Modulyzer supports three types of linking features to analyze hierarchical relationships, these include:
Leaf-node to brain region linking: Selecting leaf-nodes in the dendrogram view highlight all the corresponding brain regions and the connections belonging to the selected community in all visualization views.
Sub-community nodes to brain regions linking: Selecting a sub-community node (e.g., in level 1), highlights not only the corresponding brain regions that belong to the selected sub-community but also the edges within the sub-community.
Community nodes to brain regions linking: Picking a community node (e.g., in level 2) in the dendrogram view highlights all the associated sub-communities. Highlighting a sub-community is similar to the sub-community nodes to brain regions linking mechanism.
For the exploration of modular properties of the brain networks, the interactive features include: (i) inter-modular highlighting for between-module connections (Figure 7A), (ii) intra-modular highlighting for within-module connections (yellow or blue community in Figure 7C, Figure 5). Other interactive features include specifying the connection strength threshold to filter edges in the connection graph, see Fig. 7C, de-cluttering the connection graph, dynamically recalculating the graph structure, graph-theoretical metrics, and hierarchy of communities. Changing the connection strength threshold re-orders the headers of the community matrix and the leaves of the dendrogram such that community relationships of entities are reflected by the placement of their corresponding graphical primitives.
4.7 Focussing on Data Subsets
Our experience with tool showed that when analyzing larger data sets, the matrix cells and the headers are no longer appropriate for visually capturing all the salient information of interest. In particular, to present a matrix view with a large number of rows/columns., it becomes necessary to omit row and column headers. While tool tips can provide information as to which pair of regions corresponds to a correlation value, this process becomes tedious for larger subregions. To support these use cases, our tool displays a subset of the data, i.e., a block of selected matrix elements, in another view. Restricting the matrix to a subset makes it possible to display row and column headers for orientation. The matrix elements to be displayed in the magnifier window can be based on any number of elements in the matrix views.
5 Results
Our team constitutes experts from visualization as well as neuroscience groups, all of which contributed to the design of the tool. The main research questions of our case studies were: What insights did the neuroscientists gain from using such a tool? How does the interplay of standard visualization techniques help them arrive at the hypotheses?
The tool has helped the domain experts gebnerate new hypotheses and research ideas to analyze neurodegenerative diseases such as Progressive Supranuclear Palsy and tasks based on memory encoding and retrieval. We describe the data acquisition process as well as the scientific insights gained through the use of our tool by the domain experts.
5.1 Case Study 1: Progressive Supranuclear Palsy
Progressive supranuclear palsy (PSP) is a neurodegenerative disease that typically begins around the age of 60 and causes restricted vertical eye movement, balance impairment, axial muscle rigidity, and cognitive-behavioral deficits. Patients demonstrate atrophy of particular brain structures including the midbrain, cerebellum, thalamus, basal ganglia, and portions of the prefrontal cortex. The disease course is rapid and there is no available cure [69]. Previous work has identified functional connectivity reductions in a network anchored by the rostral mesothalamic junction (MTJ), connecting to an array of regions which contribute to diverse functions including oculomotor control, skeletomotor control, and social/emotional processing [70]. In this study, 18 patients with PSP and 36 age-matched healthy control (HC) subjects received task-free (resting state) fMRI scans. A total of 27 specific regions of interest comprising this network were used to calculate the pairwise functional connectivity of all regions and define a 27 × 27 covariance matrix for each subject. To summarize the network connectivity patterns in patients with PSP and healthy controls, we calculated the average connectivity matrices for the 36 controls and 18 patients.
As reported by Gardner et al. [70], the mesothalamic junction (MTJ) is an epicenter of PSP disease-related pathology, structural atrophy, and functional connectivity disruption. In that study, the MTJ node exhibited significantly reduced total flow, a graph theory measure similar to the nodal degree. In this study, we visualized the connectivity of this node with other nodes in the MTJ network using the Brain Modulyzer. As can be seen in Fig. 8, the right MTJ node in control subjects (Fig. 8C; blue lines emanating from selected node) shows higher connectivity to neighboring nodes than it does in PSP patients (Fig. 8D). Furthermore, the graph view (color-coded with communities) shows the left and right MTJ fragmented as an isolated community in PSP patients (Fig. 8D, right column, purple nodes). This isolation can be simultaneously recognized in the matrix view (Fig. 8A, right column) and the anatomical location of these nodes can be seen in the anatomical view (Fig. 8B, right). Finally, the graph view (color-coded with communities) illustrates the significant isolation that exists between each community of nodes in PSP patients. Our previous work had shown that connectivity was globally reduced in this network.
Fig. 8.
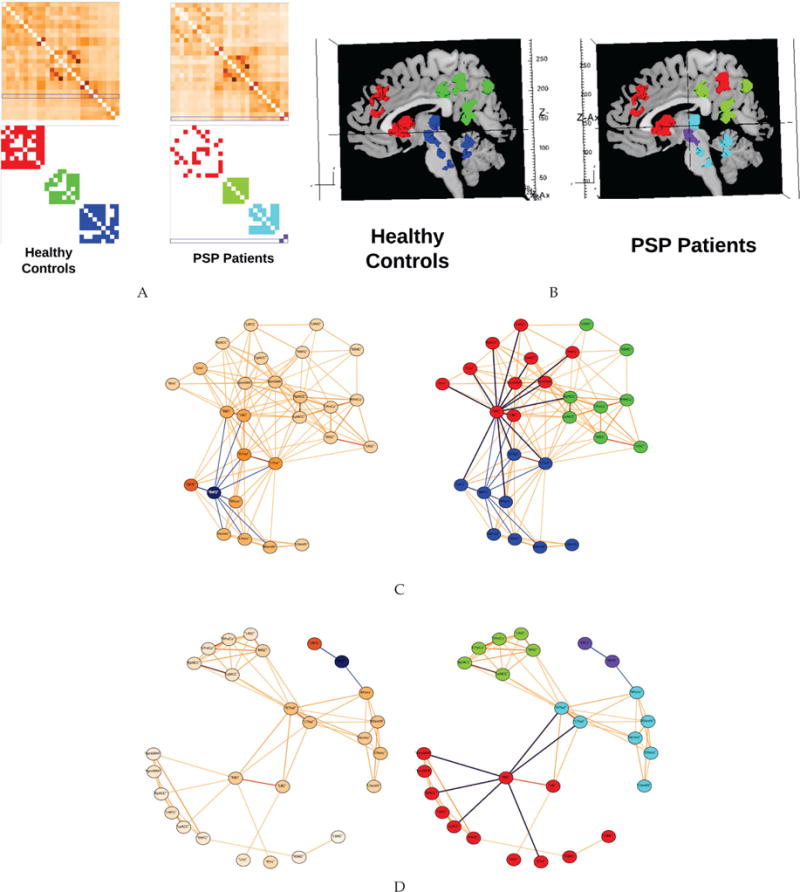
Functional connectivity of the mesothalamic junction (MTJ) network in 36 healthy controls subjects and 18 PSP patients. A. Matrix views of the MTJ network in controls (left column) and PSP patients (right column); the top row shows the connectivity weights as a heat map with the right MTJ nodes row highlighted in blue, while the bottom row shows connections above the selected weight threshold as solid colors corresponding to the community they belong to. B. Anatomical views of the nodes comprising the MTJ network, colored according to their community membership in controls (left) and PSP patients (right). Spring-embedded network views of the control C and PSP patient D group mean networks, illustrating connectivity strength from the right MTJ (left column) and the community structure of the networks (right column). Right MTJ connections are shown as blue edges in all networks. Right basal ganglia connections are shown as purple edges in the right column.
The visualization tool clarified that the major consequence of reduced connectivity was progressive isolation of the three modules in this network: the subcortical (Fig. 8B, left, blue), frontal (Fig. 8B, left, red), and parietal (Fig. 8B, left, green) modules. The cognitive symptoms of PSP include bradyphrenia, an impairment of concentration, and loss of mental flexibility, both of which are components of what has been called a subcortical dementia [71]. These symptoms are thought to reflect impaired interaction between cortical regions and subcortical regions including the basal ganglia and thalamus [72].
The visualization tool makes simultaneously apparent: (i) the reduced degree centrality of the basal ganglia (RBG and LBG nodes) in PSP as compared to HC (purple lines in Fig. 8D, right in PSP compared to right in HC, Fig. 8C) and (ii) the substantial isolation of the subcortical module from the frontal module (blue nodes to red nodes in Fig. 8C, right, vs cyan nodes to red nodes in Fig. 8C, right).
This combination of community detection, nodewise graph theory metrics, anatomical rendering of community membership, and the ability to assess nodewise connectivity edges enables complex, multipart observations that are not otherwise easy to synthesize. Here, this disconnection of the basal ganglia in the face of cortical-subcortical isolation is a candidate mechanism for bradyphrenia in PSP that has not previously been explored in a network context.
5.2 Case Study 2: Memory Encoding and Retrieval
Fifteen healthy young subjects participated in an episodic memory encoding and retrieval task (unpublished data). Subjects were asked to learn the associations between images of different famous faces and famous places that involved first studying the pairs of faces and places to be remembered, then immediately afterwards receiving a task-free (resting state) fMRI scan. The following day, subjects returned and performed a memory test to assess how many of the studied pairs they could accurately recall from the previous day. Memory performance was measured in order to relate it to functional connectivity as observed by the pre-encoding and post-encoding fMRI scans. We hypothesized that subjects with superior memory would show elevated connectivity between memory and visual regions in the post-encoding scan, indicative of more active memory consolidation. Subject fMRI scans were parcellated into 199 brain regions spanning the cortical gray matter, subcortical, and brainstem regions. The pairwise functional connectivity between these regions was calculated to derive the 199 × 199 connectivity matrix for each subject. A behavioral correlation matrix matrix was obtained by calculating the correlation of each subject’s performance on the memory task with their functional connectivity between region A and region B, then repeating this procedure for all pairs of regions. This 199 × 199 groupwise behavioral correlation matrix can be thought of as a network representing successful memory consolidation. The memory consolidation network (MCN) was analyzed for community structure to determine if particular regions became more central hubs in the post-learning network, when memory consolidation was occurring for the subjects with superior memory performance.
Community assignments were visualized in the Brain Modulyzer both in abstract and anatomical space. The modules in this network can be recognized as known intrinsic functional connectivity networks—the default mode (Fig.; green), visual/sensory (red), executive control (cyan), and motor networks (purple). The anatomical view is essential for identifying the spatial topography of these networks. For example, in Fig. 9A and B, the default mode network (green) can be recognized based on its layout in medial frontal, medial parietal, lateral inferior parietal, and temporal lobes. The executive control network (blue) can be recognized in dorsal lateral prefrontal and superior parietal areas. The axial, sagittal, and slice views, along with the 3D surface view, all provide complementary information. While the spatial pattern of nodes in the same module can be useful for recognizing the system, the anatomical view provides little information about the network interactions within and between these different modules. A graph view is a valuable tool for discerning how the different modules interact. The ability to simultaneously observe this network in linked anatomical, graph, and matrix views enables a rich navigational experience, unlike any currently available tool.
Fig. 9.
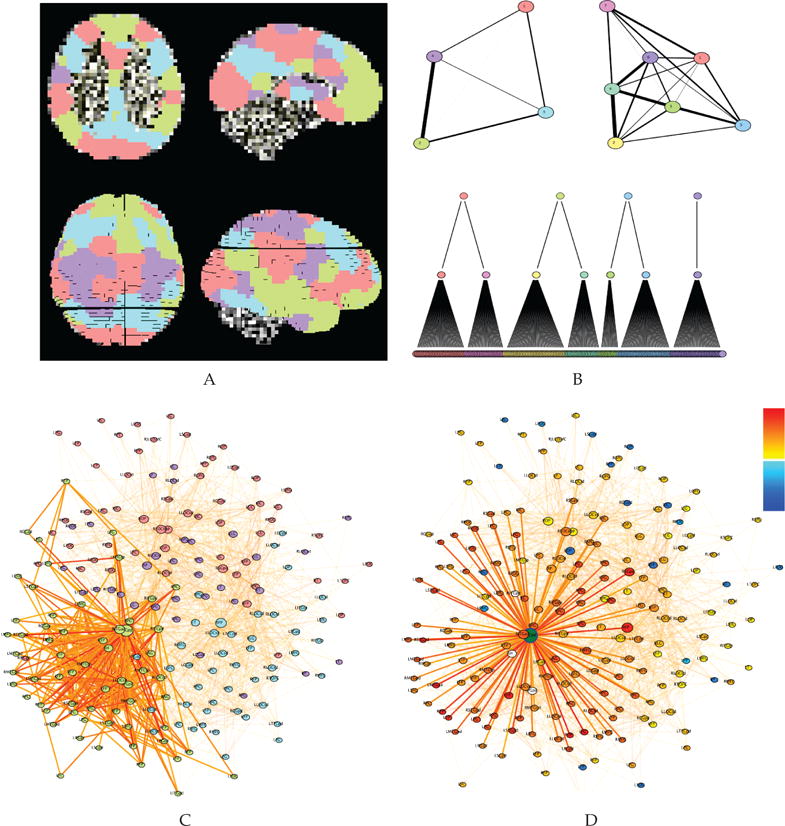
Anatomical and graph views of the memory consolidation network (MCN). A. Planar (top row) and 3D surface (bottom row) views of the 199 regions of interest in the network, overlaid on the anatomical template brain. Node colors correspond to modules as determined by the Brain Modulyzer. B. Network aggregate community graphs (top) and Louvain modular hierarchy dendrogram (bottom). The left network shows the four communties at the top level of the hierarchy while the right network shows the eight subcommunities at the second level of the hierarchy. C. Whole graph view of the network, showing all nodes with the color corresponding to module membership as in A and B at the top level of the hierarchy. Highlighted are all connections within the default mode network module nodes (green). D. Whole graph view of the network, showing the connections of the posterior hippocampus/fusiform cortex (green node) to its most strongly connected neighbors (r > .25; bottom). Node colors respresent the correlation strength to the selected node.
In the network under examination here, the executive control network lies between the default mode and visual/sensory networks (Fig. 9B, top left). The default mode and visual/sensory networks have extremely sparse direct connectivity to one another, as can be seen by the weak inter-modular connectivity in Fig. 9B, top left, and the nearly perfect separation of the green and red nodes in the spring embedded network in Fig. 9C. From this observation we can generate the hypothesis that during successful memory consolidation, the executive network plays a pivotal role coordinating between these networks, potentially by allocating resources for attention and multimodal sensory binding. One node played a particularly critical role in connecting multiple modules, the posterior hippocampus/fusiform cortex (Fig. 9D, green). This node exhibited the highest combination of degree centrality, participation coefficient, and betweenness centrality of any node in the MCN. This suggests that this node plays an important role binding information from communities supporting memory encoding (default mode; green), visual/sensory processing (red), executive function (blue), and motor function (purple).
6 Conclusions and Future Work
We have presented a visualization tool for exploration and analysis of modular functional brain connectivity data. The innovative capabilities of our system make it possible to apply visualization techniques to all relevant data representations and use automated analysis methods for detailed exploration of brain network data. Our tool provides focus+context and detail+overview visualizations supporting an interactive, in-depth analysis of hierarchical communities. We have used our system to visualize community hierarchies in real-time for datasets up to 200 brain regions. The tool has already proven to be a valuable resource for the neuroscientists in our collaborative team. Since other groups have voiced a strong interest in our tool, we plan to make it publicly available for download.
While already useful in its current state, numerous extensions of our system are possible. For example, currently the tool supports analyzing one graph at a time. We plan to add the ability to read several connectivity matrices, e.g., a resting state network and a network after performing a mental task and display graphs that highlight the differences in an intuitive way. We also plan to expand our framework to more effectively combine statistical and visual data analysis. Since these two modes of data analysis complement each other, it will be worthwhile to explore whether statistical insights can inform the visualization process and whether visual presentations can also lead to refined statistical analysis.
Supplementary Material
Acknowledgments
This work was supported by the Laboratory Directed Research and Development Program of Lawrence Berkeley National Laboratory under U.S. Department of Energy Contract No. DE-AC02-05CH11231. This work is also supported by the Tau Consortium (grants to William W. Seeley), and the NIH (NIA grants AG023501 to William W. Seeley). Finally, we thank our patients and their families for their invaluable contributions to neurodegenerative disease research.
Biographies

Sugeerth Murugesan Sugeerth Murugesan received his BTech degree in Computer Science from Amrita Institute of Technology, Coimbatore, in 2013. He is currently a Ph.D. student in the department of Computer Science at University of California, Davis, U.S.A. His research interests include connectome visualization, parallel and distributed computing and computer vision. He is also a member of ACM.

Kristopher Bouchard‘’s research addresses the question of how distributed neural circuits gives rise to coordinated behaviors. His undergraduate studies in mathematics guided his senior thesis in neural network learning with Dr. Larry Abbott at Brandeis. During his neuroscience Ph.D at UCSF with Dr. Michael Brainard, he designed and conducted experiments recording from single-neurons to examine the representation of produced probabilistic sequences in songbird sensorimotor circuits. As a postdoctoral fellow in neural engineering with Dr. Edward Chang, he investigated functional organization and dynamic coordination in human sensorimotor cortex (SMC) during speech production with high-density electrocorticography (ECoG) grids. Currently, he is part of a diverse team across UCB-UCSF-LBNL for development of instrumentation and computational methods for massive channel count, high spatial-temporal resolution functional brain mapping

Jesse A. Brown is a postdoctoral scholar at UCSF. He works in the Memory and Aging Center with Dr. William Seeley. He has a Ph.D. in neuroscience from UCLA, where he worked with Dr. Susan Bookheimer on multimodal neuroimaging methods for characterizing brain connectivity alterations in individuals with genetic risk for Alzheimers Disease. His current research is developing neuroimaging connectivity methods to aid in the early diagnosis of neurodegenerative diseases and monitor their progression over

Bernd Hamann teaches computer science at the University of California, Davis. He studied computer science and mathematics at the Technical University of Braunschweig, Germany, and Arizona State University, U.S.A. His main interests are visualization, geometric modeling, image processing and computer graphics.

William Seeley received his MD from the UCSF School of Medicine. He then completed an Internal Medicine internship at UCSF and Neurology residency at the Massachusetts General and Brigham and Womens Hospitals. He is currently an Associate Professor of Neurology at the UCSF Memory and Aging Center, where he participates in patient evaluation and management, and Director of the UCSF Neurodegenerative Disease Brain Bank. His research interest regards selective vulnerability in neurodegenerative disease.

Andrew Trujillo Andrew Trujillo joined the Seeley Selective Vulnerability Research Laboratory in June 2011 as an Imaging Research Associate. He graduated from Pomona College in 2009 with a bachelor of arts degree in cognitive science. Andrew comes to the UCSF Memory and Aging Center (MAC) after having completed a two year apprenticeship at Stanford University.

Gunther Weber is a Staff Scientist in LBNLs Computational Research Division and an Adjunct Associate Professor of Computer Science at UC Davis. He earned his Ph.D. in computer science from the University of Kaiserslautern, Germany in 2003 and completed his post-doc in 2006 at UC Davis. His research interests include scientific visualization, data analysis, computer graphics and parallel algorithms.
Contributor Information
Sugeerth Murugesan, Department of Computer Science, University of California, Davis, One Shields Avenue, Davis CA 95616, USA; Computational Research Division, Lawrence Berkeley National Laboratory, Cyclotron Road, Berkeley, CA 94720, USA.
Kristofer Bouchard, Computational Research Division, Lawrence Berkeley National Laboratory, Cyclotron Road, Berkeley, CA 94720, USA.
Jesse A. Brown, Memory and Aging Center at University of California, San Francisco, CA 94143, USA
Bernd Hamann, Department of Computer Science, University of California, Davis, One Shields Avenue, Davis CA 95616, USA.
William W. Seeley, Memory and Aging Center at University of California, San Francisco, CA 94143, USA
Andrew Trujillo, Memory and Aging Center at University of California, San Francisco, CA 94143, USA.
Gunther H. Weber, Department of Computer Science, University of California, Davis, One Shields Avenue, Davis CA 95616, USA; Computational Research Division, Lawrence Berkeley National Laboratory, Cyclotron Road, Berkeley, CA 94720, USA.
References
- 1.Smith SM, Fox PT, Miller KL, Glahn DC, Fox PM, Mackay CE, Filippini N, Watkins KE, Toro R, Laird AR, Beckmann CF. Correspondence of the brain’s functional architecture during activation and rest. PNAS. 2009;106(31) doi: 10.1073/pnas.0905267106. [DOI] [PMC free article] [PubMed] [Google Scholar]
- 2.Power JD, Cohen AL, Nelson SM, Wig GS, Barnes KA, Church JA, Vogel AC, Laumann TO, Miezin FM, Schlaggar BL, Petersen SE. Functional network organization of the human brain. Neuron. 2011;72(4):665–678. doi: 10.1016/j.neuron.2011.09.006. [DOI] [PMC free article] [PubMed] [Google Scholar]
- 3.Blondel VD, Guillaume J-L, Lambiotte R, Lefebvre R. Fast unfolding of communities in large networks. Journal of Statistical Mechanics: Theory and Experiment. 2008;2008:P10008. [Google Scholar]
- 4.Meunier D, Achard S, Morcom A, Bullmore E. Age-related changes in modular organization of human brain functional networks. Neuroimage. 2009;44(3) doi: 10.1016/j.neuroimage.2008.09.062. [DOI] [PubMed] [Google Scholar]
- 5.Chan MY, Park DC, Savalia NK, Petersen SE, Wig GS. Decreased segregation of brain systems across the healthy adult lifespan. Proc of the National Academy of Sciences. 2014;111(46):E4997–E5006. doi: 10.1073/pnas.1415122111. [DOI] [PMC free article] [PubMed] [Google Scholar]
- 6.Meyer-Lindenberg A, Poline J-B, Kohn PD, Holt JL, Egan MF, Weinberger DR, Berman KF. Evidence for abnormal cortical functional connectivity during working memory in schizophrenia. American Journal of Psychiatry. 2001 doi: 10.1176/appi.ajp.158.11.1809. [DOI] [PubMed] [Google Scholar]
- 7.Stam C, Jones B, Nolte G, Breakspear M, Scheltens P. Small-world networks and functional connectivity in alzheimer’s disease. Cerebral cortex. 2007;17(1):92–99. doi: 10.1093/cercor/bhj127. [DOI] [PubMed] [Google Scholar]
- 8.Wang L, Zhu C, He Y, Zang Y, Cao Q, Zhang H, Zhong Q, Wang Y. Altered small-world brain functional networks in children with attention-deficit/hyperactivity disorder. Human brain mapping. 2009;30(2):638–649. doi: 10.1002/hbm.20530. [DOI] [PMC free article] [PubMed] [Google Scholar]
- 9.Liu Y, Liang M, Zhou Y, He Y, Hao Y, Song M, Yu C, Liu H, Liu Z, Jiang T. Disrupted small-world networks in schizophrenia. Brain. 2008;131(4):945–961. doi: 10.1093/brain/awn018. [DOI] [PubMed] [Google Scholar]
- 10.Rubinov M, Knock SA, Stam CJ, Micheloyannis S, Harris AW, Williams LM, Breakspear M. Small-world properties of nonlinear brain activity in schizophrenia. Human brain mapping. 2009;30(2):403–416. doi: 10.1002/hbm.20517. [DOI] [PMC free article] [PubMed] [Google Scholar]
- 11.Lee MH, Smyser CD, Shimony JS. Resting-state fmri: a review of methods and clinical applications. American Journal of Neuroradiology. 2013;34(10):1866–1872. doi: 10.3174/ajnr.A3263. [DOI] [PMC free article] [PubMed] [Google Scholar]
- 12.Alper B, Bach B, Henry Riche N, Isenberg T, Fekete J-D. Proc of the SIGCHI Conference on Human Factors in Computing Systems. ACM; 2013. Weighted graph comparison techniques for brain connectivity analysis; pp. 483–492. [Google Scholar]
- 13.Li K, Guo L, Faraco C, Zhu D, Chen H, Yuan Y, Lv J, Deng F, Jiang X, Zhang T, et al. Visual analytics of brain networks. NeuroImage. 2012;61(1):82–97. doi: 10.1016/j.neuroimage.2012.02.075. [DOI] [PMC free article] [PubMed] [Google Scholar]
- 14.Gerhard S, Daducci A, Lemkaddem A, Meuli R, Thiran J-P, Hagmann P. The connectome viewer toolkit: an open source framework to manage, analyze, and visualize connectomes. Frontiers in neuroinformatics. 2011;5 doi: 10.3389/fninf.2011.00003. [DOI] [PMC free article] [PubMed] [Google Scholar]
- 15.Xia M, Wang J, He Y. Brainnet viewer: A network visualization tool for human brain connectomics. PLoS One. 2013 doi: 10.1371/journal.pone.0068910. [DOI] [PMC free article] [PubMed] [Google Scholar]
- 16.LaPlante RA, Douw L, Tang W, Stufflebeam SM. The connectome visualization utility: Software for visualization of human brain networks. PloS one. 2014;9(12):e113838. doi: 10.1371/journal.pone.0113838. [DOI] [PMC free article] [PubMed] [Google Scholar]
- 17.Nelson SM, Cohen AL, Power JD, Wig GS, Miezin FM, Wheeler ME, Velanova K, Donaldson DI, Phillips JS, Schlaggar BL, et al. A parcellation scheme for human left lateral parietal cortex. Neuron. 2010;67(1):156–170. doi: 10.1016/j.neuron.2010.05.025. [DOI] [PMC free article] [PubMed] [Google Scholar]
- 18.Power J, Schlaggar B, Petersen S. Studying brain organization via spontaneous fMRI signal. Neuron. 2014;84(4) doi: 10.1016/j.neuron.2014.09.007. [DOI] [PMC free article] [PubMed] [Google Scholar]
- 19.Newman ME, Girvan M. Finding and evaluating community structure in networks. Physical review E. 2004;69 doi: 10.1103/PhysRevE.69.026113. [DOI] [PubMed] [Google Scholar]
- 20.Meunier D, Lambiotte R, Fornito A, Ersche KD, Bullmore ET. Hierarchical modularity in human brain functional networks. Frontiers in neuroinformatics. 2009;3 doi: 10.3389/neuro.11.037.2009. [DOI] [PMC free article] [PubMed] [Google Scholar]
- 21.He Y, Wang J, Wang L, Chen ZJ, Yan C, Yang H, Tang H, Zhu C, Gong Q, Zang Y, et al. Uncovering intrinsic modular organization of spontaneous brain activity in humans. PloS one. 2009;4(4):e5226. doi: 10.1371/journal.pone.0005226. [DOI] [PMC free article] [PubMed] [Google Scholar]
- 22.Rubinov M, Sporns O. Complex network measures of brain connectivity: uses and interpretations. Neuroimage. 2010;52(3):1059–1069. doi: 10.1016/j.neuroimage.2009.10.003. [DOI] [PubMed] [Google Scholar]
- 23.Bassett DS, Bullmore E, Verchinski BA, Mattay VS, Weinberger DR, Meyer-Lindenberg A. Hierarchical organization of human cortical networks in health and schizophrenia. The Journal of Neuroscience. 9248;28(37):37–9239. doi: 10.1523/JNEUROSCI.1929-08.2008. [DOI] [PMC free article] [PubMed] [Google Scholar]
- 24.Salvador R, Suckling J, Coleman MR, Pickard JD, Menon D, Bullmore E. Neurophysiological architecture of functional magnetic resonance images of human brain. Cerebral cortex. 2005;15(9):1332–1342. doi: 10.1093/cercor/bhi016. [DOI] [PubMed] [Google Scholar]
- 25.Fair DA, Cohen AL, Power JD, Dosenbach NU, Church JA, Miezin FM, Schlaggar BL, Petersen SE. Functional brain networks develop from a local to distributed organization. PLoS computational biology. 2009;5(5):e1000381. doi: 10.1371/journal.pcbi.1000381. [DOI] [PMC free article] [PubMed] [Google Scholar]
- 26.Deshpande G, Santhanam P, Hu X. Instantaneous and causal connectivity in resting state brain networks derived from functional mri data. Neuroimage. 2011;54(2) doi: 10.1016/j.neuroimage.2010.09.024. [DOI] [PMC free article] [PubMed] [Google Scholar]
- 27.Fair DA, Cohen AL, Dosenbach NU, Church JA, Miezin FM, Barch DM, Raichle ME, Petersen SE, Schlaggar BL. The maturing architecture of the brain’s default network. Proc of the National Academy of Sciences. 2008;105 doi: 10.1073/pnas.0800376105. [DOI] [PMC free article] [PubMed] [Google Scholar]
- 28.Becker RA, Eick SG, Wilks AR. Visualizing network data. Visualization and Computer Graphics, IEEE Transactions on. 1995;1(1):16–28. [Google Scholar]
- 29.Sanz-Arigita EJ, Schoonheim MM, Damoiseaux JS, Rombouts SA, Maris E, Barkhof F, Scheltens P, Stam CJ. Loss of small-worldnetworks in alzheimer’s disease: graph analysis of fmri resting-state functional connectivity. PloS one. 2010;5 doi: 10.1371/journal.pone.0013788. [DOI] [PMC free article] [PubMed] [Google Scholar]
- 30.Achard S, Salvador R, Whitcher B, Suckling J, Bullmore E. A resilient, low-frequency, small-world human brain functional network with highly connected association cortical hubs. The Journal of Neuroscience. 2006;26(1):63–72. doi: 10.1523/JNEUROSCI.3874-05.2006. [DOI] [PMC free article] [PubMed] [Google Scholar]
- 31.Worsley KJ, Chen J-I, Lerch J, Evans AC. Comparing functional connectivity via thresholding correlations and singular value decomposition. Philosophical Transactions of the Royal Society B: Biological Sciences. 2005;360(1457):913–920. doi: 10.1098/rstb.2005.1637. [DOI] [PMC free article] [PubMed] [Google Scholar]
- 32.Bezgin G, Reid AT, Schubert D, Kötter R. Matching spatial with ontological brain regions using java tools for visualization, database access, and integrated data analysis. Neuroinformatics. 2009;7(1):7–22. doi: 10.1007/s12021-008-9039-5. [DOI] [PubMed] [Google Scholar]
- 33.Cao J, Worsley K, et al. The geometry of correlation fields with an application to functional connectivity of the brain. The Annals of Applied Probability. 1999;9(4):1021–1057. [Google Scholar]
- 34.Goebel R, Esposito F, Formisano E. Analysis of functional image analysis contest (fiac) data with brainvoyager qx: From single-subject to cortically aligned group general linear model analysis and self-organizing group independent component analysis. Human Brain Mapping. 401;27(5):5–392. doi: 10.1002/hbm.20249. [DOI] [PMC free article] [PubMed] [Google Scholar]
- 35.van Dixhoorn AF, Vissers BH, Ferrarini L, Milles J, Botha CP. Proc of the 2nd Eurographics Conference on Visual Computing for Biology and Medicine. Eurographics Association; 2010. Visual analysis of integrated resting state functional brain connectivity and anatomy; pp. 57–64. (ser EG VCBM’10). [Google Scholar]
- 36.Akers D, Sherbondy A, Mackenzie R, Dougherty R, Wandell B. Visualization, 2004. IEEE. IEEE; 2004. Exploration of the brain’s white matter pathways with dynamic queries. [DOI] [PubMed] [Google Scholar]
- 37.Bruckner S, Solteszova V, Groller E, Hladuvka J, Buhler K, Yu JY, Dickson BJ. Braingazer-visual queries for neurobiology research. Visualization and Computer Graphics, IEEE Transactions on. 2009;15(6) doi: 10.1109/TVCG.2009.121. [DOI] [PubMed] [Google Scholar]
- 38.Beyer J, Al-Awami A, Kasthuri N, Lichtman JW, Pfister H, Hadwiger M. Connectomeexplorer: Query-guided visual analysis of large volumetric neuroscience data. Visualization and Computer Graphics, IEEE Transactions on. 2013;19(12) doi: 10.1109/TVCG.2013.142. [DOI] [PMC free article] [PubMed] [Google Scholar]
- 39.Jianu R, Demiralp C, Laidlaw DH. Exploring brain connectivity with two-dimensional neural maps. Visualization and Computer Graphics, IEEE Transactions on. 2012;18(6) doi: 10.1109/TVCG.2011.82. [DOI] [PubMed] [Google Scholar]
- 40.Whitfield-Gabrieli S, Nieto-Castanon A. Conn: a functional connectivity toolbox for correlated and anticorrelated brain networks. Brain connectivity. 2012;2(3):125–141. doi: 10.1089/brain.2012.0073. [DOI] [PubMed] [Google Scholar]
- 41.Ribeiro AS, Lacerda LM, Ferreira HA. Multi-modal imaging brain connectivity analysis toolbox (mibca) PeerJ PrePrints, Tech Rep. 2014 doi: 10.7717/peerj.1078. [DOI] [PMC free article] [PubMed] [Google Scholar]
- 42.Brown JA, Rudie JD, Bandrowski A, Van Horn JD, Bookheimer SY. The ucla multimodal connectivity database: a web-based platform for brain connectivity matrix sharing and analysis. Frontiers in neuroinformatics. 2012;6 doi: 10.3389/fninf.2012.00028. [DOI] [PMC free article] [PubMed] [Google Scholar]
- 43.Vehlow C, Beck F, Weiskopf D. The state of the art in visualizing group structures in graphs [Google Scholar]
- 44.Heer J, Boyd D. Information Visualization, 2005. INFOVIS 2005. IEEE Symposium on. IEEE; 2005. Vizster: Visualizing online social networks; pp. 32–39. [Google Scholar]
- 45.Vehlow C, Reinhardt T, Weiskopf D. Visualizing fuzzy overlapping communities in networks. IEEE Transactions on Visualization and Computer Graphics. 2013;19(12) doi: 10.1109/TVCG.2013.232. [DOI] [PubMed] [Google Scholar]
- 46.Herman I, Melançon G, Marshall MS. Graph visualization and navigation in information visualization: A survey. Visualization and Computer Graphics, IEEE Transactions on. 2000;6(1) [Google Scholar]
- 47.Johnson B, Shneiderman B. Visualization, 1991. Visualization’91, Proc, IEEE Conference on. IEEE; 1991. Tree-maps: A space-filling approach to the visualization of hierarchical information structures; pp. 284–291. [Google Scholar]
- 48.Robertson GG, Mackinlay JD, Card SK. Cone trees: animated 3d visualizations of hierarchical information. ACM [Google Scholar]
- 49.Rekimoto J, Green M. The information cube: Using transparency in 3d information visualization. 1993 [Google Scholar]
- 50.Abello J, Van Ham F, Krishnsan N. Ask-graphview: A large scale graph visualization system. Visualization and Computer Graphics, IEEE Transactions on. 2006;12(5):669–676. doi: 10.1109/TVCG.2006.120. [DOI] [PubMed] [Google Scholar]
- 51.Raitner M. Graph drawing. Springer; 2005. Visual navigation of compound graphs; pp. 403–413. [Google Scholar]
- 52.Wu H-M, Tien Y-J, Chen C-h. Gap: A graphical environment for matrix visualization and cluster analysis. Computational Statistics & Data Analysis. 2010;54(3):767–778. [Google Scholar]
- 53.Sokal RR, Rohlf FJ. The comparison of dendrograms by objective methods. Taxon. 1962:33–40. [Google Scholar]
- 54.Bassett DS, Brown JA, Deshpande V, Carlson JM, Grafton ST. Conserved and variable architecture of human white matter connectivity. Neuroimage. 2011;54(2) doi: 10.1016/j.neuroimage.2010.09.006. [DOI] [PubMed] [Google Scholar]
- 55.Ginestet CE, Simmons A. Statistical parametric network analysis of functional connectivity dynamics during a working memory task. Neuroimage. 2011;55(2):688–704. doi: 10.1016/j.neuroimage.2010.11.030. [DOI] [PubMed] [Google Scholar]
- 56.Kramer MA, Eden UT, Lepage KQ, Kolaczyk ED, Bianchi MT, Cash SS. Emergence of persistent networks in long-term intracranial eeg recordings. The Journal of Neuroscience. 2011;31(44):15757–15767. doi: 10.1523/JNEUROSCI.2287-11.2011. [DOI] [PMC free article] [PubMed] [Google Scholar]
- 57.Iragne F, Nikolski M, Mathieu B, Auber D, Sherman D. Proviz: protein interaction visualization and exploration. Bioinformatics. 274;21(2):2–272. doi: 10.1093/bioinformatics/bth494. [DOI] [PubMed] [Google Scholar]
- 58.North SC. Drawing graphs with neato. NEATO User Manual. 2004;11 [Google Scholar]
- 59.Fruchterman TM, Reingold EM. Graph drawing by force-directed placement. Software: Practice and experience. 1991;21(11):1129–1164. [Google Scholar]
- 60.Becker MY, Rojas I. A graph layout algorithm for drawing metabolic pathways. Bioinformatics. 2001;17(5) doi: 10.1093/bioinformatics/17.5.461. [DOI] [PubMed] [Google Scholar]
- 61.Del Bimbo A, Mugnaini M, Pala P, Turco F. Visual querying by color perceptive regions. Pattern recognition. 1998;31 [Google Scholar]
- 62.Hoare CA. Quicksort. The Computer Journal. 1962 [Google Scholar]
- 63.Bullmore E, Sporns O. Complex brain networks: graph theoretical analysis of structural and functional systems. Nature Reviews Neuroscience. 2009;10(3):186–198. doi: 10.1038/nrn2575. [DOI] [PubMed] [Google Scholar]
- 64.Sporns O. From simple graphs to the connectome: networks in neuroimaging. Neuroimage. 2012;62(2) doi: 10.1016/j.neuroimage.2011.08.085. [DOI] [PubMed] [Google Scholar]
- 65.Bonacich P. Some unique properties of eigenvector centrality. Social Networks. 564;29(4):4–555. [Google Scholar]
- 66.Guimera R, Amaral LAN. Functional cartography of complex metabolic networks. Nature. 2005;433(7028) doi: 10.1038/nature03288. [DOI] [PMC free article] [PubMed] [Google Scholar]
- 67.Brandes U. A faster algorithm for betweenness centrality*. Journal of Mathematical Sociology. 2001;25(2):163–177. [Google Scholar]
- 68.Newman ME. A measure of betweenness centrality based on random walks. Social networks. 2005;27(1):39–54. [Google Scholar]
- 69.Golbe LI. Progressive supranuclear palsy. Seminars in Neurology. 2014;34(02):151–159. doi: 10.1055/s-0034-1381736. [DOI] [PubMed] [Google Scholar]
- 70.Gardner RC, Boxer AL, Trujillo A, Mirsky JB, Guo CC, Gennatas ED, Heuer HW, Fine E, Zhou J, Kramer JH, Miller BL, Seeley WW. Intrinsic connectivity network disruption in progressive supranuclear palsy. Annals of Neurology. 2013;73 doi: 10.1002/ana.23844. [DOI] [PMC free article] [PubMed] [Google Scholar]
- 71.Albert ML, Feldman RG, Willis AL. Thesubcortical dementia’ of progressive supranuclear palsy. Journal of Neurology, Neurosurgery & Psychiatry. 1974;37(2):121–130. doi: 10.1136/jnnp.37.2.121. [DOI] [PMC free article] [PubMed] [Google Scholar]
- 72.Schmahmann JD, Pandya DN. Disconnection syndromes of basal ganglia, thalamus, and cerebrocerebellar systems. Cortex. 2008;44(8):1037–1066. doi: 10.1016/j.cortex.2008.04.004. [DOI] [PMC free article] [PubMed] [Google Scholar]
Associated Data
This section collects any data citations, data availability statements, or supplementary materials included in this article.


