

Abstract
Land-use conversion and fertilization have been widely reported as important management practices affecting CH4 and N2O fluxes; however, few long-term in situ measurements are available after land-use conversion from rice paddies to upland cultivation, especially those including the initial stages after conversion. A 3-year field experiment was conducted in rice paddies and a newly converted citrus orchard to measure CH4 and N2O fluxes in response to land-use conversion and fertilization in a red soil region of southern China. Annual CH4 and N2O emissions averaged 303.9 kg C ha−1 and 3.8 kg N ha−1, respectively, for the rice paddies over three cultivation years. Although annual N2O emissions increased two- to threefold after the conversion of rice paddies to citrus orchard, the substantial reduction in CH4 emissions and even shift into a sink for atmospheric CH4 led to significantly lower CO2-eq emissions of CH4 and N2O in the citrus orchard compared to the rice paddies. Moreover, distinct CH4 emissions were observed during the initial stages and sustained for several weeks after conversion. Our results indicated that the conversion of rice paddies to citrus orchards in this region for higher economic benefits may also lead to lower aggregate CH4 and N2O emissions.
Introduction
The anthropogenic trace gases methane (CH4) and nitrous oxide (N2O), two major potent and long-lived greenhouse gases (GHGs), have 34 and 298 times higher radiative forcing, respectively, than CO2 over a time horizon of 100 years1. Agriculture ecosystem is one of the major sources for these anthropogenic emissions, accounting for approximately 50% and 60% of the total global CH4 and N2O emissions, respectively2. Paddy fields, in particular, have been well documented as a significant source of atmospheric CH4 and can release substantial N2O. The periodic waterlogging-drainage alteration episodes and intensive inputs of organic material and nitrogen fertilizer in paddy fields may provide a suitable soil environment and accessible substrate for CH4 and N2O emissions3, 4. Many studies have demonstrated high CH4 but relatively low N2O emissions from rice paddies because anaerobic conditions limit nitrate availability and because strict anaerobiosis favours complete denitrification to nitrogen gas (N2)5, 6. However, N2O emissions are generally high in upland soils, especially after fertilization or irrigation events, due to the tight coupling between nitrification and denitrification7–9. Therefore, the conversion of rice paddies to upland agriculture might result in ‘pollution swapping’, that is, reduced CH4 emissions at the expense of an increase in N2O emissions, due to changes in soil environmental conditions and management practices9, 10.
Land-use change, which is regarded as the second largest anthropogenic source of greenhouse gas emissions, can substantially alter the dynamics of soil gases11–13. However, land-use change can also decrease, increase, or have no significant impact on soil CH4 and N2O fluxes9, 13–16. The high variability of soil CH4 and N2O fluxes due to land-use change is associated with particular site conditions, such as the soil type and microclimate, the type and history of land-use change, and the management practices used16–18. In general, conversion from rice paddy to upland agriculture can significantly reduce CH4 emissions or even convert the soil from an emission source to a sink for atmospheric CH4 6, 9. However, when and to what extent can the soil act as an atmospheric CH4 sink after these land-use conversions still remain unclear. Moreover, most of the existing studies have focused on comparisons of different types of land uses that have been converted for many years18–21. Thus, little information is available for understanding the dynamics of CH4 and N2O fluxes and the underlying mechanisms involved during the initial stages after land-use conversion.
China is one of the most important rice-producing countries in the world, accounting for 20% of the global rice production area6, 22. The annual totals for CH4 and N2O emissions from Chinese rice paddies were approximately 4.5–7.5 Tg C yr−1 and 32–51 Gg N yr−1, respectively, based on long-term field measurements and model simulations22–25. Red soil, one of the typical agricultural soils in subtropical China, covers approximately 11.8% of the country’s land surface, producing 80% of the rice, and supporting 22.5% of the population of China26. During the past decades, the red soil regions, which are the most densely populated, have experienced significant changes in land use due to increased socio-economic development and demand for livestock products. In particular, conversion of rice paddies to upland cultivation for growing vegetables, fruits and economic forest has been locally advocated to meet increasing market demands and gain higher economic returns in these regions6, 18. Such conversions not only can alter the physical, chemical and biological properties of the soil, but also can impact on the soil C and N turnover and GHG emissions. However, detailed long-term measurements of combined CH4 and N2O fluxes during such conversions are still limited, and the impact of environmental factors and management practices on CH4 and N2O fluxes during such conversions are not fully understood, especially for the red soil regions in China.
Therefore, over a 3-year period, we conducted in situ measurements of CH4 and N2O fluxes from conventional paddy fields and a citrus plantation recently converted from paddy field in a typical hilly, red soil region of southern China. The main objectives of this study were to investigate the response characteristics and temporal changes of CH4 and N2O fluxes during land-use conversion from paddy fields to a citrus plantation and to assess the impact of environmental factors and fertilization on CH4 and N2O fluxes. Eventually, this study also attempted to examine whether the conversion of rice paddies to citrus plantation shows potential for mitigating CH4 and N2O emissions.
Results
Weather conditions and soil properties
The annual mean air temperatures were 18.5, 18.6 and 18.9 °C for the 2012/2013, 2013/2014 and 2014/2015 cultivation years, respectively. The annual precipitation was lower in 2013/2014 (1117.6 mm) and 2014/2015 (1421.0 mm) cultivation years and higher in 2012/2013(1611.8 mm) compared to the long-term site average (1509.0 mm), and more than 70% of the rainfall occurred between March and August (Fig. 1a). Soil temperature showed a temporal pattern similar to that of air temperature for the three consecutive cultivation years (Fig. 1c). Land-use conversion from rice paddy field to a citrus orchard slightly increased the soil temperature but significantly reduced the soil moisture (Fig. 1b). However, fertilization did not significantly affect the soil temperature and moisture for either land-use type during the entire measurement period.
Figure 1.

The dynamics of daily precipitation and air temperature (a), floodwater depth in the rice growing seasons and WFPS (water-filled pore space) at 0–10 cm soil depth in the non-rice seasons (b) and soil temperatures at 0–10 cm depth (c) from June 2012 to July 2015.
As expected, land-use conversion and fertilization significantly changed the soil properties (Table 1 and Fig. 2). Before land-use conversion (May 2012), all the measured soil properties were not significantly different among different treatments (Table 1). However, the soil bulk density, TN and inorganic N (NH4 + and NO3 −) content substantially increased three years after land-use conversion from rice paddy fields to a citrus orchard (May 2015), whereas the soil pH and DOC values significantly decreased (P < 0.05). Seasonal variations in the soil inorganic N content over the entire observation period were basically regulated by N application (Fig. 2a,b). The relatively high NH4 + and NO3 − contents were primarily observed within 10 days after fertilization. Overall, fertilization significantly increased (P < 0.05) the NH4 + and NO3 − contents for both land-use types. The dynamics of soil DOC concentration were mainly affected by irrigation and fertilization activities, especially for the rice paddy (Fig. 2c). Soil DOC concentrations in the fertilized rice paddy plots were significantly higher compared to the control (P < 0.05); however, the highest soil DOC values in the rice paddy gradually decreased with successive cultivation years (Fig. 2c).
Table 1.
Main soil properties (0–10 cm) in study sites before and after land conversion. Data are shown as the means with standard errors for four spatial replicates. Different letters in the same column indicate significant differences (P < 0.05) between corresponding treatments. OF = orchard with fertilization, ONF = orchard without fertilization, PF = paddy with fertilization, and PNF = paddy without fertilization.
| Treatments | pH | Bulk density (g cm−3) | Total nitrogen (TN, g kg−1) | Dissolved organic carbon (DOC, mg L−1) | NH4 +−N (mg kg−1) | NO3 –−N (mg kg−1) |
|---|---|---|---|---|---|---|
| Before land-use conversion (May 2012) | ||||||
| OF | 5.04 ± 0.05 a | 1.28 ± 0.04 a | 1.03 ± 0.02 a | 6.06 ± 1.25 a | 8.63 ± 1.17 a | 0.68 ± 0.12 a |
| ONF | 4.98 ± 0.03 a | 1.27 ± 0.05 a | 0.99 ± 0.04 a | 5.26 ± 0.49 a | 9.34 ± 1.34 a | 0.61 ± 0.06 a |
| PF | 4.92 ± 0.09 a | 1.32 ± 0.06 a | 1.01 ± 0.02 a | 5.34 ± 1.04 a | 8.43 ± 0.71 a | 0.73 ± 0.06 a |
| PNF | 5.03 ± 0.07 a | 1.28 ± 0.01 a | 1.00 ± 0.03 a | 5.19 ± 1.01 a | 8.31 ± 1.05 a | 0.65 ± 0.05 a |
| 3 years after land-use conversion (May 2015) | ||||||
| OF | 4.76 ± 0.05 a | 1.26 ± 0.12 a | 1.16 ± 0.05 a | 7.24 ± 1.44 a | 18.82 ± 2.89 a | 7.18 ± 1.86 a |
| ONF | 4.87 ± 0.03 b | 1.30 ± 0.09 a | 1.12 ± 0.06 ab | 5.91 ± 1.06 a | 13.50 ± 1.21 b | 4.33 ± 0.75 b |
| PF | 4.95 ± 0.07 c | 1.08 ± 0.06 b | 1.08 ± 0.05 b | 32.41 ± 6.78 b | 13.05 ± 2.21 b | 3.53 ± 0.35 b |
| PNF | 5.04 ± 0.04 c | 1.05 ± 0.08 b | 1.06 ± 0.03 b | 11.95 ± 2.15 c | 6.67 ± 0.98 c | 1.96 ± 0.49 c |
Figure 2.
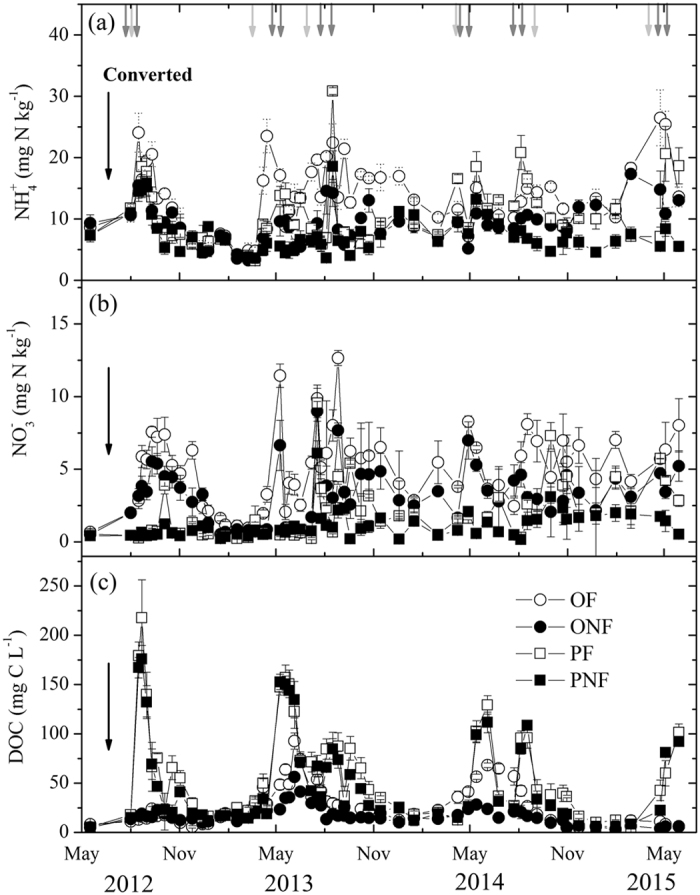
The dynamics of soil NH4 +−N (a), NO3 –−N (b) and DOC (c) concentrations in the four treatments from 2012 to 2015. The data are shown as the means with standard errors. The black arrow indicates the cultivation of orchard and paddy. The grey arrows indicate fertilizer applied to PF, and the light grey arrows indicate fertilizer applied to OF. The arrows in panel (a) applied to panel (b) and (c) as well.
N2O fluxes
Average N2O and CH4 fluxes did not differ significantly among the four treatments prior to the land-use conversion (Figs 3 and 4). Seasonal variations in N2O flux were characterized by pulse emission events, generally depending on the water irrigation regime and fertilization (Fig. 3). In paddy fields, unperceivable N2O fluxes were observed during the flooding periods, whereas substantial emissions occurred after fertilization and at the end of the cropping period, when fields dried off and/or were rewetted by rainfall. Fertilizer application significantly and consistently increased the N2O emissions from paddy fields during the three cultivation years (P < 0.05), and this stimulating effect of fertilization on N2O emissions was enhanced with successive years (Fig. 3a). Over the three cultivation years, the cumulative N2O emissions ranged from 3.18 to 6.18 kg N ha−1 in the PF, significantly higher than those in the PNF (Fig. 5 and Table 2). As a result, the calculated direct emission factors for N2O (EFd) from paddy fields were 0.47, 0.94 and 0.96% for the 2012/2013, 2013/2014 and 2014/2015 cultivation years, respectively.
Figure 3.

Seasonal dynamics of N2O fluxes from conventional paddy fields (a) and from a newly converted citrus plantation (b) from 2012 to 2015. The data are shown as the means with standard errors. The black arrow indicates the cultivation of orchard and paddy. The grey arrows indicate fertilizer applied to PF, and the light grey arrows indicate fertilizer applied to OF.
Figure 4.

Seasonal dynamics of CH4 fluxes from conventional paddy fields (a) and newly converted citrus plantation (b) from 2012 to 2015. The data are shown as the means with standard errors. The black arrow indicates the cultivation of orchard and paddy. The grey arrows indicate fertilizer applied to PF, and the light grey arrows indicate fertilizer applied to OF.
Figure 5.

Cumulative CH4 (a–f) and N2O (g–i) fluxes from all treatments after land-use conversion during each annual cultivation cycle from 2012–2015.
Table 2.
Cumulative CH4 and N2O fluxes and CO2-eq emissions after land conversion. Numbers in the table represent means with standard errors. OF = orchard with fertilization, ONF = orchard without fertilization, PF = paddy with fertilization, PNF = paddy without fertilization, LC = land-use conversion, and F = fertilization. *P < 0.01, **P < 0.001.
| Treatments | CH4 flux (kg C ha−1) | N2O flux (kg N ha−1) | CO2-eq emission (t CO2-eq ha−1) | ||||||
|---|---|---|---|---|---|---|---|---|---|
| 2012–2013 | 2013–2014 | 2014–2015 | 2012–2013 | 2013–2014 | 2014–2015 | 2012–2013 | 2013–2014 | 2014–2015 | |
| OF | −0.41 ± 0.14 | −1.36 ± 0.04 | −1.84 ± 0.19 | 16.25 ± 0.66 | 12.67 ± 1.53 | 9.91 ± 1.30 | 7.59 ± 0.31 | 5.87 ± 0.72 | 4.56 ± 0.62 |
| ONF | −0.29 ± 0.13 | −1.54 ± 0.05 | −1.70 ± 0.13 | 10.33 ± 0.68 | 9.15 ± 0.61 | 7.00 ± 0.11 | 4.82 ± 0.32 | 4.22 ± 0.29 | 3.20 ± 0.06 |
| PF | 355.83 ± 89.81 | 259.54 ± 23.53 | 244.58 ± 51.52 | 3.18 ± 0.16 | 5.49 ± 1.65 | 6.18 ± 1.93 | 17.62 ± 4.15 | 14.33 ± 1.84 | 13.98 ± 3.24 |
| PNF | 406.23 ± 57.08 | 265.72 ± 41.67 | 291.44 ± 17.60 | 1.52 ± 0.18 | 2.12 ± 0.20 | 2.75 ± 0.16 | 19.12 ± 2.67 | 13.04 ± 1.98 | 14.50 ± 0.87 |
| Analysis of variance | |||||||||
| LC | ** | ** | ** | ||||||
| F | ** | ** | ** | ||||||
| Year | ** | ** | ** | ||||||
| LC × F | ** | * | * | ||||||
| LC × Year | ** | ** | ** | ||||||
| F × Year | ** | ** | * | ||||||
| LC × F × Year | ** | ** | ** | ||||||
Land-use conversion from rice paddy to citrus orchard significantly increased the N2O emissions during the entire observation period (P < 0.05, Fig. 3b and Table 2). The high emission peaks in the citrus orchard were mainly linked to fertilization and sharp increases in the soil moisture following irrigation or rainfall events. However, the cumulative N2O emissions from the citrus orchard gradually decreased with consecutive cultivation years. Over the entire measurement period, the annual cumulative N2O emissions ranged from 7.0 to 10.33 kg N ha−1 in the ONF and from 9.91 to 16.25 kg N ha−1 in the OF (Fig. 5 and Table 2). Compared to the control, the application of fertilizer in the citrus orchard significantly increased N2O emissions (P < 0.05, Table 2), and the EFd values were variable for the citrus orchard, ranging between 1.29 and 1.99%. However, in contrast to the rice paddy, the stimulating effect of fertilization on N2O emissions in the citrus orchard gradually decreased with successive cultivation years (Table 2). General linear model analysis indicated that the N2O emissions were significantly affected by land-use conversion, fertilization and year, as well as by their interactions (P < 0.01, Table 2). During the entire observation period, the N2O emissions were significantly positively correlated with the soil NO3 − content for both land-use types (P < 0.05, Fig. 6a).
Figure 6.

Relationships between N2O fluxes from all treatments and soil NO3 −−N content (a), and between CH4 fluxes from paddy fields and soil DOC concentrations (b).
CH4 fluxes
Generally, CH4 fluxes from rice paddies were pronounced primarily during the waterlogging stages. Substantial CH4 emissions were observed during rice-growing seasons, while no pronounced CH4 emissions or a minor sink were observed during the fallow periods (Fig. 4a). During the rice-growing seasons, CH4 fluxes increased steadily until the emission peak was attained several weeks after rice transplanting under waterlogging conditions. Thereafter, CH4 fluxes decreased dramatically with the drying of fields and decreasing soil water content due to mid-season drainage and then remained at low rates until rice harvest. Although fertilization did not substantially alter the seasonal pattern of CH4 fluxes in rice paddies, it significantly decreased the magnitude of CH4 emissions (P < 0.05, Fig. 4a and Table 2). Over the three cultivation years, the mean annual cumulative CH4 emission was 286. 65 kg C ha−1 in the PF, which was an average of 12% lower than that in the PNF (Fig. 5 and Table 2). During the entire observation period, the CH4 fluxes from rice paddies were significantly positively correlated with the soil DOC concentrations (P < 0.05, Fig. 6b).
Land-use conversion from rice paddy to citrus orchard significantly decreased the CH4 fluxes during the entire observation period (P < 0.05, Fig. 4b and Table 2). There were no regular and consistent seasonal patterns of CH4 flux for the citrus orchard during our measurement period. In the newly converted citrus orchard, the soils remained a source of atmospheric CH4, which was sustained for several weeks after land-use conversion. Thereafter, CH4 emissions gradually decreased, and the soils became a weak sink for atmospheric CH4 in the beginning of October 2012, i.e., approximately 2 months after land-use conversion (Fig. 4b). After that, the citrus orchard was generally a sink for CH4, with some sporadic CH4 emissions during phases with high soil moisture. As a result, cumulative CH4 fluxes from the citrus orchard gradually increased with consecutive cultivation years. Over the entire observation period, the annual cumulative CH4 fluxes increased from −0.41 to −1.84 kg C ha−1 in the OF and from −0.29 to −1.7 kg C ha−1 in the ONF (Fig. 5 and Table 2). Compared to the control, there was no significant influence of fertilization on the mean annual CH4 fluxes in the citrus orchard. The cumulative CH4 fluxes over the entire measurement period varied significantly with land-use conversion, fertilization and year, as well as by their interactions (P < 0.01, Table 2).
Aggregate emissions of CH4 and N2O
As shown in Table 2, the mean annual CO2-eq emissions of CH4 and N2O were 15.31 and 15.55 t CO2-eq ha−1 for PF and PNF over the three cultivation years, respectively. These values were 2.5 and 3.8 times higher than those from OF and ONF, respectively, indicating that the land-use conversion of rice paddy field to a citrus orchard significantly decreased the net GHG emissions (P < 0.001). The significantly higher CO2-eq emissions in rice paddies were mainly due to the substantial CH4 emissions during rice-growing seasons. The highest CO2-eq emissions in the citrus orchard were observed in the first year after land-use conversion, irrespective of fertilization, after which the annual CO2-eq emissions gradually decreased with consecutive cultivation years (Table 2). The application of N fertilizer significantly increased CO2-eq emissions in the citrus orchard, mainly due to the substantial increase in N2O emissions from the fertilized treatment. However, there was no significant influence of fertilization on the CO2-eq emissions in rice paddies, which was largely ascribed to the counteractive effects of stimulated N2O emissions and depressed CH4 emissions due to fertilization in rice paddies. General linear model analysis indicated that the CO2-eq emissions were also significantly affected by land-use conversion, fertilization and year, as well as by their interactions (P < 0.01, Table 2).
Discussion
Over the past decades, numerous measurements of CH4 and N2O fluxes have been conducted in rice paddies, documenting paddy fields as significant sources of atmospheric CH4 and N2O3, 27–29. However, due to increased demand for livestock products and crop diversification, paddy field-converted upland cultivation systems (e.g., vegetables and orchard) have become increasingly adopted as agricultural systems, especially in the red soil regions of southern China18, 30. Although significantly lower CH4 but higher N2O emissions were generally observed in upland cultivation compared to rice paddies9, 31, most previous studies have focused on the comparison of CH4 and N2O fluxes in different land-use types that have been converted for many years and seldom consider the early stages after land-use conversion16–19, 31–33. Recently, several studies have suggested that in addition to accounting for GHG fluxes from specific land-use types, GHG dynamics during actual land-use changes should be also considered34, and these studies have recommended that further studies should be designed to monitor the entire conversion process35, 36. Although this is an important issue, only a few studies have carried out simultaneous measurements of CH4 and N2O fluxes during the initial stages after land-use conversion thus far9, 15. To our knowledge, the current study is one of the few multi-year in situ measurements of CH4 and N2O fluxes including the initial stages after land-use conversion from rice paddy to upland cultivation in southern China.
The mean annual CH4 and N2O fluxes from rice paddies in this study were 303.9 kg C ha−1 and 3.8 kg N ha−1, respectively, over the three cultivation years. These values were within the ranges identified by previous studies in double rice-cropping system with similar fertilization rates6, 9, 28, 37, but were much higher than those from other studies in single rice-cropping systems3, 15, 38. The mean annual CH4 and N2O fluxes from the paddy field-converted citrus orchard were −1.19 kg C ha−1 and 10.88 kg N ha−1, respectively, over the entire study period, which were generally close to previous observations18, 39, 40. However, the annual CH4 uptake values in the newly converted orchard were significantly lower than those found by Liu et al.20, who reported an average annual CH4 uptake of 2.61 kg C ha−1 y−1 in a pine plantation in a subtropical region of southern China. This discrepancy might be partly attributed to the difference in the length of time since establishment of the orchard plantation, i.e., newly converted versus 12 years old. Many publications have indicated that soil-atmosphere CH4 exchange can be strongly affected by soil disturbances, such as land-use change and agricultural practices, and that these effects may persist for years to decades41, 42; this possibility was confirmed by the gradually increasing CH4 oxidation capacity after land-use conversion in our study (Fig. 5). In addition, the annual N2O emissions from the citrus orchard in this study, especially during the first year after conversion, were generally greater than those from some earlier estimates20, 39, probably due to persistent anaerobic conditions during the initial stages after conversion from rice paddy and due to the high amount of basal fertilizer (370 kg N ha−1 y−1). However, the annual N2O emissions from the citrus orchard gradually decreased with consecutive cultivation years due to changes in the soil environmental conditions and management practices. Therefore, our results suggested that long-term, continuous measurements over several years after land-use conversion are needed to provide reliable estimates of the changes in annual CH4 and N2O fluxes due to land-use change and highlighted the importance of measurements during the initial stages after conversion.
The conversion of rice paddy to citrus orchard significantly reduced CH4 emissions and changed the soil from an emission source to sink for atmospheric CH4 over the entire measurement period. Although notable quantities of CH4 emissions were observed during the initial stages after conversion, the emission rates were significantly lower than those from rice paddies, which were consistent with previous studies showing that CH4 emissions can occur during non-flood conditions due to anaerobic microsites9, 43. This reduction in CH4 emissions after the conversion of rice paddy to citrus orchard can be primarily explained by the shift from anaerobic to aerobic conditions due to improved soil aeration and the regeneration of oxidants, particularly the re-oxidation of Fe(II)17, 31. Another driving factor for the reduction in CH4 emissions after conversion is the inhibiting effect of aerated conditions on the methanogenic archaeal community. While investigating the abundance of methanogenic archaea at our study site in the years 2013-2014, Liu et al. found significantly lower methanogenic archaea abundance in the citrus orchard compared to rice paddies44. This finding is in good agreement with results from previous studies that also reported decreasing numbers of methanogens and reductions in resident and active archaea in drained rice paddies45, 46. Moreover, significantly higher soil DOC content due to the large quantities of retained crop residues in rice paddies compared to citrus orchards might also contribute to higher CH4 emissions in paddy fields because available soil organic C is the predominant source of methanogenic substrates15, 37.
In contrast to decreasing CH4 emissions, the conversion of rice paddy to citrus orchard resulted in a significant increase in N2O emissions in this study. These results are in line with earlier observations showing that the formation of aerobic conditions caused by land-use change can result in reduced CH4 fluxes at the expense of increasing N2O emissions9, 47. Soil moisture is one of the key factors driving N2O emissions from many ecosystems due to its role in the stimulation of microbial activity and in the delivery of electron donors and acceptors, as well as in the diffusion of gases in soil3–5, 14–16. Although land-use conversion from rice paddy to citrus orchard significantly reduced soil moisture in this study, the strict anaerobic conditions during flooding periods in paddy fields might favour reduction of N2O to N2 through denitrification processes, thus leading to lower N2O emissions4, 5, 30. In our study, the N2O emissions from rice paddies during the flooding periods were generally low. Substantial emissions only occurred only during periods within several weeks following fertilization and the drying of fields. In addition, the significantly lower soil NO3 − content and limited nitrate availability under anaerobic conditions might contribute to the lower N2O emissions in rice paddies compared to those in citrus orchards, since strong positive correlations between N2O emissions and soil NO3 − content were observed for both land-use types in this study (Fig. 6a). Furthermore, the increased abundance of ammonia-oxidizing archaea in upland cultivations compared to rice paddies could further explain the increasing N2O emissions due to enhancement of nitrification processes46.
The utilization of synthetic N fertilizers is usually considered an important regulator of CH4 and N2O fluxes in agriculture fields5–8, 28. In this study, the application of N fertilizer generally resulted in a suppression of annual CH4 emissions from rice paddies over the 3-year measurement period, which was in accordance with some earlier observations6, 8, 43. However, previous studies on the effect of synthetic fertilizers on CH4 emissions from rice paddies are inconsistent. Either increased CH4 emissions or no significant change in emissions due to fertilization from paddy fields has also been reported in some other studies28, 30, 48. In paddy fields, the application of N fertilizer, especially ammonium-based fertilizers, has been found to promote the growth and activity of methane-oxidizing bacteria, especially in soil around rice roots49, thus resulting in increased consumption of CH4. Moreover, for red soils with sandy loam texture, as in the present study, CH4 oxidation under urea-based fertilization is likely further simulated by partially aerobic soil conditions due to the porous and percolating nature of soil8. In contrast to rice paddies, no significant effect of fertilization on CH4 fluxes was observed in the citrus orchard, which was in agreement with previous studies of upland cultivation areas30, 50, 51, probably because both CH4 production and oxidation are simultaneously affected by N fertilization17, 50. Consistent with numerous previous studies conducted in paddy fields and upland orchard8, 28, 39, N2O emissions were significantly enhanced by fertilization in both land-use types in this study. These were mainly due to the fact that fertilizer application can markedly increase the soil inorganic content, as also shown in our study (Table 1), thereby providing sufficient substrate for microbial nitrification and denitrification for the production of N2O7–9, 18. The emission factors for N2O were estimated to be 0.47–0.96% and 1.29–1.99% for the rice paddy and citrus orchard, respectively. These results are comparable to previous estimates from paddy fields5, 8, 25 and upland orchard6, 18, 39. However, large discrepancies in observed EFd for N2O in upland orchard, ranging from 0.2–2.2%, have been observed in earlier publications18, 20, 39, 52 likely due to the relatively short-term measurements and course sampling intervals, as well as the differences in the usage of the “baseline39”, i.e., background emission.
The average annual CO2-eq emissions of CH4 and N2O was 15.43 t CO2-eq ha−1 for rice paddies over the three cultivation years, similar to values reported in previous studies conducted in the same regions3, 8, 28, 30. These values are also within the range of 75–22,237 kg CO2-eq ha−1 for rice paddies reported by Linquist et al.53, who estimated aggregate emissions of CH4 and N2O by collecting 328 measurements globally. However, the annual CO2-eq emissions were significantly reduced following the conversion of rice paddies to a citrus orchard (Table 2), indicating that the effect of significantly reduced CH4 emissions was only marginally offset by the simultaneously increased N2O emissions after land-use conversion. In general, the economic benefits from upland orchard and vegetables were higher than those from rice paddies in our study region6, 30. Therefore, lower climate impacts but higher economic incomes can be achieved synchronously by the conversion of rice paddies to citrus orchards in this region. Moreover, the application of fertilizer had no significant effect on the CO2-eq emissions in rice paddies, which is consistent with the hypothesis of Zou et al.25, who surmised that fertilization generally depresses or dose not influence aggregate emissions of CH4 and N2O from rice paddies, depending on the fertilizer application rate. However, fertilization resulted in significantly higher CO2-eq emissions in the citrus orchard, which can be explained by the substantial increase in N2O emissions due to higher input of mineral N. It is noteworthy that our analysis of CO2-eq emissions did not include the net exchange of CO2 between agroecosystems and the atmosphere or changes in soil organic carbon. Results from the literature indicated that rice paddies are usually found to be a weak atmospheric CO2 sink47 and that carbon sink strength is typically lower than that of mature orchards54. Meanwhile, numerous studies have reported that changes in soil organic C are difficult to detect because the magnitude of change is small during several years and because there is a high degree of spatial variation9, 11. Therefore, more long-term studies including measurements of the climatically important C- and N-trace gas fluxes (CO2, N2O and CH4) and estimates of changes in soil organic C are needed to provide a complete evaluation of the overall GHG balance during land-use conversion.
In conclusion, this study provided insight into the integrated evaluation of CH4 and N2O fluxes and their relationships with management practices following the conversion of rice paddies to a citrus orchard over three consecutive cultivation years in a typical red soil region of southern China. Our results not only confirmed that land-use conversion from rice paddy to citrus orchard significantly decreased CH4 emissions and increased N2O emissions, but also demonstrated that the citrus orchard could persist as a source for atmospheric CH4 for several weeks after conversion from paddy fields and then gradually shift to a CH4 sink with increasing oxidation capacity over the three cultivation years. Thus, our results highlighted the importance of measurements during the initial stages following land-use conversion and suggested additional long-term continuous observations over several years after conversion. The substantial changes in CH4 and N2O fluxes following land-use conversion were mainly due to significant alterations in soil environmental conditions (i.e., shifting from anaerobic to aerobic) and soil properties originating from the remarkably different management practices between the two land-use types. Moreover, fertilization significantly increased N2O emissions from both land-use types but substantially reduced CH4 emissions from the rice paddies and had no significant effect on CH4 fluxes in the citrus orchard. As a result, the CO2-eq emissions of CH4 and N2O were significantly reduced following the conversion of rice paddies to citrus orchard, irrespective of fertilization. Overall, reduced aggregate CH4 and N2O emissions and higher economic benefits can be achieved simultaneously by the conversion of rice paddies to citrus orchards in this red soil region.
Materials and Methods
Study site
The experimental site is located at the Qianyanzhou Ecological Research Station (26°44′N, 115°04′E) of the Chinese Academy of Science in Jiangxi Province, southern China. This site has a subtropical monsoon climate with a mean annual air temperature of 18.0 °C and a mean annual precipitation of approximately 1509.0 mm during 1989–20106. The soil type is typical red soil found in middle-subtropical China, classified as Ultisols and some of the Alfisols and Oxisols based on soil taxonomy of the USA18. The soil texture is sandy loam, with 58% sand, 31% silt, and 11% clay. Double cropping of rice paddy is the main cropping system in this region, with late rice (late July to late November), a fallow period (late November to next late April), and early rice (late April to late July) in rotation. Other soil properties both before and 3 years after land-use conversion are shown in Table 1.
Experimental design
The two most prevalent agricultural land uses in our study area were selected, namely, rice paddy (Oryza sativa L.) and citrus orchard (Citrus reticulata). The experimental site was previously paddy fields for more than 10 years and had been partly converted to a citrus orchard in June 2012. Under each land-use type, two fertilizer treatments (i.e., conventional fertilization and no fertilization) were established. The conventional fertilization treatment followed the local cropping regimes and farmer fertilization practices. The fertilizers used were compound fertilizer (15% N) and urea (46% N). The other treatment was a control without fertilization, with additional management practices being the same as for the fertilization treatment. Therefore, four treatments were established: citrus orchard with fertilization (OF) and without fertilization (ONF) and rice paddy with fertilization (PF) and without fertilization (PNF). All treatments were arranged in a randomized block design with four replicates, for a total of 16 experimental plots (12 × 14 m) that were separated by buffer strips. In the PF, compound fertilizer was applied before rice transplanting, and urea was applied in the form of top dressing at the tillering stage, whereas in the OF, compound fertilizer combined with urea was uniformly spread on the soil surface. To ensure survival and yield, a floodwater layer of 5–7 cm in depth was maintained in the paddy fields until mid-season drainage, and basal fertilizer was amended to a depth of 50 cm before the citrus orchard was established. Details of the cultivation and fertilization practices during the study period are shown in Table S1.
CH4 and N2O flux measurement
Fluxes of CH4 and N2O were simultaneously measured from June 2012 until July 2015 using a static opaque chamber-gas chromatograph (GC) method as described in Yao et al.8. and Zheng et al.55. A stainless steel collar (diameter = 40 cm) was pre-installed in the centre of each plot before rice transplanting or orchard planting. The top edge of the collar contains a groove (5 cm in depth) filled with water to seal the rim of a chamber during gas collection. Cylindrical sampling chambers with a diameter of 40 cm and height of 0.39 or 0.69 m (according to the plant height) were covered with a layer of thermal insulation to minimize air temperature changes inside the chamber and equipped with a circulating fan to ensure complete gas mixing during the gas sampling period. The base frames were kept in the same location throughout the entire measurement period in the orchard plots, whereas those in the paddy fields were removed before tillage and placed (24 h before the measurement) in the location marked for subsequent measurements.
Gas samples were taken daily for 5 days after fertilization and once or twice per week for the remaining period and were collected between 09:00–11:00 AM local time. Five air samples were taken from the headspace of each chamber at an interval of 10 min after chamber closure using plastic syringes attached to a three-way stopcock and were stored at room temperature for analysis within a few hours. The chamber headspace temperature was recorded for gas density correction in the flux calculation using a thermometer. The concentrations of CH4 and N2O were determined by a gas chromatography (Agilent 7890 A, California, USA) equipped with a flame ionization detector (FID) and an electron capture detector (ECD), respectively, as detailed in previous studies6, 55, 56. The fluxes were calculated based on the slope of linear or nonlinear regression between concentration and time and were determined as the mean of the four fluxes from the four spatial replications. Annual cumulative CH4 and N2O fluxes were sequentially computed from the fluxes between every two adjacent intervals of measurements and were estimated by linear interpolation6, 8. The fertilizer-induced direct emission factors (EFd) for N2O were calculated by subtracting the total cumulative emissions of N2O in the control treatments from the corresponding cumulative emissions in the fertilized treatments and dividing the result by the fertilizer application rate5. For calculating the GHG balance, annual CH4 and N2O fluxes were converted into CO2 equivalents, taking into account the specific radiative forcing potential of 298 for N2O and 34 for CH4 relative to CO2 for a 100-year time horizon1.
Auxiliary measurements
Daily precipitation and air temperature were obtained from the Qianyanzhou meteorological station. The soil temperature and moisture (0–10 cm) for each plot were measured using a potable digital thermometer (JM624, Tianjin, China) and a moisture probe meter (TDR100, Spectrum, USA), respectively. Soil water-filled pore space (WFPS) was calculated from the bulk density (BD) and volumetric soil water content using a particle density of 2.65 g cm−3. Floodwater depths in the paddy were measured daily during the flooding period using a ruler. Soil samples (0–10 cm) were collected prior to land-use conversion to determine background information and once per month or every two months between June 2012 and July 2015 for physiochemical property measurements. Soil pH was measured at a soil:water ratio of 1:2.5 using a pH meter. Soil total nitrogen (TN) and dissolved organic carbon (DOC) were determined using an automated C and N analyzer (Elementar, Hanau, Germany). Soil ammonium (NH4 +−N) and nitrate (NO3 –−N) were extracted from 20 g of fresh soil with 1 M KCl (soil:water = 1:5 w/v) and quantified colourimetrically using a flow injection analyzer (Seal AA3, Norderstedt, Germany).
Statistical analyses
All data are presented as the mean and standard error of mean unless otherwise stated. Analysis of variance (ANOVA) was used to examine differences in soil properties among the four treatments. The impacts of land-use conversion, fertilization and year on CH4 and N2O fluxes were conducted using general linear models for analysis of variance together with the least significant difference test. The relationships between trace gas fluxes and soil properties were evaluated using a nonlinear regression model. SPSS 20.0 statistical software (IBM Co., New York, USA) was used to conduct statistical analyses. The figures were prepared using Origin 8.5 software (Origin Lab Corporation, USA).
Electronic supplementary material
Acknowledgements
This study was supported by the National Key Research and Development Program of China (2016YFC0502102), the National Natural Science Foundation of China (41471095), and the Ministry of Science and Technology of China (2012CB417103). We would like to thank the staffs from Qianyanzhou Experimental Station for their fruitful help in field sampling. Special thanks go to the anonymous reviewers for constructive comments on the previous version of the manuscript.
Author Contributions
X.W., X.Z., G.L. and B.F. conceived and designed the experiments; X.W., H.L. and S.W. performed the experiment; and X.W., F.L. and Z.L. analysed the data and wrote the manuscript. All authors reviewed and discussed the manuscript.
Competing Interests
The authors declare that they have no competing interests.
Footnotes
Electronic supplementary material
Supplementary information accompanies this paper at doi:10.1038/s41598-017-10806-z
Publisher's note: Springer Nature remains neutral with regard to jurisdictional claims in published maps and institutional affiliations.
Contributor Information
Xing Wu, Email: xingwu@rcees.ac.cn.
Bojie Fu, Email: bfu@rcees.ac.cn.
References
- 1.IPCC. In: Climate Change 2013: The Physical Science Basis. Contribution of Working Group I to the Fifth Assessment Report of the Intergovernmental Panel on Climate Change (eds T. F. Stocker et al.) 5–14 (Cambridge University Press, 2013).
- 2.Forster, P. et al. Changes in atmospheric constituents and in radiative forcing. In: Climate Change 2007: The physical Science Basis. Contribution of Working Group I to the Fourth Assessment Report of the Intergovernmental Panel on Climate Change (eds. S. Solomon et al.) 129–234. (Cambridge University Press, 2007).
- 3.Sun H, et al. A two-year field measurement of methane and nitrous oxide fluxes from rice paddies under contrasting climate conditions. Sci. Rep. 2016;6 doi: 10.1038/srep28255. [DOI] [PMC free article] [PubMed] [Google Scholar]
- 4.Hou H, Peng S, Xu J, Yang S, Mao Z. Seasonal variations of CH4 and N2O emissions in response to water management of paddy fields located in Southeast China. Chemosphere. 2012;89:884–892. doi: 10.1016/j.chemosphere.2012.04.066. [DOI] [PubMed] [Google Scholar]
- 5.Zou J, Huang Y, Zheng X, Wang Y. Quantifying direct N2O emissions in paddy fields during rice growing season in mainland China: dependence on water regime. Atmos. Environ. 2007;41:8030–8042. doi: 10.1016/j.atmosenv.2007.06.049. [DOI] [Google Scholar]
- 6.Liu H, et al. Effects of land use conversion and fertilization on CH4 and N2O fluxes from typical hilly red soil. Environ. Sci. Pollut. Res. 2016;23:20269–20280. doi: 10.1007/s11356-016-7239-3. [DOI] [PubMed] [Google Scholar]
- 7.Zhang Y, et al. Response of nitric and nitrous oxide fluxes to N fertilizer application in greenhouse vegetable cropping systems in southeast China. Sci. Rep. 2016;6 doi: 10.1038/srep20700. [DOI] [PMC free article] [PubMed] [Google Scholar]
- 8.Yao Z, et al. Greenhouse gas fluxes and NO release from a Chinese subtropical rice-winter wheat rotation system under nitrogen fertilizer management. J. Geophys. Res. 2013;118:623–638. doi: 10.1002/jgrg.20061. [DOI] [Google Scholar]
- 9.Weller S, et al. Greenhouse gas emissions and global warming potential of traditional and diversified tropical rice rotation systems. Global Change Biol. 2016;22:432–448. doi: 10.1111/gcb.13099. [DOI] [PubMed] [Google Scholar]
- 10.Stevens CJ. & Quinton, J. N. Policy implications of pollution swapping. Phys. Chem. Earth. 2009;34:589–594. doi: 10.1016/j.pce.2008.01.001. [DOI] [Google Scholar]
- 11.Don A, Schumacher J, Freibauer A. Impact of tropical land-use change on soil organic carbon stocks–a meta-analysis. Global Change Biol. 2011;17:1658–1670. doi: 10.1111/j.1365-2486.2010.02336.x. [DOI] [Google Scholar]
- 12.Wu X, et al. Effects of soil moisture and temperature on CO2 and CH4 soil-atmosphere exchange of various land use/cover types in a semi-arid grassland in Inner Mongolia, China. Soil Biol. Biochem. 2010;42:773–787. doi: 10.1016/j.soilbio.2010.01.013. [DOI] [Google Scholar]
- 13.Petitjean C, et al. Soil N2O emissions in French Guiana after the conversion of tropical forest to agriculture with the chop-and-mulch method. Agric. Ecosyst. Environ. 2015;208:64–74. doi: 10.1016/j.agee.2015.04.004. [DOI] [Google Scholar]
- 14.Jiang C, Wang Y, Hao Q, Song C. Effect of land-use change on CH4 and N2O emissions from freshwater marsh in Northeast China. Atmos. Environ. 2009;43:3305–3309. doi: 10.1016/j.atmosenv.2009.04.020. [DOI] [Google Scholar]
- 15.Liu S, et al. Methane and nitrous oxide emissions reduced following conversion of rice paddies to inland crab-fish aquaculture in Southeast China. Environ. Sci. Technol. 2016;50:633–642. doi: 10.1021/acs.est.5b04343. [DOI] [PubMed] [Google Scholar]
- 16.Inubushi K, Furukawa Y, Hadi A, Purnomo E, Tsuruta H. Seasonal changes of CO2, CH4 and N2O fluxes in relation to land-use change in tropical peatlands located in coastal area of South Kalimantan. Chemosphere. 2003;52:603–608. doi: 10.1016/S0045-6535(03)00242-X. [DOI] [PubMed] [Google Scholar]
- 17.Tate KR. Soil methane oxidation and land-use change–from process to mitigation. Soil Biol. Biochem. 2015;80:260–272. doi: 10.1016/j.soilbio.2014.10.010. [DOI] [Google Scholar]
- 18.Lin S, et al. Differences in nitrous oxide fluxes from red soil under different land uses in mid-subtropical China. Agric. Ecosyst. Environ. 2012;146:168–178. doi: 10.1016/j.agee.2011.10.024. [DOI] [Google Scholar]
- 19.Iqbal J, Lin S, Hu R, Feng M. Temporal variability of soil-atmospheric CO2 and CH4 fluxes from different land uses in mid-subtropical China. Atmos. Environ. 2009;43:5865–5875. doi: 10.1016/j.atmosenv.2009.08.025. [DOI] [Google Scholar]
- 20.Liu H, et al. Greenhouse gas fluxes from soils of different land-use types in a hilly area of South China. Agric. Ecosyst. Environ. 2008;124:125–135. doi: 10.1016/j.agee.2007.09.002. [DOI] [Google Scholar]
- 21.Merino A, Perez-Batallon P, Macias F. Responses of soil organic matter and greenhouse gas fluxes to soil management and land use changes in a humid temperate region of southern Europe. Soil Biol. Biochem. 2004;36:917–925. doi: 10.1016/j.soilbio.2004.02.006. [DOI] [Google Scholar]
- 22.Zhang W, Yu Y, Huang Y, Li T, Wang P. Modeling methane emissions from irrigated rice cultivation in China from 1960 to 2050. Global Change Biol. 2011;17:3511–3523. doi: 10.1111/j.1365-2486.2011.02495.x. [DOI] [Google Scholar]
- 23.Yan X, Akiyama H, Yagi K, Akimoto H. Global estimations of the inventory and mitigation potential of methane emissions from rice cultivation conducted using the 2006 Intergovermental Panel on Climate Change Guidelines. Global Biogeochem. Cy. 2009;23 doi: 10.1029/2008GB003299. [DOI] [Google Scholar]
- 24.Zhou F, et al. New model for capturing the variations of fertilizer-induced emission factors of N2O. Global Biogeochem. Cy. 2015;29:885–897. doi: 10.1002/2014GB005046. [DOI] [Google Scholar]
- 25.Zou J, Huang Y, Jiang J, Zheng X, Sass RL. A 3-year field measurement of methane and nitrous oxide emissions from rice paddies in China: Effects of water regime, crop residue, and fertilizer application. Global Biogeochem. Cy. 2005;19 doi: 10.1029/2004GB002401. [DOI] [Google Scholar]
- 26.Lou Y, Li Z, Zhang T. Carbon dioxide flux in a subtropical agricultural soil of China. Water Air Soil Pollut. 2003;149:281–293. doi: 10.1023/A:1025727504841. [DOI] [Google Scholar]
- 27.Zou J, Liu S, Qin Y, Pan G, Zhu D. Sewage irrigation increased methane and nitrous oxide emissions from rice paddies in southeast China. Agric. Ecosyst. Environ. 2009;129:516–522. doi: 10.1016/j.agee.2008.11.006. [DOI] [Google Scholar]
- 28.Shang Q, et al. Net annual global warming potential and greenhouse gas intensity in Chinese double rice-cropping systems: a 3-year field measurement in long-term fertilizer experiments. Global Change Biol. 2011;17:2196–2210. doi: 10.1111/j.1365-2486.2010.02374.x. [DOI] [Google Scholar]
- 29.Nishimura S, et al. Combined emission of CH4 and N2O from a paddy field was reduced by preceding upland crop cultivation. Soil Sci. Plant Nutr. 2011;57:167–178. doi: 10.1080/00380768.2010.551346. [DOI] [Google Scholar]
- 30.Yuan Y, et al. Effects of land-use conversion from double rice cropping to vegetables on methane and nitrous oxide fluxes in southern China. PLoS ONE. 2016;11 doi: 10.1371/journal.pone.0155926. [DOI] [PMC free article] [PubMed] [Google Scholar]
- 31.Eusufzai MK, et al. Methane emission from rice fields as affected by land use change. Agric. Ecosyst. Environ. 2010;139:742–748. doi: 10.1016/j.agee.2010.11.003. [DOI] [Google Scholar]
- 32.Simona C, et al. Nitrous oxide and methane fluxes from soils of the Orinoco savanna under different land uses. Global Change Biol. 2004;10:1947–1960. doi: 10.1111/j.1365-2486.2004.00871.x. [DOI] [Google Scholar]
- 33.Scheer C, et al. Methane and nitrous oxide fluxes in annual and perennial land-use systems of the irrigated areas in the Aral Sea Basin. Global Change Biol. 2008;14:2454–2468. doi: 10.1111/j.1365-2486.2008.01631.x. [DOI] [Google Scholar]
- 34.Meurer KHE, et al. Direct nitrous oxide (N2O) fluxes from soils under different land use in Brazil—a critical review. Environ. Res. Lett. 2016;11 doi: 10.1088/1748-9326/11/2/023001. [DOI] [Google Scholar]
- 35.Keith AM, Rowe RL, Parmar K, et al. Implications of land use change to Short Rotation Forestry in Great Britain for soil and biomass carbon. GCB Bioenergy. 2014;7:541–552. doi: 10.1111/gcbb.12168. [DOI] [Google Scholar]
- 36.Harris ZM, Spake R, Taylor G. Land use change to bioenergy: A meta-analysis of soil carbon and GHG emissions. Biomass and Bioenergy. 2015;82:27–39. doi: 10.1016/j.biombioe.2015.05.008. [DOI] [Google Scholar]
- 37.Cai Z, Tsuruta H, Minami K. Methane emission from rice fields in China: measurements and influencing factors. J. Geophys. Res. 2000;105:17231–17242. doi: 10.1029/2000JD900014. [DOI] [Google Scholar]
- 38.Khalil MAK, Shearer MJ, Rasmussen RA, Xu L, Liu J. Methane and nitrous oxide emissions from subtropical rice agriculture in China. J. Geophys. Res. 2008;113 [Google Scholar]
- 39.Rowlings DW, Grace PR, Scheer C, Kiese R. Influence of nitrogen fertiliser application and timing on greenhouse gas emissions from a lychee (Litchi chinensis) orchard in humid subtropical Australia. Agric. Ecosyst. Environ. 2013;179:168–178. doi: 10.1016/j.agee.2013.08.013. [DOI] [Google Scholar]
- 40.Zona D, et al. Fluxes of the greenhouse gases (CO2, CH4 and N2O) above a short-rotation poplar plantation after conversion from agricultural land. Agr. Forest Meteorol. 2013;169:100–110. doi: 10.1016/j.agrformet.2012.10.008. [DOI] [Google Scholar]
- 41.Ojima DS, Valentine DW, Mosier AR, Parton WJ, Schimel DS. Effect of land-use change on methane oxidation in temperate forest and grassland soils. Chemosphere. 1993;26:675–685. doi: 10.1016/0045-6535(93)90452-B. [DOI] [Google Scholar]
- 42.Wu X, et al. Long-term effects of clear-cutting and selective cutting on soil methane fluxes in a temperate spruce forest in southern Germany. Environ. Pollut. 2011;159:2467–2475. doi: 10.1016/j.envpol.2011.06.025. [DOI] [PubMed] [Google Scholar]
- 43.Roy KS, Neogi S, Nayak AK, Bhattacharyya P. Effect of nitrogen fertilization on methane and carbon dioxide production potential in relation to labile carbon pools in tropical flooded rice soils in eastern India. Arch. Agron. Soil Sci. 2014;60:1329–1344. doi: 10.1080/03650340.2013.869673. [DOI] [Google Scholar]
- 44.Liu H, et al. Responses of soil methanogens, methanotrophs, and methane fluxes to land-use conversion and fertilization in a hilly red soil region of southern China. Environ. Sci. Pollut. Res. 2017;24:8731–8743. doi: 10.1007/s11356-017-8628-y. [DOI] [PubMed] [Google Scholar]
- 45.Liu D, et al. Effect of paddy-upland rotation on methanogenic archaeal community structure in paddy field soil. Microb. Ecol. 2015;69:160–168. doi: 10.1007/s00248-014-0477-3. [DOI] [PubMed] [Google Scholar]
- 46.Breidenbach B, Blaser MB, Klose M, Conrad R. Crop rotation of flooded rice with upland maize impacts the resident and active methanogenic microbial community. Environ. Microb. 2015;18:2868–2885. doi: 10.1111/1462-2920.13041. [DOI] [PubMed] [Google Scholar]
- 47.Knox SH, et al. Agricultural peatland restoration: effects of land-use change on greenhouse gas (CO2 and CH4) fluxes in the Sacramento-San Joaquin Delta. Global Change Biol. 2015;21:750–765. doi: 10.1111/gcb.12745. [DOI] [PubMed] [Google Scholar]
- 48.Cai Z, Shan Y, Xu H. Effects of nitrogen fertilization on CH4 emissions from rice fields. Soil Sci. Plant Nutr. 2007;53:353–361. doi: 10.1111/j.1747-0765.2007.00153.x. [DOI] [Google Scholar]
- 49.Bodelier PLE, Roslev P, Henckel T, Frenzel P. Stimulation by ammonium-based fertilizers of methane oxidation in soil around soil roots. Nature. 2000;403:421–424. doi: 10.1038/35000193. [DOI] [PubMed] [Google Scholar]
- 50.Reay DS, Nedwell DB. Methane oxidation in temperate soils: effects of inorganic N. Soil Biol. Biochem. 2004;36:2059–2065. doi: 10.1016/j.soilbio.2004.06.002. [DOI] [Google Scholar]
- 51.Wang L, et al. The influence of nitrogen fertiliser rate and crop rotation on soil methane flux in rain-fed potato fields in Wuchuan County, China. Sci. Total Environ. 2015;537:93–99. doi: 10.1016/j.scitotenv.2015.08.003. [DOI] [PubMed] [Google Scholar]
- 52.Huang X, Grace P, Weier K, Mengersen K. Nitrous oxide emissions from subtropical horticultural soils: a time series analysis. Soil Research. 2012;50:596–606. doi: 10.1071/SR11100. [DOI] [Google Scholar]
- 53.Linquist B, van Groenigen KJ, Adviento-Borbe MA, Pittelkow C, van Kessel C. An agronomic assessment of greenhouse gas emissions from major cereal crops. Global Change Biol. 2012;18:194–209. doi: 10.1111/j.1365-2486.2011.02502.x. [DOI] [Google Scholar]
- 54.Zanotelli D, Montagnani L, Manca G, Scandellari F, Tagliavini M. Net ecosystem carbon balance of an apple orchard. Eur. J. Agron. 2015;63:97–104. doi: 10.1016/j.eja.2014.12.002. [DOI] [Google Scholar]
- 55.Zheng X, et al. Quantification of N2O fluxes from soil-plant systems may biased by the applied gas chromatograph methodology. Plant Soil. 2008;311:211–234. doi: 10.1007/s11104-008-9673-6. [DOI] [Google Scholar]
- 56.Wu X, Brüggemann N, Butterbach-Bahl K, Fu B, Liu G. Snow cover and soil moisture controls of freeze-thaw-related soil gas fluxes from a typical semi-arid grassland soil: a laboratory experiment. Biol. Fertil. Soils. 2014;50:295–306. doi: 10.1007/s00374-013-0853-z. [DOI] [Google Scholar]
Associated Data
This section collects any data citations, data availability statements, or supplementary materials included in this article.