Supplemental Digital Content is available in the text
Keywords: age, clinical biomechanics, gait, multi-segment foot model, speed
Abstract
Background:
The effects of age and speed on foot and ankle kinematics in gait studies using foot models are not fully understood, whereas this can have significant influence. We analyzed these variables with the 4-segment Oxford foot model.
Methods:
Twenty-one healthy subjects (aged 20–65 years) were recruited for gait analysis. The effect of speed on foot and ankle kinematics was assessed by comparing results during slow walking and fast walking. To assess the effect of age, a group of 13 healthy young adults (aged 20–24 years) were compared with a group of 8 older adults (aged 53–65 years). Also, the interaction between age and speed was analyzed.
Results:
Regarding speed, there was a significant difference between forefoot/hindfoot motion in the sagittal plane (flexion/extension) during both loading- and push-off phase (P = .004, P < .001). Between hindfoot/tibia, there was a significant difference for all parameters except for motion in the sagittal plane (flexion/extension) during push-off phase (P = .5). Age did not significantly influence kinematics. There was no interaction between age and speed.
Conclusion:
Our analysis found that speed significantly influenced the kinematic outcome parameters. This was more pronounced in the ankle joint. In contrast, no significant differences were found between younger and older healthy subjects.
1. Introduction
Kinematic models are increasingly used for biomechanical evaluation of the foot and ankle in healthy subjects and patients after injury.[1–9] However, the effect of age and speed on foot and ankle kinematics are not fully understood.[4,10–12]
A number of studies on age-related differences in foot kinematics have been performed, with inconclusive results. Kerrigan et al[4] found reduced peak plantar flexion in the ankle joint of older adults (65–84 years) compared with young adults (18–36 years) using a single-segment foot model. In contrast, a study using a 4-segment foot model by Legault-Moore et al[13] found no significant differences in gait parameters between 11 healthy young subjects (18–30 years) and 11 healthy elderly subjects (>55 years). A more recent study with a 5-segment foot model found that older adults (average 73.2 years) had different foot kinematics than younger adults (average 23.2 years) during walking, with reduced mobility of the calcaneus, midfoot, metatarsus, and changes in the angular position of the hindfoot.[14]
Studies analyzing the effect of speed on foot kinematics have found that speed significantly influences foot and ankle kinematics.[15–21] Dubbeldam et al[22] used a multi-segment foot model (MSFM) to study foot and ankle kinematics in 14 healthy young subjects, and found that walking speed significantly affected foot and ankle kinematics, leading to higher range of motion (ROM) with higher speed. However, speed alone does not fully explain the changes in foot and ankle kinematics and it is unknown whether speed influences foot kinematics differently in different age groups.[23] To our knowledge, no previous studies reported results on both age and speed and their interaction on foot and ankle kinematics using a MSFM.
The aim of the present prospective study was, therefore, to investigate the role of age and speed on foot and ankle kinematics, using the 4-segment Oxford foot model (OFM). In addition, the interaction between age and speed was analyzed. Our hypothesis was that age (negatively, less ROM) and speed (positively, more ROM) significantly influence foot and ankle kinematics and that speed has less impact on foot and ankle kinematics in older adults. A better understanding of the effects of age and speed and the interaction between age and speed in normal subjects would allow foot and ankle kinematics in pathologic feet to be interpreted more accurately.
2. Methods
2.1. Study population
In this prospective study, healthy subjects were randomly recruited around the Maastricht University for gait analysis of the foot and ankle at the movement laboratory. Only healthy subjects of working age (18–65 years old), while most clinical studies focus on this group, with no previous injury to the lower extremity or neurological diseases, with no limitations in daily life and sport exercise every week were included.[8,24] Based on previous studies a minimum of 15 subjects were needed to investigate speed on foot and ankle kinematics.[4,12,13,22]
To analyze the effect of age, the same group of subjects was used and was divided in 2 groups. Based on previous age-related studies, an age gap of at least 30 years was chosen between a younger adults group and an older adults group.[4,12,13] This was achieved by including only persons aged 18 to 25 years and those aged 55 to 65 years. Exclusion criteria were a history of ankle, foot or leg injuries or operations, arthritis, anatomical abnormalities (e.g., pes planus, pes cavus, or congenital abnormalities), diabetes, peripheral neuropathy, and spinal or neurological injuries.
Finally 21 subjects, who met the inclusion criteria, were willing to participate in this study. Those 21 were used to analyze the effect of speed. Of them13 patients were included in the younger adults group and 8 in the older adults group to analyze the effect of age. All measurements were performed by 1 independent researcher who was experienced in examining the foot and using the OFM. All subjects signed an informed consent form. This study was approved by the medical ethics committee of the Maastricht University Medical Centre (MEC azM/UM).
2.2. Equipment
Motion capture was conducted using the VICON system (Vicon Motion Systems Ltd., Oxford, UK), which comprises 8 cameras (6 MX3 and 2 T20 running at 200 Hz). Markers were placed according the OFM guidelines.[25–28] Subjects were asked to walk on a 10 m platform with a force platform (Kistler 9282E) in the middle to identify the foot contact with the floor. Vicon NEXUS 1.8 was used to visualize and process the 3D motions. The OFM gait analysis data (8 trials) were generated with Matlab (version 7.12, 2011) and processed in Excel (Microsoft, 2010). Results beyond 2 standard deviations were removed. Randomly 6 trials were used to calculate means. Means were further analyzed with SPSS (IBM Statistics, version 20).
2.3. Protocol
Twenty-one subjects were invited to the movement laboratory and underwent a physical examination assessing body mass, height, leg length, knee width, and ankle width. After placing of all 42 (14 mm) reflective markers, 1 static trial was performed.[25–28] Subsequently, dynamic trials were conducted with subjects walking barefoot on 10 m catwalk at self-selected “normal,” “slow,” and “fast” speed. Eight proper recordings for each condition were made during walking, in which the subjects hit the center of the force plate. With a stopwatch time and speed was controlled by the researcher. To correct for foot dominance, in the first 50% of the group (10 subjects) both feet were analyzed.[29,30] This were 4 persons from the younger adults group and 6 from the older adults group.
The effect of speed on foot and ankle kinematics was evaluated by analyzing data of all 21 subjects (31 feet). Outcome parameters during slow walking were compared with those during fast walking. To test the effect of age on foot and ankle kinematics results of 13 younger adults (17 feet) were compared with the results of 8 older adults (14 feet). One step per trial was evaluated, from heel strike to toe-off, and each step was divided into 2 parts, a loading phase (from heel strike to midstance or 0–50%) and a push-off phase (from midstance to toe-off or 50–100%). The force plate was used to determine the heel-strike and toe-off phases during walking. Intersegment angles during locomotion were analyzed for the forefoot and hindfoot and for the hindfoot and tibia, in all planes (sagittal, frontal and transverse, representing flexion/extension, abduction/adduction, and inversion/eversion, respectively).[31,32]
2.4. Statistical analysis
Characteristics (age, body mass, height) of the healthy subjects are presented with descriptive statistics. The ROM results are presented as mean ± standard deviation (SD) (minimum–maximum) and calculated with descriptive statistics. Wilcoxon signed rank test was used to compare the mean values of the parameters for slow versus fast walking speed. The Mann–Whitney U test was used to compare the kinematic parameters between younger and older healthy subjects. For these results, a P value below .05 was considered to be statistically significant. Repeated measures Anova test was used to analyze the interaction between age and speed.
3. Results
3.1. Healthy subject characteristics
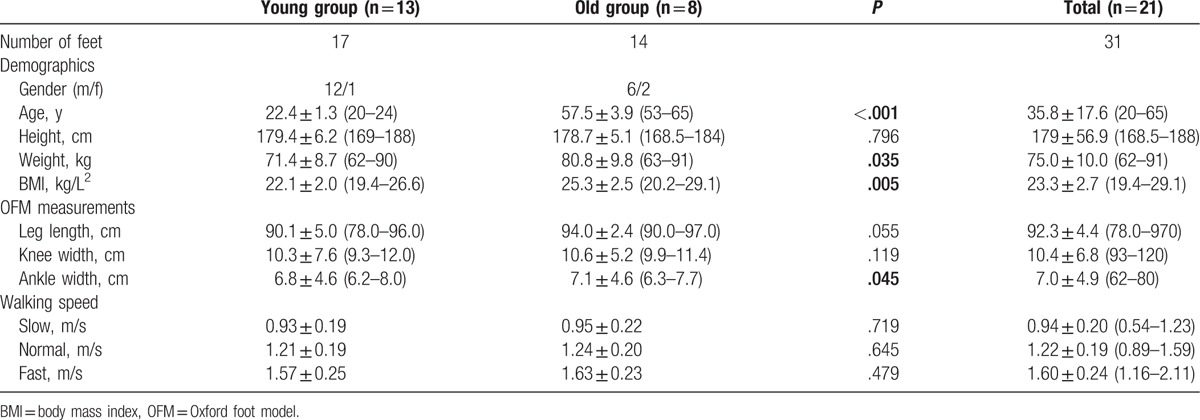
Table 1 lists the participants’ characteristics. The analysis included 21 healthy subjects (31 feet; aged 20–65 years) with 13 (17 feet) younger adults (20–24 years) and 8 (14 feet) older adults (53–65 years). There was a significant difference in age (P < .001) between the younger adult group and the older adult group. Other significant differences between the younger and older adults groups were found for body mass index (BMI), weight, and ankle width, which were higher in the older adults group (P = .005, P = .035, and P = .045, respectively). No significant differences in walking speed were found between the 2 groups as regards slow, normal, or fast walking (P = .719, P = .645, and P = .479, respectively).
Table 1.
Patient characteristics.
3.2. Effect of speed
Table 2 presents the foot and ankle kinematics between the forefoot and hindfoot and between the hindfoot and tibia during slow and fast walking (0.94 ± 0.20 vs 1.60 ± 0.24, P < .001) in 21 healthy subjects. There was a significant difference between the slow and fast speeds as regards ROM between forefoot and hindfoot in the sagittal plane (flexion/extension), during both the loading phase and the push-off phase (P = .004 and P < .001). See, Fig. 1.
Table 2.
Effect of speed.
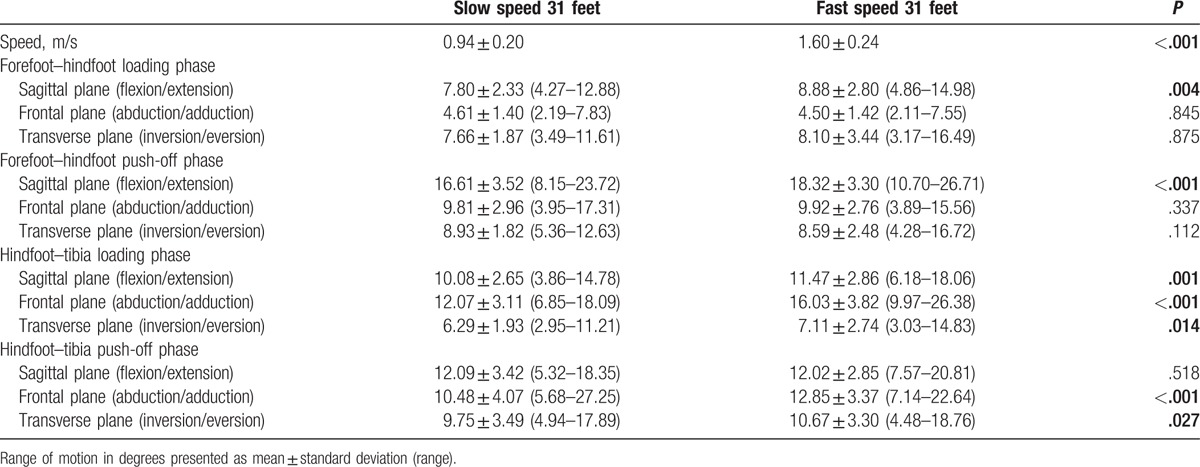
Figure 1.
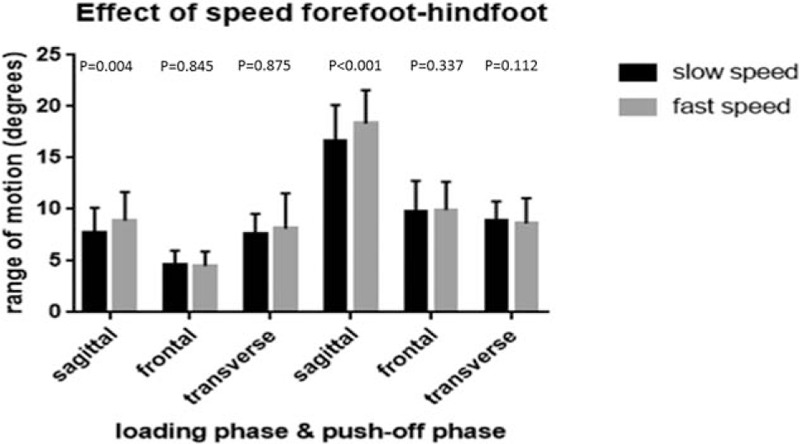
Range of motion between forefoot and hindfoot in subjects during slow (black) and fast (grey) walking during loading phase and push-off phase in sagittal (flexion/extension), frontal (abduction/adduction), and transverse (inversion/eversion) plane.
There was also a significant difference between slow and fast speed as regards the ROM between the hindfoot and tibia in the sagittal plane (flexion/extension) during the loading phase (P = .001), in the frontal plane (abduction/adduction) during the loading and push-off phases (P < .001 and P < .001), and in the transverse plane (inversion/eversion) during the loading and push-off phases (P = .014 and P = .027). There was no significant difference between the slow and fast speeds as regards the ROM in the sagittal plane (flexion/extension) during the push-off phase (P = .518). During fast walking, ROM increased most in the ankle. See, Fig. 2.
Figure 2.
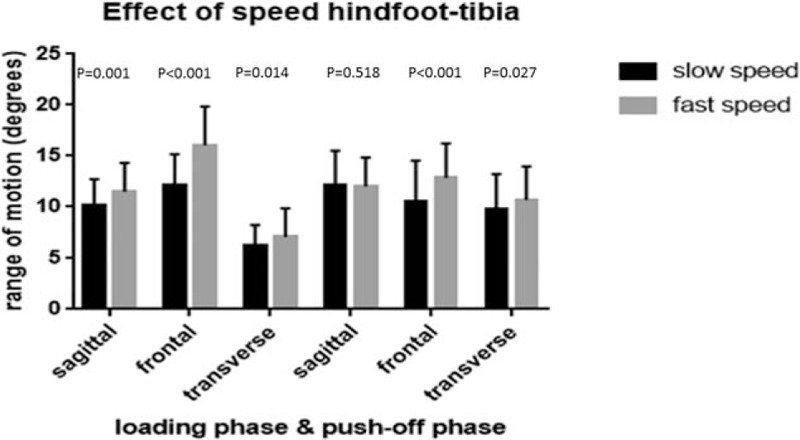
Range of motion between hindfoot and tibia in subjects during slow (black) and fast (grey) walking during loading phase and push-off phase in sagittal (flexion/extension), frontal (abduction/adduction), and transverse (inversion/eversion) plane.
3.3. Effect of age
The foot and ankle kinematics between forefoot/hindfoot and hindfoot/tibia are listed in Table 3 for the younger and older adults groups during normal speed. There was no significant difference in speed between the 2 groups during normal speed (1.21 vs 1.24 P = .645). There were no significant differences between the younger and older adults groups regarding the ROM between the forefoot and hindfoot in the sagittal, frontal, and transverse planes, neither during the loading phase nor during the push-off phase. Nor were there significant differences between the 2 groups in ROM between the hindfoot and tibia in the sagittal, frontal, and transverse planes, neither during the loading phase nor during the push-off phase Figs. 3 and 4.
Table 3.
Effect of age.
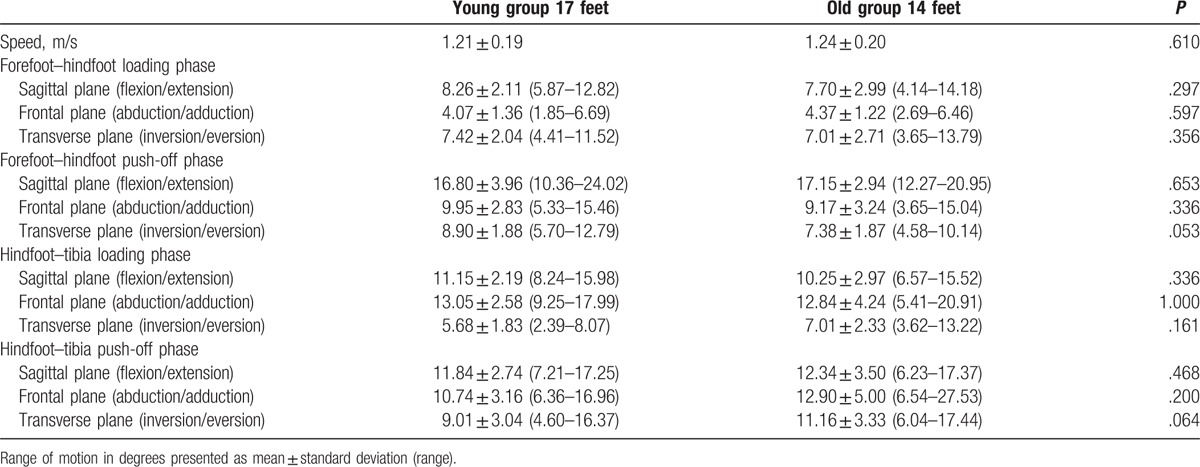
Figure 3.
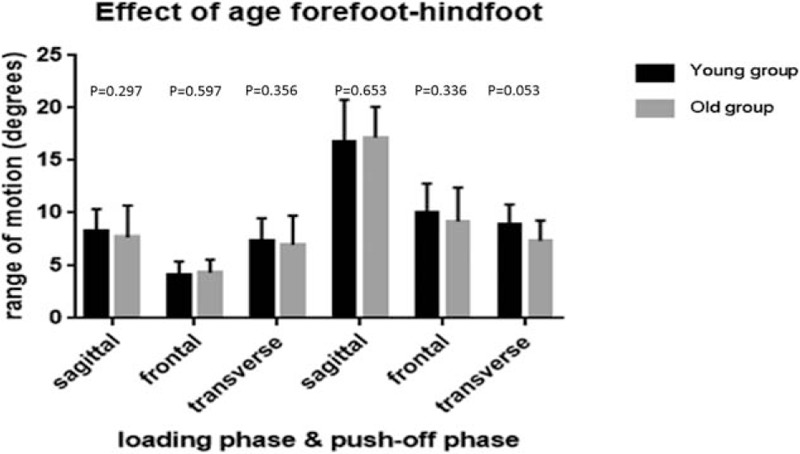
Range of motion between forefoot and hindfoot in younger adults (black) and older adults (grey) during loading phase and push-off phase in sagittal (flexion/extension), frontal (abduction/adduction), and transverse (inversion/eversion) plane.
Figure 4.
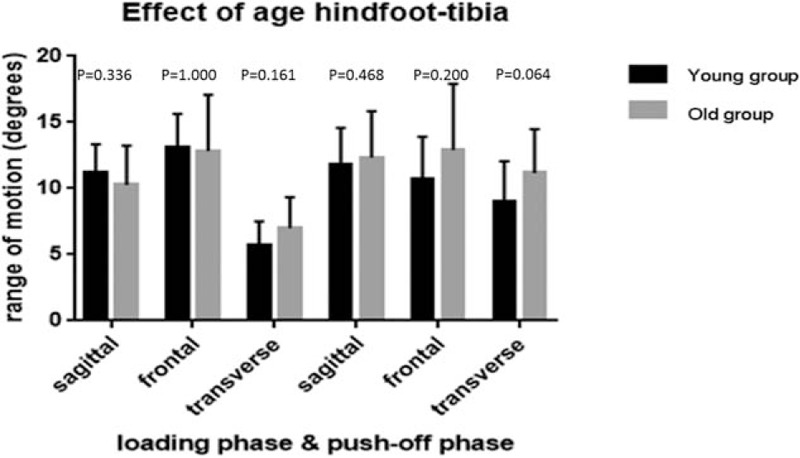
Range of motion between hindfoot and tibia in younger adults (black) and older adults (grey) during loading phase and push-off phase in sagittal (flexion/extension), frontal (abduction/adduction), and transverse (inversion/eversion) plane.
3.4. Interaction between age and speed on gait parameters
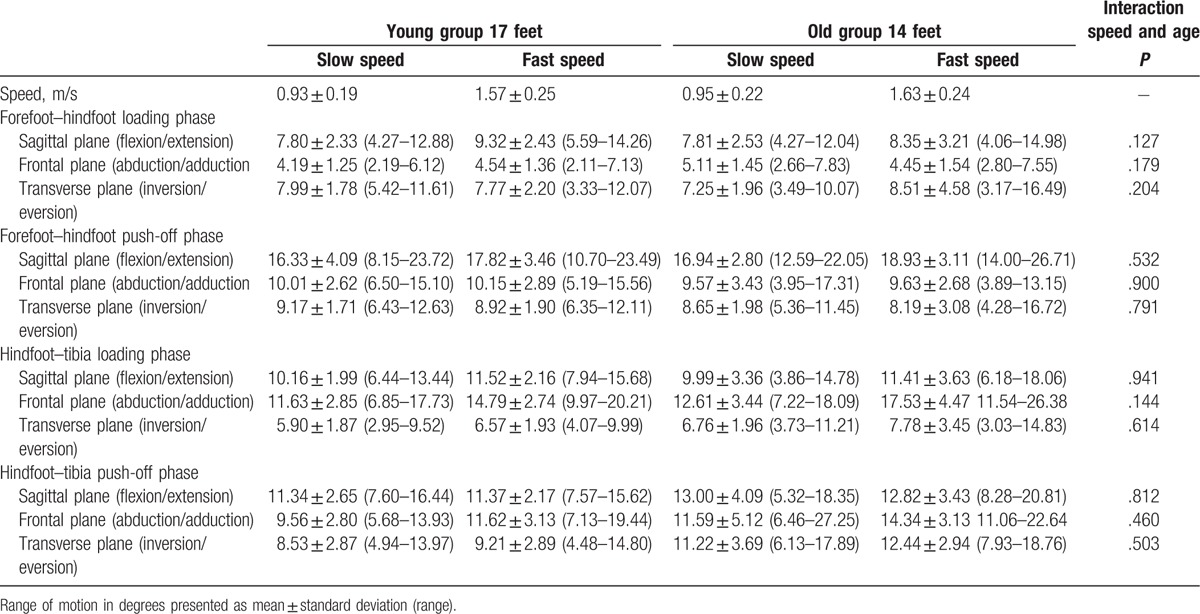
Table 4 presents the results for the foot and ankle kinematics for slow and fast speeds in the younger and older adults groups, as well as the interaction of age on speed differences. There were no significant interactions found between speed and age for the ROM between the forefoot and hindfoot in the sagittal, frontal, and transverse planes, neither during the loading phase nor during the push-off phase. Nor were there significant interactions found between speed and age for the ROM between the hindfoot and tibia in the sagittal, frontal, and transverse planes, neither during the loading phase nor during the push-off phase.
Table 4.
Effect of speed in the young and old group.
4. Discussion
The present study examined the effects of age and speed on foot and ankle kinematics in people of working age using the 4-segment OFM. In addition, this study was the first to analyze the interaction between age and speed. The findings showed that speed had a significant influence on several kinematic parameters leading to higher ROM, especially on the ankle joint (ROM between hindfoot and tibia). In contrast, there was no significant effect of age on foot and ankle kinematics. There was no interaction between age and speed.
As regards the influence of speed on the ROM between the forefoot and hindfoot, the influence was limited to the ROM in the sagittal plane (flexion/extension) during both phases. For both parameters differences between slow and fast walking was more than 1° (respectively, 1.08° and 1.71°). For all other parameters differences were less than 0.50°. As regards the ROM between the hindfoot and tibia, almost all parameters were significantly higher at higher speed. Highest differences were found for the ROM in the frontal plane during loading phase (3.96°). These results are comparable with the study of Dubbeldam et al,[22] who found that speed significantly influenced ROM in a multi-segment model. They included 14 healthy subjects and found several significant differences leading to higher ROM with higher speed. They found significant differences between normal and lower speed for ROM between different segments with difference of 1° or more as in our study. In our study, the most significant differences were found in the ankle joint, as was also found by Dubbeldam et al. They also found significant differences in the hallux, which was not analyzed in our present study.
As regards the influence of age on ROM, differences between both groups for all parameters were small, <1°. The highest difference between both groups was found in the ankle. The ROM between hindfoot and tibia in the frontal plane during push-off phase revealed 2.16° difference between both groups. This difference, however, was not significant.
Comparing with other studies, Kerrigan et al[4] found significant differences in walking patterns between a group of healthy younger subjects (ages 18–36 years) and a group of healthy older subjects (aged 65–84 years), as regards hip extension, anterior pelvic tilt, and ankle plantar flexion using a 1-segment model. Their study, however, reported peak kinematics, and not ROM, as ours does. Another major difference between their study and ours is the much older age of their older group.
Two studies investigating the influence of age on foot and ankle kinematics using a MSFM presented mixed findings. Legault-Moore et al[13] compared 11 healthy young male subjects aged 18 to 30 years with 11 healthy adults aged 55 years and over. They used a 4-segment foot model to analyze differences in ROM and peak joint angles between the 2 groups. Just as our study, they found no significant differences (P > .05) between the 2 age groups. They found highest differences (around 2°) in the ankle, who where not significant, comparable with our study.[13] They did not investigate the effect of speed and the interaction of age and speed on foot and ankle kinematics.
In contrast, Arnold et al[14] found significant differences between 2 groups of different ages in a 5-segment foot model. They included 20 healthy young subjects (mean age 23.2 years) and compared them with 20 healthy older adults (mean age 73.2 years). They found that the older group showed reduced mobility of the calcaneus, midfoot, and metatarsus, and changes in the angular position of the hindfoot, suggesting a less propulsive gait pattern. Significant differences in ROM between both groups were found to differ for most parameters with >5°. However, some of these changes were influenced by walking speed. These results are difficult to compare with our present study, as we used a 4-segment foot model and eliminated the effect of speed by using equal walking speeds for both groups. Furthermore, their older adults group was older compared with our older adults group.
The primary focus of our study was to investigate the effect of age in healthy people at working age, so we did not include any persons aged 65 years or over.
Hence, this manuscript does not provide information about foot and ankle kinematics in 80-year-old adults compared with those of 25-year-olds.
Some limitations have to be addressed in this manuscript. Foot dominance was found to have influence on walking patterns and ground reaction forces during walking in literature.[29,30] We, therefore, cannot rule out that this also affects foot and ankle kinematics during walking. To reduce this influence the first 50% of all subjects had both feet analyzed. These were 4 persons from the younger adults group and 6 from the older adults group. In the remaining group 1 single foot was analyzed (50% dominant and 50% nondominant). Consequently, this led to a higher number of subjects in the older age group who had both feet analyzed.
A total number of 21 subjects was included for this study. This number of patients is in line with previous studies reporting on foot and ankle kinematics, using a MSFM.[7,13,14,22,24–28] When patients were divided by age, 13 subjects (17 feet) were included in the younger adults group and 8 subjects (14 feet) in the older adults group. These groups were smaller. We found no significant difference between both groups, regarding ROM. Differences between both groups were small (<2.5°) and range between both groups were comparable. In contrast, speed significantly influenced ROM leading to higher differences (>2.5° for some parameters) and higher absolute range between both groups.
Besides age significant differences between the younger and older adults groups were found for BMI, body mass, and ankle width (P = .005, P = .035, and P = .045, respectively). When corrected for the parameters no other results were found. In literature no data were found that linked BMI, body mass, and ankle width with different foot and ankle kinematics.
5. Conclusion
This study found a significant influence of speed on foot and ankle kinematics, which was more pronounced in the ankle joint. No significant differences in foot and ankle kinematics between healthy young subjects (aged 18–25 years) and healthy older adult subjects (aged 55–65 years) were found, when measured with the 4-segment OFM. No interaction was found between age and speed. When comparing results of different subjects using the OFM, special attention should be given to walking speed.
Supplementary Material
Acknowledgment
The authors would like to thank Jan Klerkx for his contribution to review this article for the English language corrections.
Footnotes
Abbreviations: MSFM = multi-segment foot model, OFM = Oxford foot model, ROM = range of motion.
Declarations: All subjects filled out an informed consent form before participating in this research project. These files are available on reviewer's request.
Authors’ contributions: Subject inclusion, gait analysis, and writing: SvH; subject inclusion, data analysis, and writing: BL; technical issues during gait analysis and subjects analysis, matlab programme engineering for data analysis: PW; coordination clinical aspects, writing, and supervision manuscript: MP; coordination biomechanical aspects and writing and supervision manuscript: KM; all authors read and approved the final manuscript.
This study was approved by the medical ethics committee of the Maastricht University Medical Centre (MEC azM/UM). This file is added in the supplementary materials.
Competing interest: All authors disclose any financial and personal relationships with other people or organizations that could inappropriately influence their work.
Role of the funding source: There was no funding source for this study.
The authors disclose no conflicts of interest.
Supplemental Digital Content is available for this article.
References
- [1].Guralnik JM, Ferruci L, Pieper CF, et al. Lower extremity function and subsequent disability: consistency across studies, predictive models, and value of gait speed alone compared with the short physical performance battery. J Gerontol A Biol Sci Med Sci 2000;55:221–31. [DOI] [PMC free article] [PubMed] [Google Scholar]
- [2].Behery OA, Foucher KC. Are Harris hip scores and gait mechanics related before and after THA? Clin Orthop Relat Res 2014;472:3452–61. [DOI] [PMC free article] [PubMed] [Google Scholar]
- [3].Ewen AM, Stewart S, St Clair Gibson A, et al. Post-operative gait analysis in total hip replacement patients: a review of current literature and meta-analysis. Gait Posture 2012;36:1–6. [DOI] [PubMed] [Google Scholar]
- [4].Kerrigan DC, Todd MK, Della Croce U, et al. Biomechanical gait alterations independent of speed in the healthy elderly: evidence for specific limiting impairments. Arch Phys Med Rehabil 1998;79:317–22. [DOI] [PubMed] [Google Scholar]
- [5].Kim WS, Kim EY. Comparing self-selected speed walking of the elderly with self-selected slow, moderate, and fast speed walking of young adults. Ann Rehabil Med 2014;38:101–8. [DOI] [PMC free article] [PubMed] [Google Scholar]
- [6].Lee LW, Zavarei K, Evans J, et al. Reduced hip extension in the elderly: dynamic or postural? Arch Phys Med Rehabil 2005;86:1851–4. [DOI] [PubMed] [Google Scholar]
- [7].Hetsroni I, Nyska M, Ben-Sira D, et al. Analysis of foot and ankle kinematics after operative reduction of high-grade intra-articular fractures of the calcaneus. J Trauma 2011;70:1234–40. [DOI] [PubMed] [Google Scholar]
- [8].Khazzam M, Long JT, Marks RM, et al. Preoperative gait characterization of patients with ankle arthrosis. Gait Posture 2006;24:85–93. [DOI] [PubMed] [Google Scholar]
- [9].Mahaffey R, Morrison SC, Drechsler WI, et al. Evaluation of multi-segmental kinematic modelling in the paediatric foot using three concurrent foot models. J Foot Ankle Res 2013;6:43. [DOI] [PMC free article] [PubMed] [Google Scholar]
- [10].Boyer KA, Andriacchi TP, Beaupre GS. The role of physical activity in changes in walking mechanics with age. Gait Posture 2012;36:149–53. [DOI] [PubMed] [Google Scholar]
- [11].Judge JO, Davis RB, 3rd, Ounpuu S. Step length reductions in advanced age: the role of ankle and hip kinetics. J Gerontol A Biol Sci Med Sci 1996;51:303–12. [DOI] [PubMed] [Google Scholar]
- [12].Scott G, Menz HB, Newcombe L. Age-related differences in foot structure and function. Gait Posture 2007;27:68–75. [DOI] [PubMed] [Google Scholar]
- [13].Legault-Moore D, Chester VL, de Vries G. Multisegment foot kinematics during walking in younger and older adults. J Clin Med Res 2012;4:259–66. [DOI] [PMC free article] [PubMed] [Google Scholar]
- [14].Arnold JB, Machkintosh S, Jones S, et al. Differences in foot kinematics between young and older adults during walking. Gait Posture 2014;39:689–94. [DOI] [PubMed] [Google Scholar]
- [15].Bohannon RW. Comfortable and maximum walking speed of adults aged 20-79 years: reference values and determinants. Age Ageing 1997;26:15–9. [DOI] [PubMed] [Google Scholar]
- [16].Caravaggi P, Leardini A, Crompton R. Kinematic correlates of walking cadence in the foot. J Biomech 2010;43:2425–33. [DOI] [PubMed] [Google Scholar]
- [17].Chiu MC, Wang MJ. The effect of gait speed and gender on perceived exertion, muscle activity, joint motion of lower extremity, ground reaction force and heart rate during normal walking. Gait Posture 2007;25:3825–92. [DOI] [PubMed] [Google Scholar]
- [18].Lelas JL, Merriman GJ, Riley PO, et al. Predicting peak kinematic and kinetic parameters from gait speed. Gait Posture 2003;17:106–12. [DOI] [PubMed] [Google Scholar]
- [19].Murray MP, Mollinger LA, Gardner GM, et al. Kinematic and EMG patterns during slow, free, and fast walking. J Orthop Res 1984;2:272–80. [DOI] [PubMed] [Google Scholar]
- [20].Stansfield BW, Hillman SJ, Hazlewood ME, et al. Sagittal joint kinematics, moments, and powers are predominantly characterized by speed of progression, not age, in normal children. J Pediatr Orthop 2001;21:403–11. [PubMed] [Google Scholar]
- [21].van der Linden ML, Kerr AM, Hazlewood ME, et al. Kinematic and kinetic gait characteristics of normal children walking at a range of clinically relevant speeds. J Pediatr Orthop 2002;22:800–6. [PubMed] [Google Scholar]
- [22].Dubbeldam R, Buurke JH, Simons C, et al. The effects of walking speed on forefoot, hindfoot and ankle joint motion. Clin Biomech (Bristol Avon) 2010;25:796–801. [DOI] [PubMed] [Google Scholar]
- [23].Alcock L, Vanicek N, O’Brien TD. Alterations in gait speed and age do not fully explain the changes in gait mechanics associated with healthy older women. Gait Posture 2013;37:586–92. [DOI] [PubMed] [Google Scholar]
- [24].Wang R, Thur CK, Gutierrez-Farewik EM, et al. One year follow-up after operative ankle fractures: a prospective gait analysis study with a multi-segment foot model. Gait Posture 2010;31:234–40. [DOI] [PubMed] [Google Scholar]
- [25].Carson MC, Harrington ME, Thompson N, et al. Kinematic analysis of amulti-segment foot model for research and clinical applications: a repeatability analysis. J Biomech 2001;34:1299–307. [DOI] [PubMed] [Google Scholar]
- [26].Stebbins J, Harrington M, Thompson N, et al. Repeatability of a model for measuring multi-segment foot kinematics in children. Gait Posture 2006;23:401–10. [DOI] [PubMed] [Google Scholar]
- [27].Wright CJ, Arnold BL, Coffey TG, et al. Repeatability of the modified Oxford foot model during gait in healthy adults. Gait Posture 2011;33:108–12. [DOI] [PubMed] [Google Scholar]
- [28].van Hoeve S, de Vos J, Weijers P, et al. Repeatability of the Oxford foot model for kinematic gait analysis of the foot and ankle. Clin Res Foot Ankle 2015;3:171. [Google Scholar]
- [29].Nagano H, Begg RK, Sparrow WA, et al. Ageing and limb dominance effects on foot-ground clearance during treadmill and over ground walking. Clin Biomech (Bristol, Avon) 2011;26:962–8. [DOI] [PubMed] [Google Scholar]
- [30].Wang Y, Watanabe K. Limb dominance related to the variability and symmetry of the vertical ground reaction force and center of pressure. J Appl Biomech 2012;28:473–8. [DOI] [PubMed] [Google Scholar]
- [31].Grood ES, Suntay WJ. A joint coordinate system for the clinical description of three-dimensional motions. J Biomech Eng 1983;105:136–44. [DOI] [PubMed] [Google Scholar]
- [32].Wu G, Siegler S, Allard P, et al. ISB recommendation on definitions of joint coordinate system of various joints for the reporting of human joint motion—part I: ankle, hip, and spine. J Biomech 2002;35:543–8. [DOI] [PubMed] [Google Scholar]
Associated Data
This section collects any data citations, data availability statements, or supplementary materials included in this article.


