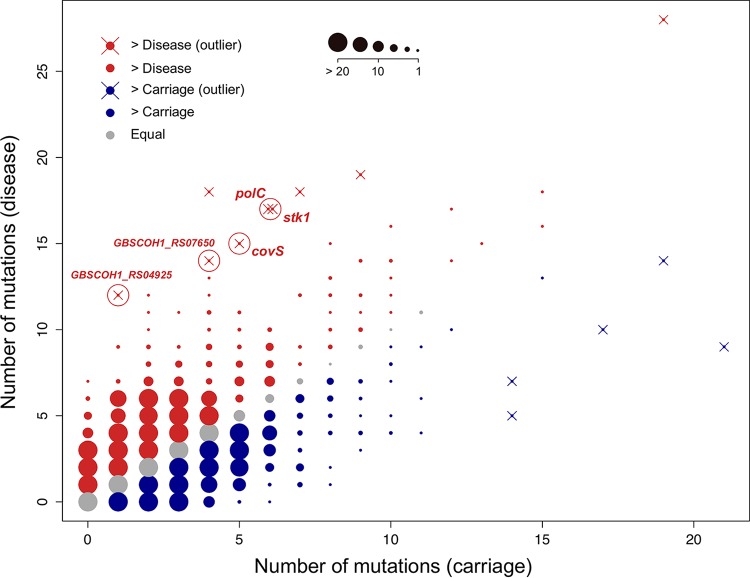
FIG 3 .
Mutation frequencies per gene in carriage- and disease-associated isolates. Shown is a plot of a linear model assessing the correlation between the mutations acquired per gene for each clinical status. Red, gray, and blue dots depict genes that were more, equally, or less mutated in strains associated with disease or carriage according to the key at the top. The size of each data point is proportional to the number of genes found, as indicated in the key at the top. Outlier genes were detected with a Bonferroni-adjusted outlier test, and only those with a P value of <0.05 are represented by the symbol ×. Those highlighted with a red circle and whose names are shown were significantly associated with disease independently of population structuring.

