Abstract
Cancer stem cells (CSCs) are a rare tumorigenic population of cells found in multiple types of cancer. It has been suggested that CSCs are responsible for cancer drug resistance, metastasis and recurrence. Therefore, it is important to develop techniques to correctly sort and identify CSCs. In the current study, the sorting and identification of aldehyde dehydrogenase high (ALDHhigh) CSCs was performed using flow cytometry. Cells from three colon cancer cell lines were cultured in serum-free medium to obtain CSCs-enriched spheroid cells. Subsequently, two subpopulations of ALDHhigh CSCs were isolated by flow cytometry either with the use of propidium iodide (PI) or not, respectively. The two subpopulations of ALDHhigh CSCs exhibited distinct characteristics, including stem cell related gene expression, self-renewal capacity and tumorigenicity in vitro and in vivo. Key regulators of the epithelial-mesenchymal transition (EMT), including vimentin, snail and slug were highly expressed in ALDHhigh CSCs. Therefore, the current study indicates that PI staining prior to the sorting of ALDHhigh CSCs by flow cytometry is an appropriate system for the study of CSCs. The current study also demonstrated that there was partial overlap between the transcriptional programs underlying the EMT and CSCs.
Keywords: aldehyde dehydrogenase, cancer stem cells, flow cytometry, epithelial-mesenchymal transitions
Introduction
Cancer metastasis results in the mortality of >90% of patients with cancer (1), however the mechanisms underlying tumor metastasis remain unknown. It has been indicated that certain types of cancer are stem cell diseases (2). According to the hierarchical ‘stem cell model of carcinogenesis,’ tumors should not be viewed as simple monoclonal expansions of transformed cells but rather as complex tissues, where abnormal growth is driven by a subpopulation of cancer stem cells (CSCs) (3). These CSCs have acquired tumor-like features, such as uncontrolled growth, but also maintain their innate capacity to self-renew and differentiate into phenotypically heterogeneous progeny (3). Due to their stem-like properties, CSCs are considered to be responsible for cancer chemo- and radiotherapy, metastasis and recurrence. Therefore, to completely eradicate a tumor and prevent recurrence, CSCs should be targeted specifically (3). To date, CSCs have been identified as the driving force behind tumor formation and recurrence in several types of cancer, including leukemia, colorectal and liver cancer (4,5). Therefore, numerous studies are focused on developing novel methods to determine the mechanisms that regulate the survival, self-renewal and differentiation of CSCs (6).
CSCs can be identified and isolated by four different ways from bulk cancer cells: i) Isolation of CSCs by flow cytometry (FCM) using CSC-specific cell surface markers (7); ii) detection of the side population phenotype by Hoechst 33342 exclusion (5); iii) ability to grow as floating spheres in serum-free medium (5); and iv) measurement of aldehyde dehydrogenase (ALDH) activity (8). None of the aforementioned methods are exclusively used to isolate solid tumor CSCs, highlighting the imperative to delineate more specific markers or to use combinatorial markers and methodologies. One frequently used method for CSC isolation is sphere formation via serum-free medium (9). This method results in the isolation of tumor cells resistant to chemotherapy; such cells express high levels of proteins involved in drug resistance (10). However, it has been demonstrated that this procedure is relatively inefficient, as only 1–30% of CSCs are detectable by this method (6,9). CSCs are extremely rare and are undetectable in the majority of cases (2). Consequently, the sphere-forming assay should be a reliable and simple method of enriching CSCs by producing a higher percentage of CSCs, a higher capacity of self-renewal, colony formation and tumorigenesis prior to FCM. FCM analysis of CSCs is a reliable, effective and easy-handling approach to screen agents targeting CSCs. Furthermore, due to the use of multiple parameters, it can precisely identify extremely small subpopulations, allowing for the recognition of potentially rare CSCs (11). The use of FCM to identify CSCs can be broadly divided into two categories: Definition according to specific cluster of differentiation (CD) surface marker phenotype and demonstration of stem cell associated functions (7,12). Functional stem cell characteristics, such as aldehyde dehydrogenase (ALDH) activity, are common metabolic features used to identify and analyze CSCs. It has been determined that ALDH is a reliable marker of CSCs in a number of different types of solid tumors, including tumors of the head and neck, lung, liver, pancreas and colon (12–14). High ALDH activity may also be associated with poor prognosis in breast, colon, ovary and lung cancer (15–17).
It is clear that ALDH may be used as a marker to identify and isolate normal stem cells and CSCs from different tissue sources. Some researchers have identified, characterized and isolated a ALDHhigh CSC-like subpopulation from human colorectal cancer cell lines and xenograft tumors (18,19). It was subsequently demonstrated that the ALDHhigh subpopulation from colon cancer cells could be detected at levels as high as 15.3–34.6% (18,19). However, based on the CSC theory, it has been suggested that CSCs only represent a minority of the entire tumor mass (<5% of the total tumor mass). If true, this means that the ALDHhigh CSC subpopulation may be heterogeneous, possibly consisting of subsets of cells with differing tumorigenic potentials (20). In fact, it was observed that there are a number of dead cells following sphere forming culture (5). Non-specific fluorescence signals emitted from dead cells may be detected in the ALDH fluorescence channel by FCM. Therefore, the dead cells were identified and isolated as ALDHhigh cells. In the current study, the ALDH activity in human colorectal cancer cell lines was analyzed. To determine the different functions of the two subpopulations of ALDHhigh CSCs, ALDHhigh CSCs were sorted according to the exclusion or inclusion of dead cells, respectively. Furthermore, cells were analyzed by reverse transcription-quantitative polymerase chain reaction (RT-qPCR), sphere-formation assay, limiting dilution assay, colony formation assay, laser confocal analysis and tumorigenesis in vitro and in vivo.
Materials and methods
Cell lines and monolayer culture
Colorectal cancer cell lines HT29 (HTB-38), HCT116 (CCL-247), and DLD-1 (CCL-221) were obtained from the American Type Culture Collection (ATCC; Manassas, VA, USA). HT29 and HCT116 cells were both cultured in McCoy's 5A media (ATCC) supplemented with 10% fetal bovine serum (FBS; Gibco; Thermo Fisher Scientific, Inc., Waltham, MA, USA), whereas DLD-1 cells were cultured in RPMI1640 (Hyclone; GE Healthcare Life Sciences, Logan, Utah, USA) media supplemented with 10% FBS. All cells were maintained in a humidified incubator at 37°C and 5% CO2.
Tumor cell sphere culture
The sphere culture was performed as previously described, with some modifications (5). All cells were grown at a density of 2×10⁵ cells/ml in serum-free Dulbecco's Modified Eagle's Medium (DMEM)/F12 (Hyclone; GE Healthcare Life Sciences, Shanghai, China) containing 20 ng/ml epidermal growth factor (EGF; PeproTech, Inc., Rocky Hill, NJ, USA), 10 ng/ml basic fibroblast growth factor (bFGF, Pepro Tech, Inc.), 5 µg/ml insulin (Sigma-Aldrich; Merck kGaA, Darmstadt, Germany), 0.4% bovine serum albumin (BSA; Amresco, Solon, OH, USA), 100 U/ml Pen/Strep (Hyclone; GE Healthcare Life Sciences) and 2% B27 (Invitrogen; Thermo Fisher Scientific, Inc., Waltham, MA, USA). Spheres were cultured using 5,000 tumor cells in ultralow attachment 12-well dishes (Corning Incorporated, Corning, NY, USA) for 15 days in a humidified incubator at 37°C containing 5% CO2 and then collected following centrifugation at 300 × g for 5 min at 4°C. Finally, spheres were dissociated using Accutase Solution (Sigma-Aldrich; Merck kGaA). To perform a sphere-forming assay, spheres were dissociated, counted with Trypan blue staining and 500 tumor cells from HT29, HCT116 and DLD-1 were re-plated under the same conditions as stated above, respectively.
Limiting dilution assay
The limiting dilution and tumor sphere forming assay was performed as previously described, with some modifications (21). In brief, tumor cells were plated with limiting dilution (0.5–4 cells/well) in 0.2 ml DMEM/F12 in quadruplicate in a 96-well plate and cultured for 14 days in a humidified incubator at 37°C containing 5% CO2. At the end of the experiment, the number of spheres per well was counted. The fraction of negative wells compared with cell dilution was graphed and fitted with a linear regression to estimate the number of CSCs. Following the assumption that a single stem cell gives rise to one sphere (22), the proportion of negative wells was defined by the zero point (F0) of the Poisson distribution: F0=e−x, where x is the mean number of cells per well. One cancer stem cell (one sphere) was expected at a dilution of 0.37 (when x=1, F0=e−1=0.37).
FCM
The ALDH activity was determined by the Aldefluor assay kit (Stem Cell Technologies, Inc., Cambridge, MA, USA) according to the manufacturer's instructions. Cells were trypsinized and incubated with activated ALDEFLUOR reagent for 50 min at 37°C. Control samples incubated with the inhibitor, DEAB, were used to ensure identification of ALDHhigh and ALDHlow subpopulations. All stained cells were then examined by using a BD FACSVerse flow cytometer (BD Biosciences, San Jose, CA, USA) and the data was analyzed by BD FACSuite software (BD Biosciences). For sorting, the cells were collected using a BD FACSAria Fusion flow cytometer (BD Biosciences).
In vivo model of tumor cell xenografting
All animal experiments were approved by the Ethical Committee of Huazhong University of Science and Technology (#S255; Wuhan, China). Tumor cells were collected and suspended in phosphate-buffered saline. A total of 15 six-week-old athymic female Balb/c nu/nu mice (weight, 25.2±2.13 g; Beijing HFK Bioscience Co., Ltd, Beijing, China) were injected subcutaneously. Three groups (n=5 per group) of mice were established as follows: DLD-S ALDH/PI group: 1×10⁴ DLD-S ALDH and DLD-S ALDH/PI cells were injected into the left and right flanks of five mice, respectively; HT29S ALDH/PI group: 1×10⁴ HT29S ALDH and HT29S ALDH/PI cells were injected into the left and right flanks of five mice, respectively; and HCT116S ALDH/PI group: 1×10⁴ HCT116S ALDH and HCT116S ALDH/PI cells were injected into the left and right flanks of five mice, respectively. Mice were housed and maintained in a specific pathogen-free, environmentally controlled atmosphere. The mice were individually housed in standard cages (40×25×12 cm) with food and water available ad libitum. The housing room was maintained at constant room temperature (21±2°C) and humidity (45%), and kept under a regular 12-h light/dark schedule with lights on from 08:00 am to 20:00 pm. (23,24). Mice were sacrificed with an overdose of sodium pentobarbital (100 mg/kg; intraperitoneal injection; Sigma-Aldrich; Merck kGaA, Darmstadt, Germany) 30 days following injection. Xenografts were removed and the tumor size and histopathology were analyzed as previously described (5).
RNA isolation and RT-qPCR
Total cellular RNA was isolated using TRIzol® Reagent (Invitrogen; Thermo Fisher Scientific, Inc.) and mRNA levels were measured by RT-qPCR using a previously described protocol (5). The primer pairs for measuring the levels of each mRNA were as follows: GAPDH, forward, 5′-GGGGAGCCAAAAGGGTCATCATCT-3′ and reverse, r5′-GACGCCTGCTTCACCACCTTCTTG-3′; kruppel-like factor 4 (KLF4), forward, 5′-CGAACCCACACAGGTGAGAA-3′ and reverse, 5′-TACGGTAGTGCCTGGTCAGTTC-3′; octamer-binding transcription factor 4 (Oct4), forward, 5′-CTTGCTGCAGAAGTGGGTGGAGGAA-3′ and reverse, 5′-CTGCAGTGTGGGTTTCGGGCA-3′; Sox2, forward, 5′-CAAGATGCACAACTCGGAGA-3′ and reverse, 5′-CATGAGCGTCTTGGTTTTCC-3′; Nanog, forward, 5′-CAGAAGGCCTCAGCACCTACCTACCCCAGCC-3′ and reverse, 5′-TCTCTGCAGTCCTGCATGCAGTTCCAGCCAAA-3′; BMI-1, forward, 5′-CCAGGGCTTTTCAAAAATGA-3′ and reverse, 5′-CCGATCCAATCTGTTCTGGT-3′.
Immunofluorescence staining and laser confocal analysis
The expression of ALDH and vimentin in DLD-S ALDH/PI CSCs were analyzed with immunofluorescence staining and the laser confocal technique. For immunofluorescence analysis, cells were grown in serum-free DMEM/F12 (Hyclone; GE Healthcare Life Sciences) medium containing several growth factors and placed onto glass-coverslips for 16 h prior to fixation with 2% paraformaldehyde at 37°C for 15 min. Fixed cells were then permeablized with 0.1% Triton X-100 in PBS at 20°C for 15 min, followed by incubation at 4°C overnight with the following primary antibodies: ALDH (1:200; sc-166362; Santa Cruz Biotechnology, Inc., Dallas, TX, USA) and vimentin (1:200; sc-7557; Santa Cruz Biotechnology), respectively. Antibodies were diluted using blocking buffer (PBS containing 2% BSA and 5% FBS). Cells were then incubated with phycoerythrin-(1:200; sc-166362; Santa Cruz Biotechnology, Inc.) or fluorescein isothiocyanate-conjugated secondary antibody (1:200; sc-2024; Santa Cruz Biotechnology, Inc.) at 20°C for 1 h. These slides were then stained using 4′,6-diamidino-2-phenylindole (DAPI; 1:1,000; Invitrogen; Thermo Fisher Scientific, Inc.) at 20°C for 10 min. Fluorescent images were captured using the Olympus FV1200 laser confocal microscope (Olympus Corporation, Tokyo, Japan).
Statistical analysis
Statistical analyses were conducted using the SPSS software, version 19.0. All data are expressed as the mean ± standard deviation. Student's t-test and one-way analysis of variance were used to evaluate the significant associations among categorical variables. The post hoc tests (Tukey's test) were performed following ANOVA analysis. P<0.05 was considered to indicate a statistically significant difference.
Results and Discussion
In the present study, human colon cancer cells were cultured in serum-free DMEM/F12 medium to generate spheroid cells for the establishment of an appropriate model system. The sphere forming assay via serum-free medium is a reliable and widely used method for CSC enrichment or isolation (5,25,26). Fluorescence activated cell sorting (FACS) was then used to sort ALDHhigh cells from the spheroid cells either with or without PI staining. For convenience, ALDHhigh cells sorted using PI were classified as ALDH/PI and cells sorted without the use of PI were referred to as ALDH. Spheroid cells generated from DLD-1, HT29 and HCT116 were categorized as DLD-S, HT29S and HCT116S, respectively.
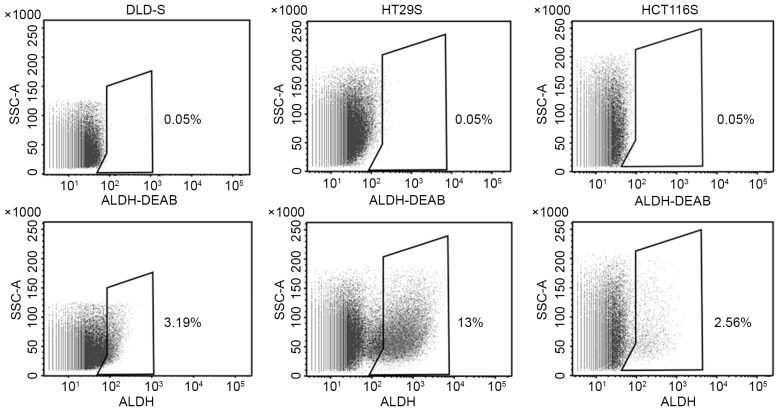
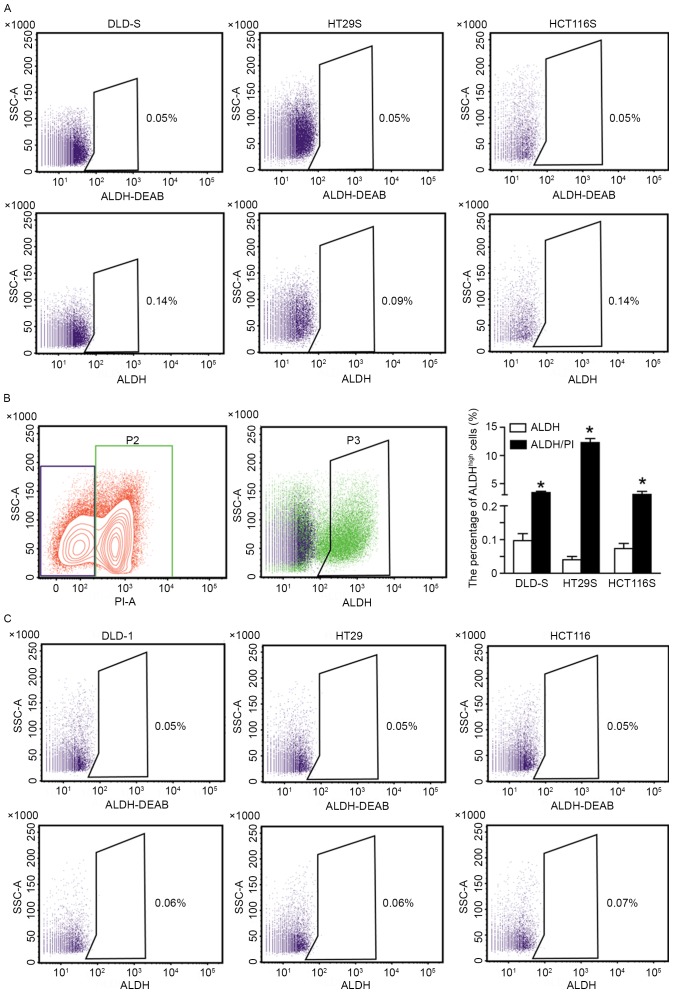
A number of studies have focused on the role of ALDHhigh cells in cancer progression (12,17,19). The percentage of ALDHhigh cells in spheroid cells from DLD-1, HT29 and HCT116 cells were analyzed in the current study (Fig. 1). The ALDHhigh subpopulation was detected at levels between 2.51±0.3 and 12.95%±0.7 if dead cells were not excluded from the analysis by the positive PI staining, which is consistent with the results of previous studies (20,27,28). Moreover, the percentage of the ALDHhigh subpopulation was also detected by PI staining to exclude dead cells prior to FCM. Following this exclusion, the percentage of ALDHhigh cells was between 0.04±0.01 and 0.09%±0.01 (Fig. 2A), consistent with theories of CSCs and FCM. It was determined that dead cells in the spheroid cells were distributed in the ALDHhigh subpopulation (Fig. 2B). In addition, the ALDHhigh cells from DLD-1, HT29, and HCT116 adherent cells were 0.01±0.01% to 0.02±0.01%, respectively (Fig. 2C), indicating that it is a reliable way to isolate CSCs from spheroid cells. Consequently, it is reasonable to speculate that, without the exclusion of dead cells, results will be diverse. However, no comparative analysis has been made between ALDH and ALDH/PI subpopulations in previous studies. Therefore, it was postulated that a systematic study should be performed to distinguish between the two subpopulations of CSCs in vitro and in vivo.
Figure 1.
The percentage of ALDHhigh CSCs sorted by flow cytometry without the use of propidium iodide staining. As assessed by flow cytometry, when dead cells were not excluded, the mean percentage of ALDHhigh CSCs in DLD-S, HT29S and HCT116S cells were 3.19±0.3, 12.95±0.7 and 2.56±0.3%, respectively. ALDH-DEAB was used as a control. All data are presented as the mean ± standard deviation of three independent experiments. CSC, cancer stem cells; ALDH, aldehyde dehydrogenase; DEAB, Diethylaminobenzaldehyde; SSC-A, side scatter area.
Figure 2.
Isolating ALDHhigh CSCs from spheroid cells with PI staining. (A) Exclusion of dead cells by PI staining prior to flow cytometry. The mean percentages of ALDHhigh cancer stem cells in DLD-S, HT29S and HCT116S cells were 0.09±0.01, 0.04±0.01, and 0.09±0.01%, respectively. (B) The dead cells as distinguished by PI staining were distributed in the ALDHhigh subpopulation (Green). Consequently, the dead cells were counted as ALDHhigh cells. (C) The ALDHhigh cells from DLD-1, HT29 and HCT116 adherent cells were 0.01±0.01 to 0.02±0.01%, respectively. ALDH-DEAB was used as a control. All data are presented as mean ± standard deviation of three independent experiments. *P<0.05 vs. ALDH. PI, propidium iodide; ALDHhigh, high aldehyde dehydrogenase; DEAB, diethylaminobenzaldehyde; SSC-A, side scatter area.
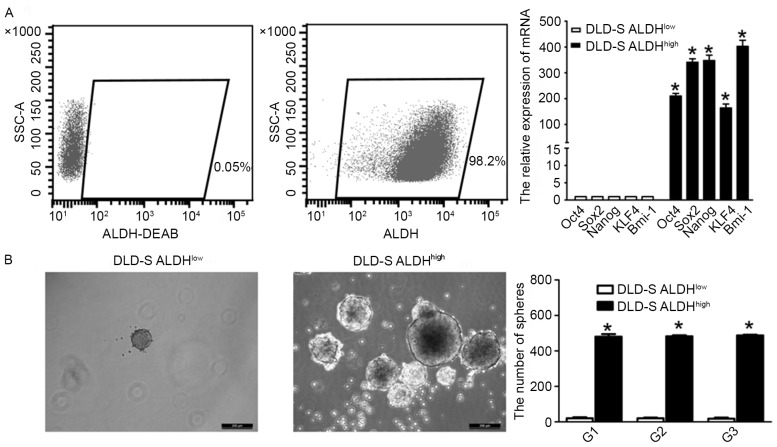
Previous studies demonstrated that DLD-1, HCT116, and HT29 colon cancer cells form spheres when cultured in serum-free medium and that these spheroid cells possess CSC characteristics (5,9,29). As DLD-1 cells form spheres more readily than the other colon cancer lines tested, the current study only used DLD-S to determine the stemness properties of ALDHhigh cells. RT-qPCR was used to measure mRNA levels of stem cell related genes including Oct4, Sox2, Nanog, KLF4 and BMI-1. It was demonstrated that the expression of all these genes was significantly higher in ALDHhigh cells compared with ALDHlow cells (P<0.05; Fig. 3A). The capacity of self-renewal in ALDHhigh and ALDHlow cells was determined using the sphere-forming assay. It has been suggested that the capacity of CSC self-renewal serves a critical role in cancer progression, as it induces chemoresistance, high tumorigenicity, metastasis and recurrence (30,31). Only cells with self-renewal capability are able to sustain the growth in suspension that gives rise to non-adherent colonies (32). The current study demonstrated that ALDHhigh cells exhibited a higher sphere-forming capability than ALDHlow cells, indicating that ALDHhigh cells have a higher capacity for self-renewal (Fig. 3B). The capacity of secondary sphere formation is a hallmark of the stem cell property of self-renewal (21). Consequently, a serial sphere-forming assay was performed and it was determined that there were significantly fewer spheres in the ALDHlow subpopulation than in ALDHhigh cells (P<0.05), indicating a defect in the self-renewal of ALDHlow cells (Fig. 3B). These results suggest that the ALDHhigh subpopulation exhibits certain CSC characteristics compared with ALDHlow cells.
Figure 3.
The stemness of ALDHhigh cells. (A) The efficiency was confirmed by flow cytometry following the sorting of ALDHhigh cells from DLD-S cells. mRNA levels of the stem cell related genes Oct4, Sox2, Nanog, KLF4 and Bmi-1 in ALDHhigh CSCs were up-regulated compared with ALDHlow cells. All mRNA levels are presented as relative to GAPDH levels. (B) As assessed by the serial sphere forming assay, ALDHhigh CSCs exhibit a higher capacity of self-renewal compared with ALDHlow cells. Scale bar=200 µm; magnification, ×200. All data are presented as the mean ± standard deviation of three independent experiments. *P<0.05 vs. DLD-S ALDHlow. ALDHhigh, high aldehyde dehydrogenase; DEAB, diethylaminobenzaldehyde; CSCs, cancer stem cells; Oct4, octamer-binding transcription factor; KLF4, kruppel-like factor 4; SSC-A, side scatter area.
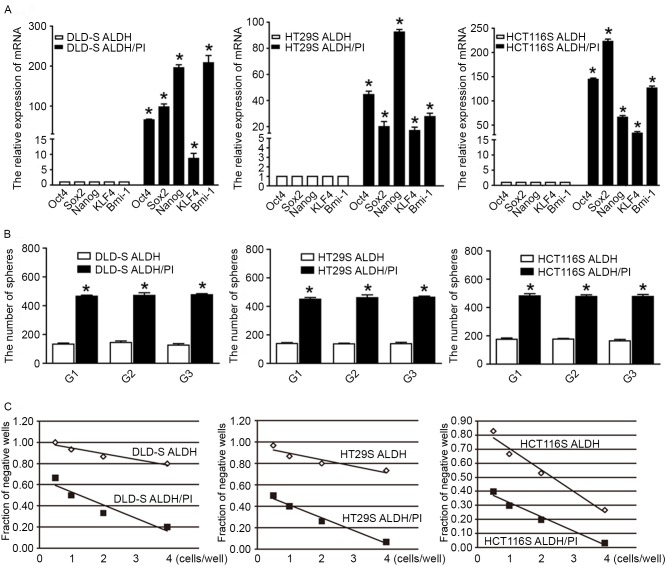
To further elucidate the differences of gene expression in the ALDH/PI and ALDH subpopulations, the expression profile of stem cell related genes was analyzed. It was demonstrated that the expression of all genes was significantly higher in DLD-S, HT29S and HCT116S ALDH/PI cells compared with ALDH cells (P<0.05; Fig. 4A). In suspension, ALDH/PI cells exhibited higher sphere-forming capability, indicating that ALDH/PI cells have a higher capacity of self-renewal than ALDH cells. More importantly, the serial sphere-forming assay demonstrated that there were significantly fewer spheres in the ALDH subpopulation than in ALDH/PI cells in all cell lines tested (P<0.05), indicating a defect in the self-renewal of ALDH cells (Fig. 4B). These data seem to indicate that there are fewer CSCs in the ALDH subpopulation compared with the ALDH/PI subpopulation.
Figure 4.
Characterization of two ALDHhigh CSCs subpopulations. (A) mRNA levels of the stem cell related genes Oct4, Sox2, Nanog, KLF4 and Bmi-1 in ALDH/PI CSCs were upregulated compared with ALDH CSCs. (B) As assessed by a serial sphere forming assay, ALDH/PI CSCs exhibited a higher capacity of self-renewal compared with ALDH CSCs. (C) As assessed by limiting dilution assay, the ALDH/PI subpopulation had higher fraction of CSCs than ALDH cells. All data are presented as the mean ± standard deviation of three independent experiments. *P<0.05 vs. ALDH. ALDH, aldehyde dehydrogenase; PI, propidium iodide; CSCs, cancer stem cells; Oct4, octamer-binding transcription factor; KLF4, kruppel-like factor 4.
In addition, a limiting dilution assay was performed to calculate the proportion of CSCs in the two subpopulations. In brief, tumor cells were plated with limiting dilution (0.5–4 cells/well) in 0.2 ml DMEM/F12 in quadruplicate in a 96-well plate and cultured for 14 days. At the end of the experiments, the number of spheres per well was counted. The fraction of negative wells compared with cell dilution was graphed and fitted with a linear regression to estimate CSC frequency. Following the assumption that a single stem cell gives rise to one sphere (22), the proportion of negative wells is defined by the zero point (F0) of the Poisson distribution: F0=e−x, where x is the mean number of cells per well. One cancer stem cell (one sphere) is expected at a dilution of 0.37 (when x=1, F0=e−1=0.37). Since a sphere is thought to represent all progeny from a single stem cell, sphere formation reflects the stem cell population (33); thus, CSC frequency may be estimated using the limiting dilution assay. The median frequencies were 1/14 (DLD-S), 1/11 (HT29S), 1/12 (HCT116S) for ALDH/PI cells and 1/38 (DLD-S), 1/33 (HT29S), 1/24 (HCT116S) for ALDH cells, respectively (Fig. 4C). Taken together, these data indicate that there is a higher proportion of CSCs in the ALDH/PI subpopulation than in ALDH cells.
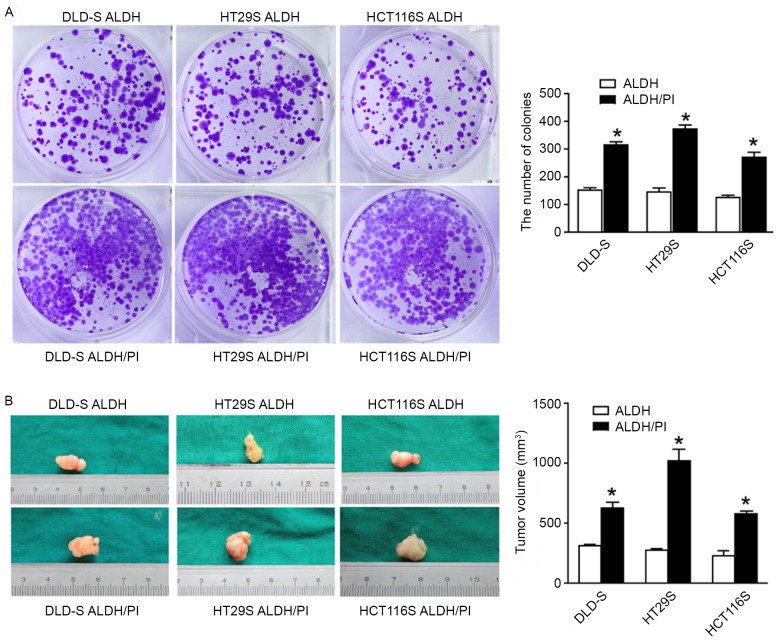
Subsequently, the tumorigenicity of the ALDH/PI and ALDH subpopulations was examined. The colony formation assay indicated that ALDH cells formed significantly fewer colonies than ALDH/PI cells in vitro (P<0.05; Fig. 5A). Xenotransplantation assays were then performed to determine the tumorigenicity of the two subpopulations in vivo. An equal number of cells from the two subpopulations were injected subcutaneously into immunodeficient mice. It was determined that injected ALDH cells exhibited significantly lower tumor growth compared with ALDH/PI cells (P<0.05; Fig. 5B).
Figure 5.
ALDH/PI CSCs exhibit higher tumorigenicity than ALDH CSCs in vitro and in vivo. (A) ALDH CSCs formed a significantly lower number of colonies than the ALDH/PI CSCs as assessed by a colony formation assay. (B) Mice transplanted with ALDH/PI CSCs formed tumors earlier and formed significantly larger tumors than mice transplanted with ALDH CSCs. All data are presented as the mean ± standard deviation of three independent experiments. *P<0.05 vs. ALDH. ALDH, aldehyde dehydrogenase; CSCs, cancer stem cells; PI, propidium iodide.
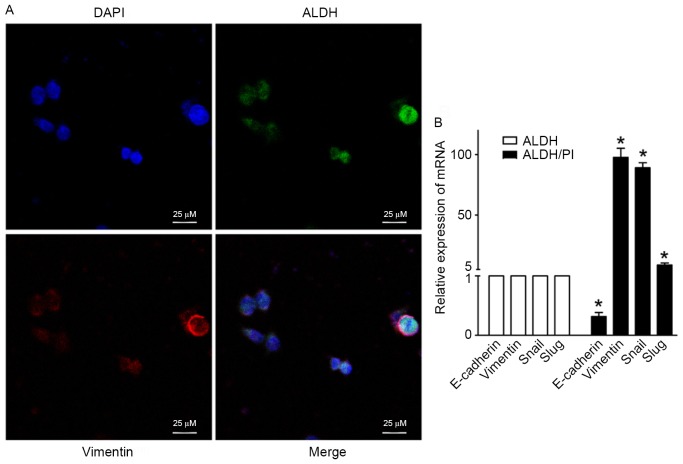
The epithelial-mesenchymal transition (EMT) has been postulated as a mechanism by which cancer cells acquire the invasive and stem-like traits necessary to induce distant metastasis (34). The EMT process involves the disassembly of cell-cell junctions, actin cytoskeleton reorganization and increased cell motility, as characterized by a decrease in the expression of epithelial genes such as E-cadherin and the acquisition of mesenchymal molecules including vimentin, snail and slug (5,35). Previous studies have indicated that CSC-like cells may be generated by processes associated with activation of the EMT, which affects cellular differentiation and tumor metastatic potential (5,10,36). Thus, CSC biology and the EMT may be mechanistically correlated and potentially be key components of cancer progression and metastasis. It is essential to perform an in-depth investigation of crosstalk of cancer stemness with EMT to improve understanding of tumor progression from a stem cell model perspective (37). The current study examined the expression of key EMT regulators including E-cadherin, vimentin, snail and slug in ALDHhigh CSCs from DLD-S cells using laser confocal analysis and RT-qPCR. The co-expression of ALDH and the mesenchymal marker vimentin was determined (Fig. 6A). There was a significant increase in the expression of the mesenchymal markers vimentin, snail and slug in ALDH/PI CSCs compared with ALDH CSCs (P<0.05; Fig. 6B). However, the expression of the epithelial marker E-cadherin was significantly decreased in ALDH/PI CSCs compared with ALDH CSCs (P<0.05; Fig. 6B). These data indicate that the transcriptional programs underlying EMT and CSCs partially overlap.
Figure 6.
The co-expression of ALDH and EMT key regulators. (A) Laser confocal analysis confirming the presence of ALDH and the EMT key regulator vimentin in ALDHhigh CSCs. Nuclei were stained with DAPI. Scale bar=25 µm; magnification, ×400. (B) Levels of E-cadherin mRNA were decreased in ALDHhigh CSCs, whereas levels of the mesenchymal molecules vimentin, snail and slug were highly expressed in ALDHhigh CSCs. All data are presented as the mean ± standard deviation of three independent experiments. *P<0.05 vs. ALDH. EMT, epithelial-mesenchymal transition; ALDHhigh, high aldehyde dehydrogenase; CSCs, cancer stem cells; DAPI, 4′,6-diamidino-2-phenylindole.
In conclusion, the results of the current study indicate that ALDH/PI CSCs and ALDH CSCs exhibit distinct characteristics. ALDH/PI CSCs are highly tumorigenic and have enhanced stem cell characteristics in vitro and in vivo compared with ALDH CSCs. Furthermore, the current study demonstrated that there were partially overlapping transcriptional programs underlying the EMT and CSCs. Therefore, the current study demonstrates that the exclusion of dead cells prior to FACS is an appropriate model system to study CSCs.
Acknowledgements
The current study was partly supported by grants from The National Natural Science Foundation of China (grant no. 81402444/H1607) and The Key Project of Education Department in Sichuan (grant no. 16ZA0226). The funding bodies had no role in the study design, data collection and analysis, decision to publish, or preparation of the manuscript.
References
- 1.Mehlen P, Puisieux A. Metastasis: A question of life or death. Nat Rev Cancer. 2006;6:449–458. doi: 10.1038/nrc1886. [DOI] [PubMed] [Google Scholar]
- 2.Ishizawa K, Rasheed ZA, Karisch R, Wang Q, Kowalski J, Susky E, Pereira K, Karamboulas C, Moghal N, Rajeshkumar NV, et al. Tumor-initiating cells are rare in many human tumors. Cell Stem Cell. 2010;7:279–282. doi: 10.1016/j.stem.2010.08.009. [DOI] [PMC free article] [PubMed] [Google Scholar]
- 3.Visvader JE, Lindeman GJ. Cancer stem cells in solid tumours: Accumulating evidence and unresolved questions. Nat Rev Cancer. 2008;8:755–768. doi: 10.1038/nrc2499. [DOI] [PubMed] [Google Scholar]
- 4.Ricci-Vitiani L, Lombardi DG, Pilozzi E, Biffoni M, Todaro M, Peschle C, De Maria R. Identification and expansion of human colon-cancer-initiating cells. Nature. 2007;445:111–115. doi: 10.1038/nature05384. [DOI] [PubMed] [Google Scholar]
- 5.Leng Z, Tao K, Xia Q, Tan J, Yue Z, Chen J, Xi H, Li J, Zheng H. Krüppel-like factor 4 acts as an oncogene in colon cancer stem cell-enriched spheroid cells. PLoS One. 2013;8:e56082. doi: 10.1371/journal.pone.0056082. [DOI] [PMC free article] [PubMed] [Google Scholar]
- 6.Dou J, Gu N. Emerging strategies for the identification and targeting of cancer stem cells. Tumour Biol. 2010;31:243–253. doi: 10.1007/s13277-010-0023-y. [DOI] [PubMed] [Google Scholar]
- 7.Zhou JY, Chen M, Ma L, Wang X, Chen YG, Liu SL. Role of CD44(high)/CD133(high) HCT-116 cells in the tumorigenesis of colon cancer. Oncotarget. 2016;7:7657–7666. doi: 10.18632/oncotarget.7084. [DOI] [PMC free article] [PubMed] [Google Scholar]
- 8.Huang EH, Hynes MJ, Zhang T, Ginestier C, Dontu G, Appelman H, Fields JZ, Wicha MS, Boman BM. Aldehyde dehydrogenase 1 is a marker for normal and malignant human colonic stem cells (SC) and tracks SC overpopulation during colon tumorigenesis. Cancer Res. 2009;69:3382–3389. doi: 10.1158/0008-5472.CAN-08-4418. [DOI] [PMC free article] [PubMed] [Google Scholar]
- 9.Pastrana E, Silva-Vargas V, Doetsch F. Eyes wide open: A critical review of sphere-formation as an assay for stem cells. Cell Stem Cell. 2011;8:486–498. doi: 10.1016/j.stem.2011.04.007. [DOI] [PMC free article] [PubMed] [Google Scholar]
- 10.Yin T, Wei H, Leng Z, Yang Z, Gou S, Wu H, Zhao G, Hu X, Wang C. Bmi-1 promotes the chemoresistance, invasion and tumorigenesis of pancreatic cancer cells. Chemotherapy. 2011;57:488–496. doi: 10.1159/000334103. [DOI] [PubMed] [Google Scholar]
- 11.Gupta V, Zhang QJ, Liu YY. Evaluation of anticancer agents using flow cytometry analysis of cancer stem cells. Methods Mol Biol. 2011;716:179–191. doi: 10.1007/978-1-61779-012-6_11. [DOI] [PMC free article] [PubMed] [Google Scholar]
- 12.Ma I, Allan AL. The role of human aldehyde dehydrogenase in normal and cancer stem cells. Stem Cell Rev. 2011;7:292–306. doi: 10.1007/s12015-010-9208-4. [DOI] [PubMed] [Google Scholar]
- 13.Kozovska Z, Gabrisova V, Kucerova L. Colon cancer: Cancer stem cells markers, drug resistance and treatment. Biomed Pharmacother. 2014;68:911–916. doi: 10.1016/j.biopha.2014.10.019. [DOI] [PubMed] [Google Scholar]
- 14.Tomita H, Tanaka K, Tanaka T, Hara A. Aldehyde dehydrogenase 1A1 in stem cells and cancer. Oncotarget. 2016;7:11018–11032. doi: 10.18632/oncotarget.6920. [DOI] [PMC free article] [PubMed] [Google Scholar]
- 15.Shao C, Sullivan JP, Girard L, Augustyn A, Yenerall P, Rodriguez-Canales J, Liu H, Behrens C, Shay JW, Wistuba II, Minna JD. Essential role of aldehyde dehydrogenase 1A3 for the maintenance of non-small cell lung cancer stem cells is associated with the STAT3 pathway. Clin Cancer Res. 2014;20:4154–4166. doi: 10.1158/1078-0432.CCR-13-3292. [DOI] [PMC free article] [PubMed] [Google Scholar]
- 16.Holah NS, Aiad HA, Asaad NY, Elkhouly EA, Lasheen AG. Evaluation of the role of ALDH1 as cancer stem cell marker in colorectal carcinoma: An immunohistochemical study. J Clin Diagn Res. 2017;11:EC17–EC23. doi: 10.7860/JCDR/2017/22671.9291. [DOI] [PMC free article] [PubMed] [Google Scholar]
- 17.Duan JJ, Cai J, Guo YF, Bian XW, Yu SC. ALDH1A3, a metabolic target for cancer diagnosis and therapy. Int J Cancer. 2016;139:965–975. doi: 10.1002/ijc.30091. [DOI] [PubMed] [Google Scholar]
- 18.Clouston HW, Lamb R, Duff S, Kirwan CC. PO-52-Effect of tissue factor expression by colorectal cancer on cancer stem cell activity. Thromb Res. 2016;140(Suppl 1):S195–S196. doi: 10.1016/S0049-3848(16)30184-0. [DOI] [PubMed] [Google Scholar]
- 19.Khorrami S, Hosseini Zavaran A, Mowla SJ, Malekzadeh R. Verification of ALDH activity as a biomarker in colon cancer stem cells-derived HT-29 cell line. Iran J Cancer Prev. 2015;8:e3446. doi: 10.17795/ijcp-3446. [DOI] [PMC free article] [PubMed] [Google Scholar]
- 20.Ma S, Chan KW, Lee TK, Tang KH, Wo JY, Zheng BJ, Guan XY. Aldehyde dehydrogenase discriminates the CD133 liver cancer stem cell populations. Mol Cancer Res. 2008;6:1146–1153. doi: 10.1158/1541-7786.MCR-08-0035. [DOI] [PubMed] [Google Scholar]
- 21.Nolte SM, Venugopal C, McFarlane N, Morozova O, Hallett RM, O'Farrell E, Manoranjan B, Murty NK, Klurfan P, Kachur E, et al. A cancer stem cell model for studying brain metastases from primary lung cancer. J Natl Cancer Inst. 2013;105:551–562. doi: 10.1093/jnci/djt022. [DOI] [PubMed] [Google Scholar]
- 22.Reynolds BA, Weiss S. Clonal and population analyses demonstrate that an EGF-responsive mammalian embryonic CNS precursor is a stem cell. Dev Biol. 1996;175:1–13. doi: 10.1006/dbio.1996.0090. [DOI] [PubMed] [Google Scholar]
- 23.Bradford MM. A rapid and sensitive method for the quantitation of microgram quantities of protein utilizing the principle of protein-dye binding. Anal Biochem. 1976;72:248–254. doi: 10.1016/0003-2697(76)90527-3. [DOI] [PubMed] [Google Scholar]
- 24.Kokolus KM, Capitano ML, Lee CT, Eng JW, Waight JD, Hylander BL, Sexton S, Hong CC, Gordon CJ, Abrams SI, Repasky EA. Baseline tumor growth and immune control in laboratory mice are significantly influenced by subthermoneutral housing temperature. Proc Natl Acad Sci USA. 2013;110:20176–20181. doi: 10.1073/pnas.1304291110. [DOI] [PMC free article] [PubMed] [Google Scholar]
- 25.Lombardo Y, de Giorgio A, Coombes CR, Stebbing J, Castellano L. Mammosphere formation assay from human breast cancer tissues and cell lines. J Vis Exp. doi: 10.3791/52671. doi: 10.3791/52671. [DOI] [PMC free article] [PubMed] [Google Scholar]
- 26.Zhang DG, Jiang AG, Lu HY, Zhang LX, Gao XY. Isolation, cultivation and identification of human lung adenocarcinoma stem cells. Oncol Lett. 2015;9:47–54. doi: 10.3892/ol.2014.2639. [DOI] [PMC free article] [PubMed] [Google Scholar]
- 27.Kim MP, Fleming JB, Wang H, Abbruzzese JL, Choi W, Kopetz S, McConkey DJ, Evans DB, Gallick GE. ALDH activity selectively defines an enhanced tumor-initiating cell population relative to CD133 expression in human pancreatic adenocarcinoma. PLoS One. 2011;6:e20636. doi: 10.1371/journal.pone.0020636. [DOI] [PMC free article] [PubMed] [Google Scholar]
- 28.Silva IA, Bai S, McLean K, Yang K, Griffith K, Thomas D, Ginestier C, Johnston C, Kueck A, Reynolds RK, et al. Aldehyde dehydrogenase in combination with CD133 defines angiogenic ovarian cancer stem cells that portend poor patient survival. Cancer Res. 2011;71:3991–4001. doi: 10.1158/0008-5472.CAN-10-3175. [DOI] [PMC free article] [PubMed] [Google Scholar]
- 29.Lee CH, Yu CC, Wang BY, Chang WW. Tumorsphere as an effective in vitro platform for screening anti-cancer stem cell drugs. Oncotarget. 2016;7:1215–1226. doi: 10.18632/oncotarget.6261. [DOI] [PMC free article] [PubMed] [Google Scholar]
- 30.Basu S, Haase G, Ben-Ze'ev A. Wnt signaling in cancer stem cells and colon cancer metastasis. F1000Res. 2016;5:pii. doi: 10.12688/f1000research.7579.1. [DOI] [PMC free article] [PubMed] [Google Scholar]
- 31.Hanahan D, Weinberg RA. Hallmarks of cancer: The next generation. Cell. 2011;144:646–674. doi: 10.1016/j.cell.2011.02.013. [DOI] [PubMed] [Google Scholar]
- 32.Bortolomai I, Canevari S, Facetti I, De Cecco L, Castellano G, Zacchetti A, Alison MR, Miotti S. Tumor initiating cells: Development and critical characterization of a model derived from the A431 carcinoma cell line forming spheres in suspension. Cell Cycle. 2010;9:1194–1206. doi: 10.4161/cc.9.6.11108. [DOI] [PubMed] [Google Scholar]
- 33.Tropepe V, Sibilia M, Ciruna BG, Rossant J, Wagner EF, van der Kooy D. Distinct neural stem cells proliferate in response to EGF and FGF in the developing mouse telencephalon. Dev Biol. 1999;208:166–188. doi: 10.1006/dbio.1998.9192. [DOI] [PubMed] [Google Scholar]
- 34.Ruscetti M, Quach B, Dadashian EL, Mulholland DJ, Wu H. Tracking and functional characterization of epithelial-mesenchymal transition and mesenchymal tumor cells during prostate cancer metastasis. Cancer Res. 2015;75:2749–2759. doi: 10.1158/0008-5472.CAN-14-3476. [DOI] [PMC free article] [PubMed] [Google Scholar]
- 35.Liu CC, Cai DL, Sun F, Wu ZH, Yue B, Zhao SL, Wu XS, Zhang M, Zhu XW, Peng ZH, Yan DW. FERMT1 mediates epithelial-mesenchymal transition to promote colon cancer metastasis via modulation of β-catenin transcriptional activity. Oncogene. 2017;36:1779–1792. doi: 10.1038/onc.2016.339. [DOI] [PubMed] [Google Scholar]
- 36.Mani SA, Guo W, Liao MJ, Eaton EN, Ayyanan A, Zhou AY, Brooks M, Reinhard F, Zhang CC, Shipitsin M, et al. The epithelial-mesenchymal transition generates cells with properties of stem cells. Cell. 2008;133:704–715. doi: 10.1016/j.cell.2008.03.027. [DOI] [PMC free article] [PubMed] [Google Scholar]
- 37.Yin X, Zhang BH, Zheng SS, Gao DM, Qiu SJ, Wu WZ, Ren ZG. Coexpression of gene Oct4 and Nanog initiates stem cell characteristics in hepatocellular carcinoma and promotes epithelial-mesenchymal transition through activation of Stat3/Snail signaling. J Hematol Oncol. 2015;8:23. doi: 10.1186/s13045-015-0119-3. [DOI] [PMC free article] [PubMed] [Google Scholar]


