

Abstract
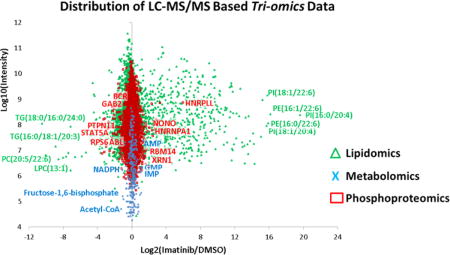
The combination of metabolomics, lipidomics, and phosphoproteomics that incorporates triple stable isotope labeling by amino acids in cell culture (SILAC) protein labeling, as well as 13C in vivo metabolite labeling, was demonstrated on BCR–ABL-positive H929 multiple myeloma cells. From 11,880 phosphorylation sites, we confirm that H929 cells are primarily signaling through the BCR–ABL–ERK pathway, and we show that imatinib treatment not only downregulates phosphosites in this pathway but also upregulates phosphosites on proteins involved in RNA expression. Metabolomics analyses reveal that BCR–ABL–ERK signaling in H929 cells drives the pentose phosphate pathway (PPP) and RNA biosynthesis, where pathway inhibition via imatinib results in marked PPP impairment and an accumulation of RNA nucleotides and negative regulation of mRNA. Lipidomics data also show an overall reduction in lipid biosynthesis and fatty acid incorporation with a significant decrease in lysophospholipids. RNA immunoprecipitation studies confirm that RNA degradation is inhibited with short imatinib treatment and transcription is inhibited upon long imatinib treatment, validating the triomics results. These data show the utility of combining mass spectrometry-based “-omics” technologies and reveals that kinase inhibitors may not only downregulate phosphorylation of their targets but also induce metabolic events via increased phosphorylation of other cellular components.
Graphical abstract
Our laboratory has developed mass spectrometry technologies that utilize metabolomics, lipidomics, and proteomics; these technologies are typically used independently to attempt to discover biomarkers of diseases. In this study, we capitalized on the importance of integrating multiple “-omics” results to test the utility of a triomics analysis. In an effort to explore how oncogenic signaling downstream of BCR–ABL fusion kinase may drive cell proliferation, we combined triple stable isotope labeling by amino acids in cell culture (SILAC) global phosphoproteomics1,2 with unlabeled and 13C-labeled polar metabolomics3,4 and unlabeled nonpolar lipidomics5 data in a quantitative manner using widely used omics technologies. The model multiple myeloma cell line H929 has rearranged c-myc proto-oncogene6 and a BCR–ABL fusion.7 We note that is very rare that multiple myeloma cells contain the BCR–ABL fusion, although it is common in chronic myeloid leukemia (CML).8,9 Phosphorylation is one of the most important and most studied post-translational modifications (PTM) because it regulates signaling activity and important cellular functions including proliferation, growth, and survival, especially in diseases such as cancer.1,10–12 Tandem mass spectrometry (MS/MS), in combination with enrichment steps such as immobilized metal affinity chromatography (IMAC) resin13 or TiO2 beads14 as well as phosphotyrosine immunoprecipitation,15 has been widely used to quantify and identify phosphorylation sites.16,17 In addition, recent work using mass spectrometry-based targeted polar metabolomics profiling has been gaining in popularity to understand the cell’s metabolic dependencies for growth and proliferation.3,18–21 These data have been used to provide a number of insights into uptake of nutrients such as glucose and glutamine and how and why these metabolic processes are rewired in cancer cells.21–24 Similar to other cancer models, BCR–ABL-transformed cells have been shown to overconsume glucose and enable protection from apoptosis even in the absence of growth factors, and imatinib can reduce glucose uptake in BCR–ABL-positive cell lines as measured by lactate production.25 It has also been shown that imatinib-resistant BCR–ABL cell lines can sustain levels of glycolysis in the presence of the drug.26,27 In addition to proteomics and metabolomics, lipidomics profiling is becoming popular in the -omics field with the surge in high-resolution and sensitive tandem mass spectrometers28–32 and the fact that lipids are important players in the cell in membrane bilayers, to maintain a hydrophobic environment for membrane protein function and interactions, as reservoirs for energy storage, and as second messengers.33,34
For this triomics study, we analyzed BCR–ABL-positive H929 cells with the ABL kinase inhibitor imatinib, the standard-of-care drug for BCR–ABL mutations, and compared it with the proteasome inhibitor bortezomib, the standard-of-care drug for multiple myeloma. Each -omics approach (phosphoproteomics, polar metabolomics, and nonpolar lipidomics) was performed separately, and the data were then manually integrated with the biological information. The data were aimed at identifying kinase activity, metabolic reprogramming, and lipid biosynthesis. Multiomics approaches can provide deeper and global insight into cellular signaling by integrating proteomic, lipidomic, and metabolomic changes upon drug treatment. It is becoming more common in recent years to combine more than one -omics technology,35,36 although typically only two methods are combined, such as metabolomics with transcriptomics,37–40 metabolomics with proteomics,41–45 and proteomics with transcriptomics.46–51 Lipidomics combined with other -omics technologies have been reported less frequently, though mainly with transcriptomics.52–55 Here, we describe for the first time the integration of phosphoproteomics, metabolomics, and lipidomics data to analyze drug response in cancer cells.
The study suggests that BCR–ABL-transformed myeloma cells not only dictate signaling through kinase inhibition but also affect RNA transcription, central carbon metabolism, and lipid biosynthesis via phosphorylation of splicing factors.
EXPERIMENTAL SECTION
Detailed experimental methods are available in Supporting Information.
SILAC Labeling
The H929 multiple myeloma cell line was maintained in SILAC Roswell Park Memorial Institute (RPMI) 1640 medium and labeled with either unlabeled L-arginine and L-lysine (Arg0, Lys0) or equimolar amounts of L-[13C6]arginine and L-[2H4]lysine (Arg6, Lys4) or L-[13C6,15N4]arginine and L [13C6,15N2]lysine (Arg10, Lys8). Cells were grown in SILAC medium for seven cell doublings. The cells were treated with 1 μM imatinib for 60 min, 200 nM bortezomib for 16 h, or dimethyl sulfoxide (DMSO) control for 16 h.
Cell Lysis and Digestion
Frozen cell pellets from differentially treated H929 cells were solubilized with 8 M urea-based buffer with protease and phosphatase inhibitors and sonicated. Cell debris was removed by centrifugation and SILAC-encoded samples were pooled at a ratio of 1:1:1, with 10 mg of protein per sample. Samples were reduced, alkylated, and digested with 300 μg of sequencing-grade trypsin overnight. Peptides were cleared of debris by passage through 6 cm3/500 mg C18 Sep-Pak cartridges.
Peptide Separation and Fractionation
Strong cation-exchange (SCX) chromatography was performed with a 250 mm × 9.4 mm polysulfoethyl A column. The sample was dissolved in SCX A buffer (7 mM KH2PO4, pH = 2.65, 30% acetonitrile, ACN) and then injected and run at 3 mL/min under the following gradient conditions: 1%–30% buffer B (7 mM KH2PO4, 350 mM KCl, pH = 2.65, 30% ACN) in 40 min, 30%–50% B in 1 min, 50%–100% B in 5 min, 100% B for 5 min, 100%–1% B in 1 min, and 1% B for 14 min. Twelve fractions were collected at 4 min intervals and concentrated to dryness. A 3 cm3/50 mg C18 Sep-Pak cartridge was used to clear each peptide fraction of salt.
Phosphopeptide Enrichment
Phos-Select IMAC beads (50% slurry in 40% ACN/25 mM formic acid) were used to enrich the peptide fractions for phosphorylation of S, T, and Y. For each SCX fraction, 10 μL of IMAC bead slurry and 120 μL of IMAC-binding buffer were mixed and incubated. Twelve different C18 StageTips cartridges were used to clean each IMAC-enriched peptide fraction.
Phosphotyrosine Immunoprecipitation
Phosphotyrosine immunoprecipitation (IP) was performed by following the PTMScan phospho-tyrosine rabbit mAB (P-Tyr-1000) kit protocol. In short, 20 mg of protein lysate was incubated with 80 μL of conjugated monoclonal antibody (mAB) for 2 h at 4 °C. The beads were washed and eluted with 0.15% trifluoroacetic acid (TFA).
SILAC Tandem Mass Spectrometry
An aliquot (5 μL) of each enriched peptide fraction was analyzed by positive-ion-mode microcapillary liquid chromatography–tandem mass spectrometry (LC/MS/MS) on a hybrid LTQ-Orbitrap Elite mass spectrometer via data-dependent acquisitions (DDA) using collision-induced dissociation (CID; top 12) or higher-energy collision dissociation (HCD; top 8) from separate runs. Peptides were delivered and separated by use of an Easy-nLC II nanoflow HPLC at 300 nL/min with 15 cm × 75 μm i.d. C18 columns. Gradient conditions were 140 min from 3% to 38% buffer B [where buffer B is 100% ACN and buffer A is 0.1% formic acid (FA)/0.9% ACN/99% water]. MS/MS spectra were searched by the Andromeda search engine in MaxQuant software v1.3.0.5 (http://www.maxquant.org/) against the decoy UniProt human database (49,463 entries; http://www.uniprot.org/downloads) including variable modifications of Met oxidation, phosphorylation of Ser/Thr/Tyr, and fixed modification of carbamidomethyl Cys. The false discovery rate (FDR) was set to 1.5% for peptide and protein identifications. SILAC ratios were calculated by use of MaxQuant. Biological triplicates were run from three separate cell culture preparations (two for HCD and one for CID).
Metabolomics via Selected Reaction Monitoring Tandem Mass Spectrometry
One 15 cm2 plate of suspension cells (∼10–15 million) per sample was extracted with 80% methanol (−80 °C) for 15 min. Dried metabolite pellets were resuspended in 20 μL of LC/MS-grade water, and 5 μL aliquots were injected for targeted LC/MS/MS on a 5500 QTRAP hybrid triple-quadrupole mass spectrometer coupled to a Prominence ultrafast liquid chromatography (UFLC) system from 287 selected reaction monitoring (SRM) transitions with positive/negative polarity switching. Samples were separated on a 4.6 mm i.d. × 100 mm Amide XBridge hydrophilic interaction liquid chromatography (HILIC) column at 360 μL/min starting from 85% buffer B (100% ACN) and moving to 0% B over 16 min. Buffer A was 20 mM NH4OH/20 mM CH3COONH4 (pH = 9.0) in 95:5 water/ACN. Q3 peak areas were integrated by use of MultiQuant 2.1 software (AB/SCIEX). MetaboAnalyst 2.0 (http://www.metaboanalyst.ca) was used to normalize data, calculate heat maps, and perform pathway analysis. Cells were also grown in glucose-free Dulbecco’s modified Eagle’s medium (DMEM) base supplemented with [U-13C6]glucose to 11 mM, 10% dialyzed serum, and drug. Cells were treated with 5 μM 6-aminonicotinamide (6-AN), 10 μM compound 968, 20 mM 2-deoxyglucose (2-DG), or DMSO vehicle as a control. SRM transitions were modified to account for the 13C-labeled carbon. All metabolite samples were prepared as biological triplicates.
Lipidomics via Nontargeted Tandem Mass Spectrometry
Lipids were extracted from one 15 cm2 plate of H929 cells per sample with methyl tert-butyl ether (MTBE) for 1 h at room temperature (RT).56 Samples were resuspended in 35 μL of 50% 2-propanol/50% MeOH. Aliquots (10 μL) of each sample were injected for LC/MS/MS on a hybrid QExactive Plus Orbitrap mass spectrometer in DDA mode with positive/negative ion polarity switching (top 8 in both modes). On a 100 mm × 2.0 mm C18 column at 260 μL/min with a 1100 quaternary HPLC, lipids were eluted over 20 min from 32% to 97% buffer B (where buffer B is 90% 2-propanol/10% ACN/10mM NH4HCO2/0.1% FA). Buffer A consisted of 59.9% ACN/40% water/10 mM NH4HCO2/0.1% FA. Lipid molecules were identified and quantified by use of LipidSearch 4.1.9 software.
Western Blot Analysis
Western blot analyses were conducted after separation of the lysate by sodium dodecyl sulfate–polyacrylamide gel electrophoresis (SDS–PAGE) on a 10% polyacrylamide gel and transfer to nitrocellulose membranes. Antibody binding was detected using enhanced chemiluminescence.
PathScan RTK Antibody Array Kit
The PathScan receptor tyrosine kinase (RTK) signaling array kit, containing 39 fixed antibodies in duplicates against phosphorylated forms of common key signaling proteins by the sandwich enzyme-linked immunosorbent assay (ELISA) format, was used per the manufacturer’s protocol.
Cell Viability Assays
MTT [3-(4,5-dimethylthiazol-2-yl)-2,5-diphenyltetrazolium bromide] solutions were used by incubating cells for 3 h, and the optical density (OD) was determined by testing wavelength of 570 nm and a reference wavelength of 630 nm. H929 cells were treated with 1 μM imatinib or 200 nM bortezomib. For metabolic inhibitors, cells were treated with 5 μM 6-AN, 10 μM compound 968, 20 mM 2-DG, or DMSO control in full growth medium for 72 h in triplicate, and MTT assays were performed at 0, 24, 48, and 72 h. MTT assays were also performed from H929 cells grown in DMEM supplemented with either 11 mM glucose or 2 mM glutamine as well as the presence or absence of both glucose and glutamine.
Nascent mRNA and Total RNA Levels
H929 cells were labeled with 1 mM5-fluorouridine in 30mMKCl and 10mM N-(2-hydroxyethyl)piperazine-N′-ethanesulfonic acid (HEPES) buffer (pH 7.4) for 10 min, followed by incubation in 1 μM imatinib, 200 nM bortezomib, or DMSO for 1 and 16 h in RPMI medium. Total RNA was isolated with an RNeasy kit, and∼40 μg of total RNA was used for the nascent RNA IP with 5 μg of α-bromodeoxyuridine (α-BrdU) antibody. The concentration of nascent RNA was measured on a NanoDrop spectrophotometer at 260 nm. Total RNA levels from both cytoplasmic and nuclear fractions were also measured after centrifugation for 10 min at 750g at 4 °C.
RESULTS AND DISCUSSION
Signaling in BCR–ABL H929 Cells
As described previously, the H929 multiple myeloma cells used in this study contain an unexpected BCR–ABL fusion.7 We compared the effects of short versus overnight treatment with the proteasome inhibitor bortezomib (Velcade) and short incubation with the ABL kinase inhibitor imatinib (Gleevec). Concentrations were chosen on the basis of estimated IC50 values from previous studies and our own experience. Time points were selected to reflect the temporal activity of inhibitors on signal transduction and metabolism; that is, tyrosine kinase activity is inhibited on a short time scale (~1 h), whereas the effect of proteasome inhibition are not observed until much later (≥16 h). A biochemical analysis of H929 cells under drug treatments showed that bortezomib caused an overall increase in tyrosine phosphorylation across a wide variety of substrates over a 2.5 h period, while imatinib inhibited tyrosine phosphorylation on major drivers of growth and proliferation in the BCR–ABL pathway (Figure 1A). At 16 h of bortezomib treatment, the phosphorylation levels are abrogated, at which point the proteasome has also become inhibited.57,58 Figure 1B shows that both drug types are effective in suppressing cell proliferation in BCR–ABL H929 cells. Other known tyrosine kinases that are sensitive to imatinib, such as KIT and PDGFR,59 are not prominent drivers of growth in H929 cells according to a PathScan phosphorylation array (Figure 1C). The PathScan data also show that imatinib abrogated phosphorylation levels on important signaling proteins such as extracellular signal-regulated kinase (ERK)1/2 (T202, Y204), ribosomal protein S6K (T412), and serine/threonine kinase AKT (S473), while bortezomib dramatically increased the phosphorylation signals during the 2.5 h incubation time prior to apoptosis.58
Figure 1.
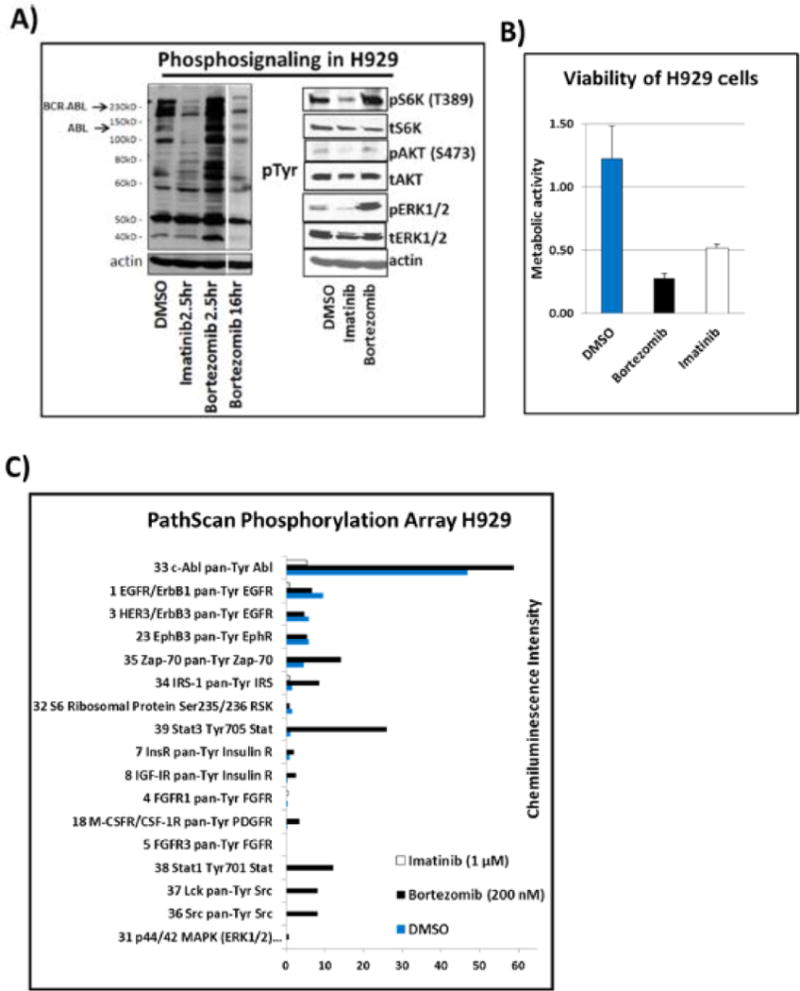
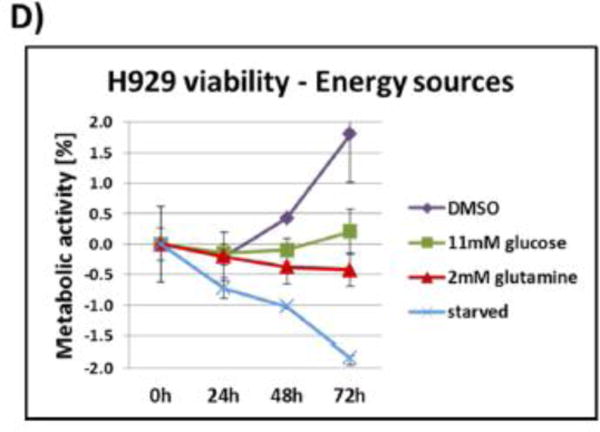
(A) Immunoblots from H929 cells treated with DMSO vehicle control, 1 μMimatinib, or 200 nM bortezomib for 2.5 and 16 h. The first panel shows a pTyr blot revealing a decrease of phosphotyrosine (pTyr) signal for BCR–ABL fusion kinase. The second panel shows pERK, pAKT, and pS6K blots showing a reduction in signaling with imatinib but an increase with bortezomib. (B) MTT cell viability assay of H929 cells treated with DMSO, imatinib, or bortezomib for 72 h in triplicate. The metabolic activity (viability) of H929 is significantly inhibited by both imatinib and bortezomib. (C) PathScan receptor tyrosine kinase (RTK) signaling antibody array of DMSO-, imatinib-, and bortezomib-treated cells. The extensive chemiluminescence-based RTK array shows in more detail the overall decrease in phosphorylation signaling with imatinib treatment and overall increase of phosphorylation signaling with bortezomib prior to apoptosis. (D) Metabolic activity assay of H929 cells under various energy source (11 mM glucose, 2 mM glutamine) and starvation conditions over 72 h. The cells are more dependent upon glucose rather than glutamine for growth.
Metabolism of BCR–ABL H929 Cells
In addition to signaling events, we studied the basic metabolism of BCR–ABL-transformed H929 myeloma cells. By depriving the cells of glucose or glutamine (the major energy sources for cells) or both, we discovered that H929 cells were more dependent upon glucose than glutamine for growth. Figure 1D shows cell viability plots for several energy conditions. We also investigated effects of various metabolic inhibitors on cell viability: 2-deoxyglucose (2-DG, glycolysis inhibitor), compound 968 (glutaminase/TCA cycle inhibitor), 6-aminonicotinamide (6-AN, pentose phosphate pathway inhibitor), and DMSO control (Figure S1A). The results showed that 6-AN was the most effective inhibitor of BCR–ABL H929 cells, followed by 2-DG, confirming the glucose deprivation data and the dependence on glucose. Since the pentose phosphate pathway (PPP), an offshoot of the glycolysis pathway, was found to be the preferential metabolic pathway for growth and proliferation, universally labeled [13C6]glucose was used with targeted LC/MS/MS to assess labeled intermediates with 6-AN treatment. The data in Figure S1B show that PPP intermediate levels are predominantly affected by 6-AN treatment in H929 compared to the other metabolite intermediates, providing further evidence of a PPP dependency. We also compared the relative level of 13C glucose flux through the PPP intermediates versus related cell types including the chronic myeloid leukemia (CML) K562 cell, which also contains a BCR–ABL fusion, and RPMI-8226 multiple myeloma cells (Figure S1C). These results supported the elevated dependency on PPP in H929.
Quantitative Phosphoproteomics
Once we gathered a basic biochemical understanding of the signaling and metabolism of BCR–ABL H929 multiple myeloma cells, we next sought to examine how BCR–ABL affected signal transduction via the whole cell phosphoproteome. For this purpose, we used triple SILAC1,2,60–62 in three populations of BCR–ABL H929 cells. The populations were treated with either 1 μM imatinib for 1 h, 200 nM bortezomib for 16 h, or DMSO vehicle for 16 h. We used slightly higher drug concentrations than known IC50 values to observe robust effects on phosphorylation. The three populations were mixed at a ratio of 1:1:1 and digested with trypsin, and peptides were fractionated and enriched for phosphorylation with IMAC beads. Fractions were subjected to C18 microcapillary tandem mass spectrometry (LC/MS/MS) on a high-resolution Orbitrap Elite via collision-induced dissociation (CID) and higher-energy collision dissociation (HCD). Phosphopeptides were identified and quantified by use of MaxQuant software. Three separate LC/MS/MS runs detected 11,880 unique phosphorylation sites from 3,121 phosphoproteins (Figure 2A,B). The majority of proteins (2,294) were identified in both CID and HCD, while 685 were unique to CID and 142 were unique to HCD (Figure 2B). CID mode produced the majority of phosphosites: 3,786 sites were discovered in both modes, 1,709 were uniquely detected in HCD mode, and 6,385 were uniquely detected in CID mode (Figure 2A). The distribution of phosphorylation was similar to that in reported phosphoproteome screens:63,64 83% of the phosphosites were phosphorylated on serine, 15.3% on threonine, and 1.7% of all identified phosphosites were tyrosine sites. Phosphosites with a coefficient of variation (CV) less than 0.5 and a ratio 2.5 times the standard deviation larger or smaller than the mean were classified as regulated and selected for more detailed analysis. This threshold yielded 161 downregulated phosphosites in CID, 98 in HCD, and an overlap of 31 sites, which included important signaling proteins (Figure 2C). Importantly, both imatinib- and bortezomib-induced phosphorylation is not simply due to protein level changes. A subset of the highly regulated phosphosites was normalized to nonphosphorylated peptides of different sequence on the same proteins, and the pSTY ratios did not change significantly (Figure S2). Examples of intact peptide high-resolution mass spectra of highly regulated SILAC-labeled phosphopeptides are shown in Figure S3 for both drug treatments.
Figure 2.
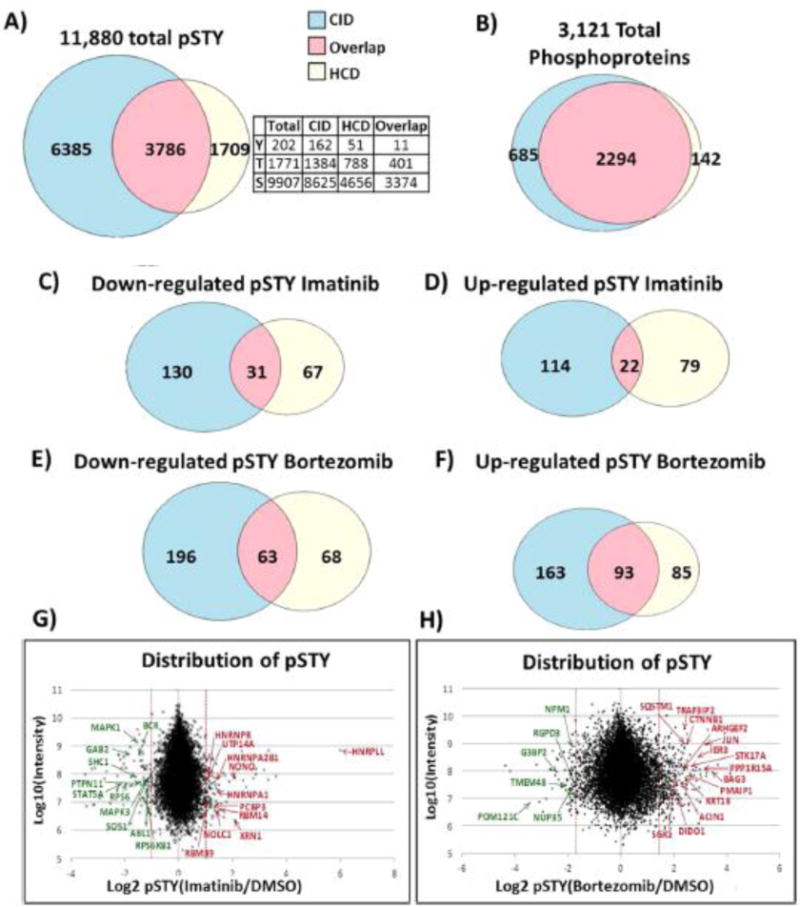
(A) Total number of identified phosphosites (11,880) is shown in a Venn diagram, with numbers representing the number of phosphosites detected via CID or HCD fragmentation modes or in both by use of data-dependent LC/MS/MS from triple SILAC labeled BCR–ABL H929 cells after SCX separation and IMAC enrichment. Relative numbers of S, T, and Y sites are also shown. (B) The 3,121 phosphoproteins were represented by 11,880 phosphosites. (C, D) Number of (C) downregulated and (D) upregulated phosphosites with 1 μM imatinib detected in CID, HCD, or both fractionation modes. (E, F) Number of (E) downregulated and (F) upregulated phosphosites with 200 nM bortezomib. (G) Distribution of class I (≥75% site localization probability by MaxQuant) phosphorylation sites of imatinib-treated cells versus control cells, represented in a scatter plot as log2 ratio. Most-regulated phosphosites are labeled with upregulated sites on the right (red) and downregulated sites on the left (green). (H) Phosphorylation site scatter plot of bortezomib-treated cells.
Imatinib treatment led to downregulation of phosphopeptides involved in the BCR–ABL pathway (p-value 9.32 × 10⁻¹⁰ by DAVID) (Figures 2G and 3A; Figure S4A). Among those were Abelson murine leukemia viral oncogene homologue 1 (ABL1) phosphopeptide with pY439 and the breakpoint cluster region protein (BCR) with pY177, pY644, and pY906 phosphopeptides (components of the fusion oncoprotein BCR–ABL). Associated proteins downstream of BCR–ABL including GRB2-associated binding protein 2 (GAB2), Src homology 2 domain containing protein (SHC1), son of sevenless homologue 1 (SOS1), mitogen-activated protein kinase 1 (MAPK1 or ERK2), and signal transducer and activator of transcription (STAT5). Phosphatidylinositol-3,4,5-trisphosphate 5-phosphatase (SHIP2) and nonreceptor protein tyrosine phosphatase type II (SHP2) also displayed downregulated phosphosites. SHC1 site pY427 and sites pY986 on SHIP2 and pY187 on ERK2 all have a direct ABL kinase link,65 though none fit well to the published ABL motif (I/V/LYXXP/F).66 Figure 2G shows a scatter plot of all identified and quantified pSTY sites as log2 imatinib/DMSO ratio versus log10 MS1 peak intensity. Peptide sequences, including phosphorylation site localization and SILAC ratios, from all experiments can be found in Data set S1.
Figure 3.
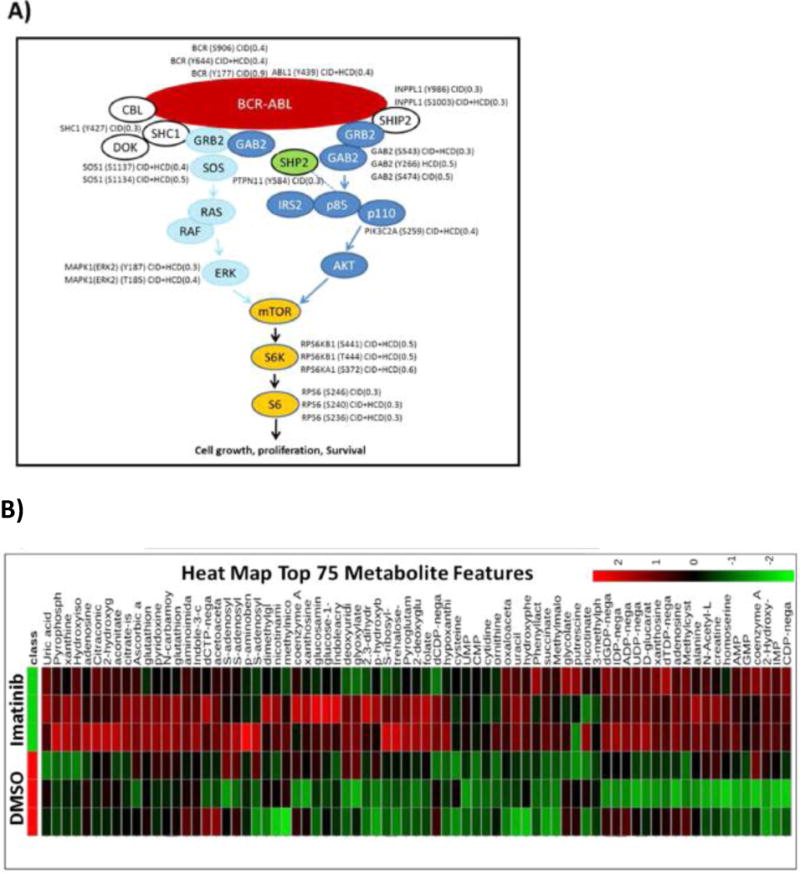
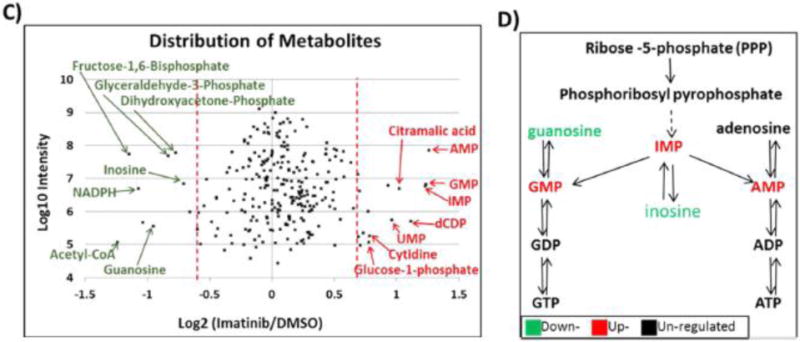
(A) All identified proteins in the BCR–ABL pathway by LC/MS/MS, including phosphosites identified and their SILAC ratio regulation (imatinib/DMSO). (B) Heat map of 75 most regulated metabolites by targeted LC/MS/MS via SRM with positive/negative polarity switching, generated by integrating Q3 peak areas and statistical clustering. (C) Distribution of all identified polar metabolites from imatinib versus DMSO vehicle control treated cells, represented in a scatter plot. The most regulated metabolites, labeled in red (upregulated) or green (downregulated), were those from nucleosides (down) and RNA mononucleotides (up). (D) Basic purine pathway, with various nucleotides and nucleosides that were imatinib regulated within our data set.
Among the 215 phosphopeptides upregulated by imatinib (136 in CID, 101 in HCD, and 22 overlaps) (Figure 2D) were a surprising number of proteins involved in RNA processing (p-value 2.72 × 10⁻³ by DAVID) (Figure 2G; Figure S4A), including splicing factor non-POU domain-containing octamer-binding protein (NONO) (S149) and poly(rC) binding protein 3 (PCBP3) (S139 and S143); heterogeneous nuclear ribonucleoproteins (HNRNPs) A1/2 (S199), A2B1 (T176), and L-like (S59); RNA binding proteins RBM39 (S100) and RBM14 (S278); and small nucleolar RNA-associated protein 14, homologue A (UTP14A) (S451). Interestingly, most of these proteins form the ribonucleoprotein complex.67–70 Phosphorylation of splicing factors influences their binding to target mRNAs, subcellular localization, and alternative splicing, all of which control various stages of mRNA transcription. One of the upregulated phosphosites, S199 on HNRNPA1 (SQRGRSGpSGNFGGGR), contains the AKT1 binding motif (RXRXXS/T)71 and is known to shuttle between the nucleus and cytoplasm, where it can be phosphorylated by AKT1, a connection to kinase signaling.72 Other RNA binding proteins with upregulated serine sites included RNA helicases (DDX5, DDX54, DHX9, and DDX20). Additionally, the serine/threonine protein kinase mammalian target of rapamycin (mTOR) at S1261 was found to be upregulated after imatinib treatment. This site has been shown to be insulin–PI3K–AKT dependent,73 and upregulation in this context may implicate mTOR in RNA transcription. Additional upregulated phosphorylation sites include cyclin-dependent kinase 16 (CDK16) (S184) and c-Jun amino-terminal kinase-interacting protein 4 (SPAG9) (S203). The enzyme 6-phosphofructo-2-kinase (PFKFB2), which phosphorylates fructose to fructose 6- phosphate in glycolysis, is upregulated on T475 and this site could be involved in regulating glycolysis. Imatinib treatment causes DNA damage,74 and DNA repair proteins such as RAD50, MCM5, MSH6, MDC1, and PNKP also contained upregulated phosphosites.75–79
Bortezomib inhibits the catalytic site of the 26S proteasome and prevents degradation of ubiquitinylated proteins, thereby increasing antiproliferative and pro-apoptotic activity.80–82 Following 16 h of bortezomib treatment, 341 phosphosites were upregulated (256 in CID, 178 in HCD, and 93 overlaps; Figure 2F). A majority of upregulated phosphoproteins are involved in apoptosis (p-value 2.07 × 10⁻⁴ by DAVID) (Figure 2H; Figure S4B), such as S28 on serine/threonine kinase 17A (STK17A), also known as death receptor-associated kinase 1 (DRAK1), and S13 on PMA-induced protein 1 (PMAIP1), a protein required for apoptosis in response to glucose stress.83 Bortezomib also resulted in 327 downregulated phosphosites (259 in CID, 131 in HCD, and 63 overlaps) (Figure 2E,H). S186 on BARD1 (Figure S3D) plays a central role in cell cycle control in response to DNA damage, and S254 on nucleophosmin (NPM1) were significantly downregulated after bortezomib treatment.84 These data are predictable responses to proteasome inhibition.
Surprisingly, in addition to suppressing signaling on known BCR–ABL targets, the phosphoproteomics data set showed a significantly high number of regulated phosphosites on proteins in RNA processing (p-value 1.05 × 10⁻³ by DAVID) and mRNA splicing (p-value 7.31 × 10⁻⁴ by DAVID) in response to imatinib. Bortezomib caused nonspecific upregulation of a large number of phosphosites and deregulation of multiple pathways; we focused our efforts for the metabolomics and lipidomics experiments only on imatinib-treated BCR–ABL-positive H929 cells for the subsequent triomics analyses. Data set S2 shows the DAVID results.
Polar Metabolomics
To understand the metabolic requirements for growth and proliferation of BCR–ABL-positive H929 cells, we examined the products of 1 h imatinib treatment using selected reaction monitoring (SRM)-based targeted mass spectrometry (LC/MS/MS) platform with positive/negative polarity switching on a 5500 QTRAP system.3,22,23,85–87 Data were generated and analyses were performed with MultiQuant and MetaboAnalyst informatics software. A heat map of the top 75 significantly regulated metabolites (Ward clustering) was generated, and imatinib-treated H929 cells showed a distinct pattern relative to DMSO control cells (Figure 3B). Interestingly, this analysis revealed few metabolites that were significantly up- or downregulated on the basis of values at least 1.5 times the mean (Figure 3C; Figure S5A). A lower threshold value was used since metabolites overall showed less regulation than phosphosites. Imatinib treatment showed an increase in precursors of RNA/DNA synthesis including adenosine, guanosine, uridine, and inosine monophosphates (AMP, GMP, UMP, and IMP) and the deoxynucleotide deoxycytidine diphosphate, dCDP (Figure 3B–D; Figure S5A). Previous studies have shown that imatinib can increase nucleotide levels.25,88,89 In contrast, nucleosides such as inosine and guanosine, as well as other important key metabolites such as acetyl-CoA and reduced nicotinamide adenine dinucleotide phosphate (NADPH), were downregulated with imatinib treatment. Acetyl-CoA is a key player in the citric acid cycle (tricarboxylic acid or TCA cycle) as well as fatty acid metabolism, and NADPH is used as a cofactor in lipid and nucleic acid synthesis.90 The glycolysis pathway and its intermediates such as fructose 1,6-bisphosphate (F1,6BP), glyceraldehyde 3-phosphate (G3P), and dihydroxyacetone phosphate (DHAP) were also downregulated with imatinib (Figure 3B–D) and previous reports have shown that glycolysis and the pentose phosphate pathway (PPP) can be inhibited with imatinib.25,88,89,91 The table of Q3 peak areas for detected metabolites with and without imatinib treatment is available in Data set S3. To further assess the enhanced glycolysis and PPP dependence of BCR–ABL H929 cells and the inhibiting effect of imatinib, we examined changes in a metabolic flux tracing experiment. Cells were labeled with carbon-13 via [13C6]glucose overnight for steady-state incorporation, followed by 1 h of imatinib treatment (Figure S6A–C). Metabolic intermediates central to the glycolysis, PPP, and TCA cycle were targeted by SRM for both unlabeled and fully labeled forms, and the percentage of 13C incorporation was measured (Data set S4). We confirmed that imatinib inhibits glycolysis, as many glycolytic intermediates are higher in the control group compared to the imatinib-treated group, especially for 3-phosphoglycerate (3-PG), DHAP, and F1,6BP (Figure S6A). 13C incorporation of glucose through the PPP showed similar decreases in metabolic intermediates, which were consistent across all five main members of the pathway, including oxidative intermediates 6-phosphogluconolactone and 6-phospho-D-gluconate and nonoxidative intermediates ribose 5-phosphate (R5P), sedoheptulose 7-phosphate (S7P), and G3P (Figure S6B). The TCA cycle showed little to no regulation by imatinib (Figure S6C), data that are consistent with our glucose/glutamine starvation and metabolic inhibitor experiments that suggested a strong dependence of BCR–ABL H929 cells on the glucose–PPP pathway (Figure 1D; Figure S1).
Global Lipidomics
Since imatinib reduced acetyl-CoA levels in H929 cells and acetyl-CoA is essential building block of fatty acids via acetyl-CoA carboxylase (ACACA)92 along with malonyl-CoA and fatty acid synthase (FAS),93 we performed a global lipidomics study to assess how lipid synthesis and lipid levels in H929 cells were affected by imatinib treatment. As before, we analyzed cells treated with 1 μM imatinib for 1 h and with DMSO control. Nonpolar lipids were extracted with methyl tert-butyl ether (MTBE)56 to look for cellular regulation in lipid classes and fatty acid profiles. Lipid extracts were subjected to C18 reversed-phase nontargeted LC/MS/MS on a high-resolution QExactive Plus Orbitrap with positive/negative ion polarity switching in DDA mode. Lipids were identified and quantified by use of LipidSearch software. The platform identifies individual intact lipid molecules on the basis of their molecular weight and fragmentation patterns from headgroup and fatty acid composition.5,94 By use of LipidSearch software, 3,063 lipid molecules were identified. Figure 4A shows a heat map of the top 75 most significant features (Ward clustering) between DMSO control and imatinib-treated cells, and the scatter plot in Figure 4B and bar plot in Figure S5B shows the most highly up- or downregulated lipid molecules on the basis of values at least 2.0 times the mean. Overall, lipid metabolism and/or fatty acid synthesis showed an inhibitory effect with imatinib treatment, with an overall decrease in total lipid levels by ∼25% (Figure 4A,B; Figure S7). On the basis of data in Figure 4 and Figure S7, a subset of triglyceride (TG), lysophosphatidylcholine (LPC), and phosphatidylcholine (PC) lipids were the most downregulated lipid molecules with imatinib, while highly upregulated lipid molecules included mostly a subset of phosphatidylethanolamine (PE), phosphatidylinositol (PI), and PC lipid molecules. The most abundant lipid classes by MS1 peak area detected in H929 cells were PC, PE, TG, and sphingomyelin (SM) (Figure S7A). We also extracted the fatty acids produced by early de novo synthesis, including palmitate (C16:0), stearate (C18:0), and oleate (C18:1), which were also the most abundant fatty acid chains detected within lipid molecules (Figure S7B). From palmitate, a series of elongation factors take palmitate to stearate, arachidate (C20:0), etc., and desaturation of palmitate and stearate with stearoyl-CoA desaturase 1 (SCD1) leads to oleate as well as longer fatty acid lengths.95
Figure 4.
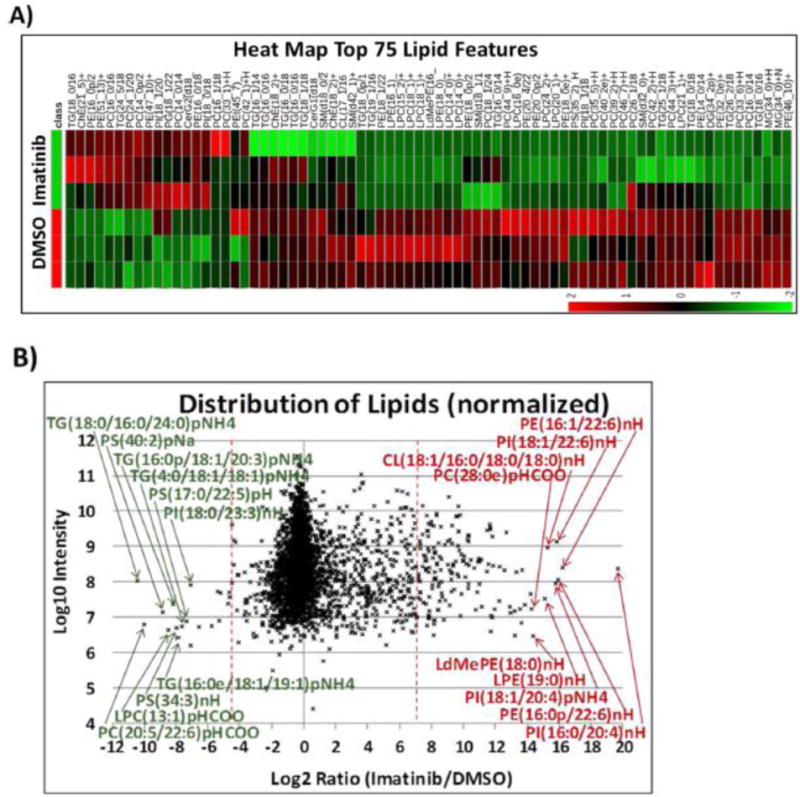
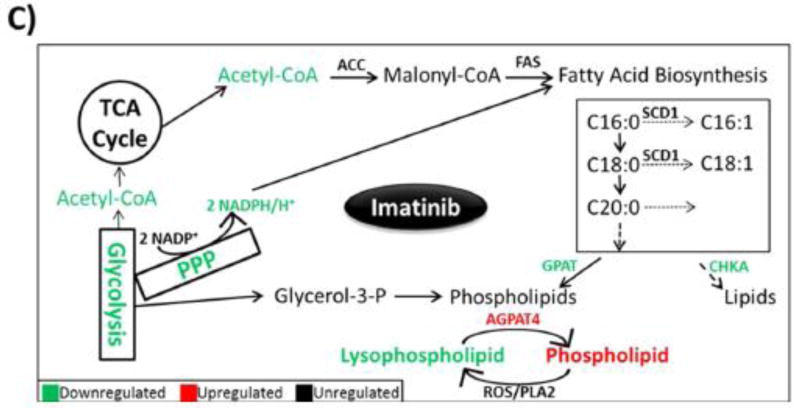
(A) Heat map of 75 most regulated lipids by data-dependent LC/MS/MS with positive/negative polarity switching, generated by integration of MS1 peak areas after MS2 identification and relative quantification. (B) Distribution of all lipids identified from imatinib-treated versus control H929 cells, represented in a scatter plot as log2 ratio. Data show a decrease of overall lipid levels with imatinib treatment. (C) Schematic of lipid biosynthesis pathway in cells, from central carbon metabolism through lipid synthesis, and molecules that were regulated from our data sets.
The overall decrease in global lipid levels (Figure 4B; Figure S7) is consistent with the polar metabolomics data, which showed that both acetyl-CoA and NADPH decrease in abundance with imatinib treatment. Acetyl-CoA carboxylase (ACC) transforms acetyl-CoA into malonyl-CoA, which is then fed into the fatty acid synthesis pathway with the reducing agent NADPH;96 the basic pathway is shown in Figure 4C. These represent fatty acid chains within the identified intact molecules, not free fatty acids; nevertheless, these data are indicative of the utilization of specific chains in fatty acid synthesis. The data show that the saturated lipid chains palmitate and stearate are downregulated by approximately 25% in imatinib-treated cells, similar to the overall lipid molecule data; however, the saturated building block oleate did not change significantly. Figure S8 shows the top 25 lipid classes in abundance and that, overall, they are downregulated by imatinib treatment. The table of lipid MS1 peak areas and their identification across sample conditions can be found in Data set S5.
Imatinib Effect on RNA Levels
The triomics study revealed a unique influence of imatinib on RNA processes in BCR–ABL H929 cells. Phosphoproteomics data showed not only downregulation of imatinib-related targets in the BCR–ABL pathways but also an increase in phosphorylation sites on RNA processing proteins, while metabolomics and lipidomics data showed accumulation of RNA mononucleotides as well as downregulation of glycolytic metabolites and acetyl-CoA, resulting in overall downregulation of lipid levels. We performed additional experiments to assess imatinib effects on cellular RNA levels. We tested both cytoplasmic and nuclear mRNA levels after 1 and 16 h treatment with 1 μM imatinib in order to assess cellular localization effects on RNA. The results shown in Figure S6D,E revealed that only short (1 h) imatinib treatment increased the amount of total RNA in both the cytoplasm and nucleus; RNA levels were reduced after prolonged exposure of 16 h in both compartments as apoptosis set in. Analysis of nascent mRNA (newly synthesized RNA) under treatment of imatinib versus vehicle control showed a decrease of newly synthesized mRNA in imatinib-treated cells from 1 and 16 h time points (Figure S6F). These results suggest that imatinib has an inhibitory effect on the production of newly synthesized mRNA; therefore, the increase in cytoplasmic and nuclear total RNA levels is likely due to an inhibition of RNA degradation.
CONCLUSIONS
Taken together, a mass spectrometry-based triomics platform can examine the global effect of drugs such as protein kinase inhibitors on a biological system including cancer cells, organ tissue, bodily fluids, etc. (Figure 5). In this study, we used three different types of mass spectrometers: Orbitrap Elite for SILAC phosphoproteomics, 5500 QTRAP for targeted polar metabolomics, and QExactive Plus Orbitrap for nontargeted nonpolar lipidomics. However, a single instrument could be used for the entire study by adjusting the chromatographic and analytic conditions. Using a combination of global quantitative phosphoproteomics, targeted polar metabolomics, and untargeted nonpolar lipidomics in BCR–ABL H929 cells, we discovered the following: (1) Imatinib caused expected inhibition of phosphorylation of various BCR–ABL pathway targets through ERK. (2) Imatinib increased phosphorylation levels of splicing factors involved in RNA processing. (3) Imatinib inhibited glucose uptake via glycolysis and PPP through acetyl-CoA and NADPH as well as causing accumulation of RNA mononucleotides. (4) Imatinib caused global inhibition of lipid biosynthesis and a significant decrease in lysophospholipids (LPs). While bortezomib causes widespread deregulation of the cell, the data showed that, within 1 h, imatinib significantly and specifically downregulated phosphorylation of BCR–ABL complex components and downstream targets but also unexpectedly upregulated phosphorylation of a series of proteins representing RNA splicing factors. Phosphorylation of these factors negatively regulates transcription in the nucleus and export of mRNA into the cytoplasm, and splicing can be regulated through phosphorylation signals.97 Imatinib resulted in elevated total RNA levels due to inhibition of degradation in the first hour, which then decreased after 16 h as apoptosis became prevalent. Imatinib also repressed metabolite levels in glycolysis and PPP, resulting in lower cellular acetyl-CoA and NADPH levels, both of which are important molecules for lipid biosynthesis. This is consistent with the reduction of global lipid levels, since BCR–ABL H929 cells exhibit dependence on the PPP, which metabolizes glucose, feeding the synthesis of nucleotides.98,99 Additionally, we identified a reduction in lysophospholipid levels with imatinib; LPs are involved in many biological processes including reproduction, etc.100
Figure 5.
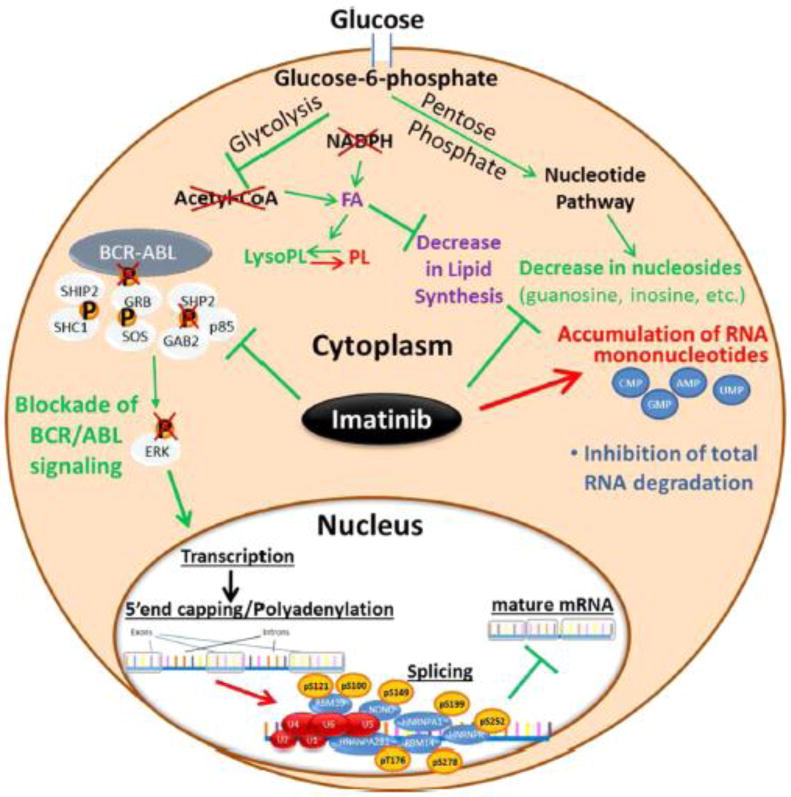
BCR–ABL pathway drives signaling in H929 cells and phosphorylation is inhibited by imatinib. Additionally, short incubation with imatinib regulates transcription through increased phosphorylation of RNA splicing factors, causing abrogation of nascent RNA production and inhibition of RNA degradation. Inhibition of newly formed RNA results in RNA mononucleotide accumulation and inhibition of the glucose-driven metabolic pathways (glycolysis and PPP) through acetyl-CoA. This results in a decrease in fatty acid and lipid biosynthesis.
Overall, these data demonstrate that multiomics technologies can be used in the study of drug effects, diseased versus normal tissue, or gene knockdown experiments to reveal new aspects of biology whose mechanism may not otherwise be deduced from a single -omics approach. One can imagine additional -omics technologies incorporated into a perturbed biological system including genomics, proteomics, lipidomics, and metabolomics to comprehensively map new disease mechanisms.
Supplementary Material
Data set S1, SILAC phosphoproteomics.
Data set S2, phosphosite pathway analysis DAVID.
Data set S3, polar metabolomics.
Data set S4, 13C-glucose metabolomic flux.
Data set S5, nonpolar lipidomics.
Acknowledgments
We thank members of the Brendan Manning and Lewis Cantley laboratories for reagents and helpful discussions. We thank Ying Xu and David Peake for help with lipidomics data. This work was supported by NIH Grants 1S10OD010612 (J.M.A.), 5P30CA006516 (J.M.A.) and 5P01CA120964 (J.M.A.). C.A.L. was supported by a Damon Runyon postdoctoral fellowship (DRG-2056-10) and Dale F. Frey award.
Footnotes
Supporting Information. The Supporting Information is available free of charge on the ACS Publications website at DOI: 10.1021/acs.analchem.5b03040.
Detailed experimental methods and eight figures illustrating metabolic activity, regulated phosphorylation sites, tandem mass spectra of regulated phosphopeptides, regulated phosphosites, metabolites and lipids, metabolic flux and RNA processes, and lipid class and fatty acid chain regulation.
Author Contributions. S.B.B. performed most of the phosphoproteomics, lipidomics, metabolomics, and biochemical experiments, analyzed data, and wrote the manuscript. M.Y. helped with mass spectrometry experiments and data analysis. K.H. helped with RNA experiments and data analysis and edited the manuscript. C.A.L. helped design metabolomics experiments, analyzed metabolomics data, and edited the manuscript. J.M.A. designed the study, analyzed mass spectrometry data, and wrote the manuscript.
Notes. The authors declare no competing financial interest.
References
- 1.Christofk HR, Wu N, Cantley LC, Asara JMJ. Proteome Res. 2011;10:4158–4164. doi: 10.1021/pr200578n. [DOI] [PMC free article] [PubMed] [Google Scholar]
- 2.Ong S-E, Blagoev B, Kratchmarova I, Kristensen DB, Steen H, Pandey A, Mann M. Mol Cell Proteomics. 2002;1:376–386. doi: 10.1074/mcp.m200025-mcp200. [DOI] [PubMed] [Google Scholar]
- 3.Yuan M, Breitkopf SB, Yang X, Asara JM. Nat Protoc. 2012;7:872–881. doi: 10.1038/nprot.2012.024. [DOI] [PMC free article] [PubMed] [Google Scholar]
- 4.Ben-Sahra I, Howell JJ, Asara JM, Manning BD. Science. 2013;339:1323–1328. doi: 10.1126/science.1228792. [DOI] [PMC free article] [PubMed] [Google Scholar]
- 5.Peake DA, Yokoi Y, Wang J, Huang Y. www.thermoscientific.com. 2013 [Google Scholar]
- 6.Gazdar AF, Oie HK, Kirsch IR, Hollis GF. Blood. 1986;67:1542–1549. [PubMed] [Google Scholar]
- 7.Breitkopf SB, Yuan M, Pihan GA, Asara JM. Proc Natl Acad Sci USA. 2012;109:16190–16195. doi: 10.1073/pnas.1212759109. [DOI] [PMC free article] [PubMed] [Google Scholar]
- 8.Martiat P, Mecucci C, Nizet Y, Stul M, Philippe M, Cassiman JJ, Michaux JL, Van den Berghe H, Sokal G. Leukemia. 1990;4:751–754. [PubMed] [Google Scholar]
- 9.Roper N, DeAngelo DJ, Kuo F, Dal Cin P, Ghobrial I, Aster JC. Am J Hematol. 2010;85:944–946. doi: 10.1002/ajh.21809. [DOI] [PMC free article] [PubMed] [Google Scholar]
- 10.Bergstrom Lind S, Artemenko KA, Elfineh L, Mayrhofer C, Zubarev RA, Bergquist J, Pettersson U. Cell Signalling. 2011;23:1387–1395. doi: 10.1016/j.cellsig.2011.03.021. [DOI] [PubMed] [Google Scholar]
- 11.Alonso A, Sasin J, Bottini N, Friedberg I, Osterman A, Godzik A, Hunter T, Dixon J, Mustelin T. Cell. 2004;117:699–711. doi: 10.1016/j.cell.2004.05.018. [DOI] [PubMed] [Google Scholar]
- 12.Takeuchi K, Ito F. Biol Pharm Bull. 2011;34:1774–1780. doi: 10.1248/bpb.34.1774. [DOI] [PubMed] [Google Scholar]
- 13.Posewitz MC, Tempst P. Anal Chem. 1999;71:2883–2892. doi: 10.1021/ac981409y. [DOI] [PubMed] [Google Scholar]
- 14.Larsen MR, Thingholm TE, Jensen ON, Roepstorff P, Jorgensen TJD. Mol Cell Proteomics. 2005;4:873–886. doi: 10.1074/mcp.T500007-MCP200. [DOI] [PubMed] [Google Scholar]
- 15.Korbel S, Schumann M, Bittorf T, Krause E. Rapid Commun. Mass Spectrom. 2005;19:2259–2271. doi: 10.1002/rcm.2054. [DOI] [PubMed] [Google Scholar]
- 16.Annan RS, Carr SA. J Protein Chem. 1997;16:391–402. doi: 10.1023/a:1026384605285. [DOI] [PubMed] [Google Scholar]
- 17.Gruhler A, Olsen JV, Mohammed S, Mortensen P, Faergeman NJ, Mann M, Jensen ON. Mol Cell Proteomics. 2005;4:310–327. doi: 10.1074/mcp.M400219-MCP200. [DOI] [PubMed] [Google Scholar]
- 18.Crutchfield CA, Lu W, Melamud E, Rabinowitz JD. Methods Enzymol. 2010;470:393–426. doi: 10.1016/S0076-6879(10)70016-1. [DOI] [PubMed] [Google Scholar]
- 19.Lu W, Bennett BD, Rabinowitz JDJ. Chromatogr B: Anal Technol Biomed Life Sci. 2008;871:236–242. doi: 10.1016/j.jchromb.2008.04.031. [DOI] [PMC free article] [PubMed] [Google Scholar]
- 20.Ying H, Kimmelman AC, Lyssiotis CA, Hua S, Chu GC, Fletcher-Sananikone E, Locasale JW, Son J, Zhang H, Coloff JL, Yan H, Wang W, Chen S, Viale A, Zheng H, Paik JH, Lim C, Guimaraes AR, Martin ES, Chang J, Hezel AF, Perry SR, Hu J, Gan B, Xiao Y, Asara JM, Weissleder R, Wang YA, Chin L, Cantley LC, DePinho RA. Cell. 2012;149:656–670. doi: 10.1016/j.cell.2012.01.058. [DOI] [PMC free article] [PubMed] [Google Scholar]
- 21.Vander Heiden MG, Cantley LC, Thompson CB. Science. 2009;324:1029–1033. doi: 10.1126/science.1160809. [DOI] [PMC free article] [PubMed] [Google Scholar]
- 22.Ben-Sahra I, Howell JJ, Asara JM, Manning BD. Science. 2013;339:1323–1328. doi: 10.1126/science.1228792. [DOI] [PMC free article] [PubMed] [Google Scholar]
- 23.Son J, Lyssiotis CA, Ying H, Wang X, Hua S, Ligorio M, Perera RM, Ferrone CR, Mullarky E, Shyh-Chang N, Kang Y, Fleming JB, Bardeesy N, Asara JM, Haigis MC, DePinho RA, Cantley LC, Kimmelman AC. Nature. 2013;496:101–105. doi: 10.1038/nature12040. [DOI] [PMC free article] [PubMed] [Google Scholar]
- 24.Ding J, Li T, Wang X, Zhao E, Choi JH, Yang L, Zha Y, Dong Z, Huang S, Asara JM, Cui H, Ding HF. Cell Metab. 2013;18:896–907. doi: 10.1016/j.cmet.2013.11.004. [DOI] [PMC free article] [PubMed] [Google Scholar]
- 25.Gottschalk S, Anderson N, Hainz C, Eckhardt SG, Serkova N. J Clin Cancer Res. 2004;10:6661–6668. doi: 10.1158/1078-0432.CCR-04-0039. [DOI] [PubMed] [Google Scholar]
- 26.Kominsky DJ, Klawitter J, Brown JL, Boros LG, Melo JV, Eckhardt SG, Serkova N. J Clin Cancer Res. 2009;15:3442–3450. doi: 10.1158/1078-0432.CCR-08-3291. [DOI] [PubMed] [Google Scholar]
- 27.Zhao F, Mancuso A, Bui TV, Tong X, Gruber JJ, Swider CR, Sanchez PV, Lum JJ, Sayed N, Melo JV, Perl AE, Carroll M, Tuttle SW, Thompson CB. Oncogene. 2010;29:2962–2972. doi: 10.1038/onc.2010.67. [DOI] [PMC free article] [PubMed] [Google Scholar]
- 28.Bird SS, Stavrovskaya IG, Gathungu RM, Tousi F, Kristal BS. Methods Mol Biol. 2015;1264:441–452. doi: 10.1007/978-1-4939-2257-4_36. [DOI] [PMC free article] [PubMed] [Google Scholar]
- 29.Cajka T, Fiehn O. TrAC, Trends Anal Chem. 2014;61:192–206. doi: 10.1016/j.trac.2014.04.017. [DOI] [PMC free article] [PubMed] [Google Scholar]
- 30.Myers DS, Ivanova PT, Milne SB, Brown HA. Biochim Biophys Acta, Mol Cell Biol Lipids. 2011;1811:748–757. doi: 10.1016/j.bbalip.2011.05.015. [DOI] [PMC free article] [PubMed] [Google Scholar]
- 31.Nygren H, Seppanen-Laakso T, Castillo S, Hyotylainen T, Oresic M. Methods Mol Biol. 2011;708:247–257. doi: 10.1007/978-1-61737-985-7_15. [DOI] [PubMed] [Google Scholar]
- 32.Masoodi M, Eiden M, Koulman A, Spaner D, Volmer DA. Anal Chem. 2010;82:8176–8185. doi: 10.1021/ac1015563. [DOI] [PubMed] [Google Scholar]
- 33.Takenawa T, Itoh T. Biochim Biophys Acta Mol Cell Biol Lipids. 2001;1533:190–206. doi: 10.1016/s1388-1981(01)00165-2. [DOI] [PubMed] [Google Scholar]
- 34.Wenk MR, De Camilli P. Proc Natl Acad Sci USA. 2004;101:8262–8269. doi: 10.1073/pnas.0401874101. [DOI] [PMC free article] [PubMed] [Google Scholar]
- 35.Meierhofer D, Weidner C, Sauer S. J Proteome Res. 2014;13:5592–5602. doi: 10.1021/pr5005828. [DOI] [PubMed] [Google Scholar]
- 36.Decourcelle M, Perez-Fons L, Baulande S, Steiger S, Couvelard L, Hem S, Zhu C, Capell T, Christou P, Fraser P, Sandmann G. J Exp Bot. 2015;66:3141–3150. doi: 10.1093/jxb/erv120. [DOI] [PMC free article] [PubMed] [Google Scholar]
- 37.Gruden K, Hren M, Herman A, Blejec A, Albrecht T, Selbig J, Bauer C, Schuchardt J, Or-Guil M, Zupancic K, Svajger U, Stabuc B, Ihan A, Kopitar AN, Ravnikar M, Knezevic M, Rozman P, Jeras M. PLoS One. 2012;7:e28761. doi: 10.1371/journal.pone.0028761. [DOI] [PMC free article] [PubMed] [Google Scholar]
- 38.Ji B, Ernest B, Gooding JR, Das S, Saxton AM, Simon J, Dupont J, Metayer-Coustard S, Campagna SR, Voy BH. BMC Genomics. 2012;13:441. doi: 10.1186/1471-2164-13-441. [DOI] [PMC free article] [PubMed] [Google Scholar]
- 39.Kersten B, Ghirardo A, Schnitzler JP, Kanawati B, Schmitt-Kopplin P, Fladung M, Schroeder H. BMC Genomics. 2013;14:737. doi: 10.1186/1471-2164-14-737. [DOI] [PMC free article] [PubMed] [Google Scholar]
- 40.Wagele B, Witting M, Schmitt-Kopplin P, Suhre K. PLoS One. 2012;7:e39860. doi: 10.1371/journal.pone.0039860. [DOI] [PMC free article] [PubMed] [Google Scholar]
- 41.Shao WH, Chen JJ, Fan SH, Lei Y, Xu HB, Zhou J, Cheng PF, Yang YT, Rao CL, Wu B, Liu HP, Xie P. OMICS. 2015;19:383–392. doi: 10.1089/omi.2014.0164. [DOI] [PMC free article] [PubMed] [Google Scholar]
- 42.Webhofer C, Gormanns P, Reckow S, Lebar M, Maccarrone G, Ludwig T, Putz B, Asara JM, Holsboer F, Sillaber I, Zieglgansberger W, Turck CW. J Psychiatr Res. 2013;47:289–298. doi: 10.1016/j.jpsychires.2012.11.003. [DOI] [PubMed] [Google Scholar]
- 43.Wei L, Wang Q, Ning X, Mu C, Wang C, Cao R, Wu H, Cong M, Li F, Ji C, Zhao J. Comp Biochem Physiol, Part D: Genomics Proteomics. 2015;13:16–23. doi: 10.1016/j.cbd.2014.12.001. [DOI] [PubMed] [Google Scholar]
- 44.Wettersten HI, Hakimi AA, Morin D, Bianchi C, Johnstone ME, Donohoe DR, Trott JF, Aboud OA, Stirdivant S, Neri B, Wolfert R, Stewart B, Perego R, Hsieh JJ, Weiss RH. Cancer Res. 2015;75:2541–2552. doi: 10.1158/0008-5472.CAN-14-1703. [DOI] [PMC free article] [PubMed] [Google Scholar]
- 45.Zhang Q, Lu YX, Xu WH. J Proteome Res. 2012;11:1042–1053. doi: 10.1021/pr200796a. [DOI] [PubMed] [Google Scholar]
- 46.Buschow SI, Lasonder E, van Deutekom HW, Oud MM, Beltrame L, Huynen MA, de Vries IJ, Figdor CG, Cavalieri D. J Proteome Res. 2010;9:1727–1737. doi: 10.1021/pr9008546. [DOI] [PubMed] [Google Scholar]
- 47.Bouchal P, Dvorakova M, Roumeliotis T, Bortlicek Z, Ihnatova I, Prochazkova I, Ho JT, Maryas J, Imrichova H, Budinska E, Vyzula R, Garbis SD, Vojtesek B, Nenutil R. Mol Cell Proteomics. 2015;14:1814–1830. doi: 10.1074/mcp.M114.041335. [DOI] [PMC free article] [PubMed] [Google Scholar]
- 48.Fagerberg L, Hallstrom BM, Oksvold P, Kampf C, Djureinovic D, Odeberg J, Habuka M, Tahmasebpoor S, Danielsson A, Edlund K, Asplund A, Sjostedt E, Lundberg E, Szigyarto CA, Skogs M, Takanen JO, Berling H, Tegel H, Mulder J, Nilsson P, Schwenk JM, Lindskog C, Danielsson F, Mardinoglu A, Sivertsson A, von Feilitzen K, Forsberg M, Zwahlen M, Olsson I, Navani S, Huss M, Nielsen J, Ponten F, Uhlen M. Mol Cell Proteomics. 2014;13:397–406. doi: 10.1074/mcp.M113.035600. [DOI] [PMC free article] [PubMed] [Google Scholar]
- 49.Kampf C, Mardinoglu A, Fagerberg L, Hallstrom BM, Danielsson A, Nielsen J, Ponten F, Uhlen M. Proteomics. 2014;14:2498–2507. doi: 10.1002/pmic.201400201. [DOI] [PubMed] [Google Scholar]
- 50.Wang J, Mei H, Zheng C, Qian H, Cui C, Fu Y, Su J, Liu Z, Yu Z, He J. Mol Cell Proteomics. 2013;12:1363–1376. doi: 10.1074/mcp.M112.023986. [DOI] [PMC free article] [PubMed] [Google Scholar]
- 51.Yang S, Pan C, Hurst GB, Dice L, Davison BH, Brown SD. Front Microbiol. 2014;5:246. doi: 10.3389/fmicb.2014.00246. [DOI] [PMC free article] [PubMed] [Google Scholar]
- 52.Dinasarapu AR, Gupta S, Ram Maurya M, Fahy E, Min J, Sud M, Gersten MJ, Glass CK, Subramaniam S. Bioinformatics. 2013;29:2735–2743. doi: 10.1093/bioinformatics/btt469. [DOI] [PMC free article] [PubMed] [Google Scholar]
- 53.Qi Y, Jiang C, Cheng J, Krausz KW, Li T, Ferrell JM, Gonzalez FJ, Chiang JY. Biochim Biophys Acta, Mol Cell Biol Lipids. 2015;1851:19–29. doi: 10.1016/j.bbalip.2014.04.008. [DOI] [PMC free article] [PubMed] [Google Scholar]
- 54.Zhao C, Mao J, Ai J, Shenwu M, Shi T, Zhang D, Wang X, Wang Y, Deng Y. BMC Med Genomics. 2013;6(Suppl 1):S12. doi: 10.1186/1755-8794-6-S1-S12. [DOI] [PMC free article] [PubMed] [Google Scholar]
- 55.Caesar R, Manieri M, Kelder T, Boekschoten M, Evelo C, Muller M, Kooistra T, Cinti S, Kleemann R, Drevon CA. PLoS One. 2010;5:e11525. doi: 10.1371/journal.pone.0011525. [DOI] [PMC free article] [PubMed] [Google Scholar]
- 56.Matyash V, Liebisch G, Kurzchalia TV, Shevchenko A, Schwudke DJ. Lipid Res. 2008;49:1137–1146. doi: 10.1194/jlr.D700041-JLR200. [DOI] [PMC free article] [PubMed] [Google Scholar]
- 57.Bonvini P, Zorzi E, Basso G, Rosolen A. Leukemia. 2007;21:838–842. doi: 10.1038/sj.leu.2404528. [DOI] [PubMed] [Google Scholar]
- 58.Codony-Servat J, Tapia MA, Bosch M, Oliva C, Domingo-Domenech J, Mellado B, Rolfe M, Ross JS, Gascon P, Rovira A, Albanell J. Mol Cancer Ther. 2006;5:665–675. doi: 10.1158/1535-7163.MCT-05-0147. [DOI] [PubMed] [Google Scholar]
- 59.Bantscheff M, Eberhard D, Abraham Y, Bastuck S, Boesche M, Hobson S, Mathieson T, Perrin J, Raida M, Rau C, Reader V, Sweetman G, Bauer A, Bouwmeester T, Hopf C, Kruse U, Neubauer G, Ramsden N, Rick J, Kuster B, Drewes G. Nat Biotechnol. 2007;25:1035–1044. doi: 10.1038/nbt1328. [DOI] [PubMed] [Google Scholar]
- 60.Breitkopf SB, Asara JM. Curr Protoc Mol Biol. 2012;1819(19):98. 1–18, 27. doi: 10.1002/0471142727.mb1819s98. [DOI] [PMC free article] [PubMed] [Google Scholar]
- 61.Breitkopf SB, Oppermann FS, Keri G, Grammel M, Daub HJ. Proteome Res. 2010;9:6033–6043. doi: 10.1021/pr1008527. [DOI] [PubMed] [Google Scholar]
- 62.Ong S-E, Mann M. Nat Protoc. 2007;1:2650–2660. doi: 10.1038/nprot.2006.427. [DOI] [PubMed] [Google Scholar]
- 63.Lundby A, Secher A, Lage K, Nordsborg NB, Dmytriyev A, Lundby C, Olsen JV. Nat Commun. 2012;3:876. doi: 10.1038/ncomms1871. [DOI] [PMC free article] [PubMed] [Google Scholar]
- 64.Huttlin EL, Jedrychowski MP, Elias JE, Goswami T, Rad R, Beausoleil SA, Villen J, Haas W, Sowa ME, Gygi SP. Cell. 2010;143:1174–1189. doi: 10.1016/j.cell.2010.12.001. [DOI] [PMC free article] [PubMed] [Google Scholar]
- 65.Goss VL, Lee KA, Moritz A, Nardone J, Spek EJ, MacNeill J, Rush J, Comb MJ, Polakiewicz RD. Blood. 2006;107:4888–4897. doi: 10.1182/blood-2005-08-3399. [DOI] [PMC free article] [PubMed] [Google Scholar]
- 66.Songyang Z, Carraway KL, 3rd, Eck MJ, Harrison SC, Feldman RA, Mohammadi M, Schlessinger J, Hubbard SR, Smith DP, Eng C, et al. Nature. 1995;373:536–539. doi: 10.1038/373536a0. [DOI] [PubMed] [Google Scholar]
- 67.Kameoka S, Duque P, Konarska MM. EMBO J. 2004;23:1782–1791. doi: 10.1038/sj.emboj.7600187. [DOI] [PMC free article] [PubMed] [Google Scholar]
- 68.Chkheidze AN, Liebhaber SA. Mol Cell Biol. 2003;23:8405–8415. doi: 10.1128/MCB.23.23.8405-8415.2003. [DOI] [PMC free article] [PubMed] [Google Scholar]
- 69.Tsuruno C, Ohe K, Kuramitsu M, Kohma T, Takahama Y, Hamaguchi Y, Hamaguchi I, Okuma K. Biochem Biophys Res Commun. 2011;406:512–517. doi: 10.1016/j.bbrc.2011.02.059. [DOI] [PubMed] [Google Scholar]
- 70.McGlincy NJ, Tan LY, Paul N, Zavolan M, Lilley KS, Smith CW. BMC Genomics. 2010;11:565. doi: 10.1186/1471-2164-11-565. [DOI] [PMC free article] [PubMed] [Google Scholar]
- 71.Manning BD, Cantley LC. Cell. 2007;129:1261–1274. doi: 10.1016/j.cell.2007.06.009. [DOI] [PMC free article] [PubMed] [Google Scholar]
- 72.Allemand E, Guil S, Myers M, Moscat J, Caceres JF, Krainer AR. Proc Natl Acad Sci USA. 2005;102:3605–3610. doi: 10.1073/pnas.0409889102. [DOI] [PMC free article] [PubMed] [Google Scholar]
- 73.Acosta-Jaquez HA, Keller JA, Foster KG, Ekim B, Soliman GA, Feener EP, Ballif BA, Fingar DC. Mol Cell Biol. 2009;29:4308–4324. doi: 10.1128/MCB.01665-08. [DOI] [PMC free article] [PubMed] [Google Scholar]
- 74.Czechowska A, Poplawski T, Drzewoski J, Blasiak J. Chem Biol Interact. 2005;152:139–150. doi: 10.1016/j.cbi.2005.03.002. [DOI] [PubMed] [Google Scholar]
- 75.Dolganov GM, Maser RS, Novikov A, Tosto L, Chong S, Bressan DA, Petrini JH. Mol Cell Biol. 1996;16:4832–4841. doi: 10.1128/mcb.16.9.4832. [DOI] [PMC free article] [PubMed] [Google Scholar]
- 76.Sakwe AM, Nguyen T, Athanasopoulos V, Shire K, Frappier L. Mol Cell Biol. 2007;27:3044–3055. doi: 10.1128/MCB.02384-06. [DOI] [PMC free article] [PubMed] [Google Scholar]
- 77.Wang Y, Cortez D, Yazdi P, Neff N, Elledge SJ, Qin J. Genes Dev. 2000;14:927–939. [PMC free article] [PubMed] [Google Scholar]
- 78.Mochan TA, Venere M, DiTullio RA, Jr, Halazonetis TD. Cancer Res. 2003;63:8586–8591. [PubMed] [Google Scholar]
- 79.Jilani A, Ramotar D, Slack C, Ong C, Yang XM, Scherer SW, Lasko DD. J Biol Chem. 1999;274:24176–24186. doi: 10.1074/jbc.274.34.24176. [DOI] [PubMed] [Google Scholar]
- 80.Mermoud JE, Cohen PT, Lamond AI. EMBO J. 1994;13:5679–5688. doi: 10.1002/j.1460-2075.1994.tb06906.x. [DOI] [PMC free article] [PubMed] [Google Scholar]
- 81.Kornblihtt AR, de la Mata M, Fededa JP, Munoz MJ, Nogues G. RNA. 2004;10:1489–1498. doi: 10.1261/rna.7100104. [DOI] [PMC free article] [PubMed] [Google Scholar]
- 82.Leoutsakou T, Talieri M, Scorilas A. Biochem Biophys Res Commun. 2006;344:667–674. doi: 10.1016/j.bbrc.2006.03.184. [DOI] [PubMed] [Google Scholar]
- 83.Lowman XH, McDonnell MA, Kosloske A, Odumade OA, Jenness C, Karim CB, Jemmerson R, Kelekar A. Mol Cell. 2010;40:823–833. doi: 10.1016/j.molcel.2010.11.035. [DOI] [PubMed] [Google Scholar]
- 84.Choudhury AD, Xu H, Modi AP, Zhang W, Ludwig T, Baer RJ. Biol Chem. 2005;280:24669–24679. doi: 10.1074/jbc.M502446200. [DOI] [PubMed] [Google Scholar]
- 85.Nicolay BN, Gameiro PA, Tschop K, Korenjak M, Heilmann AM, Asara JM, Stephanopoulos G, Iliopoulos O, Dyson NJ. Genes Dev. 2013;27:182–196. doi: 10.1101/gad.206227.112. [DOI] [PMC free article] [PubMed] [Google Scholar]
- 86.Janzer A, German NJ, Gonzalez-Herrera KN, Asara JM, Haigis MC, Struhl K. Proc Natl Acad Sci USA. 2014;111:10574–10579. doi: 10.1073/pnas.1409844111. [DOI] [PMC free article] [PubMed] [Google Scholar]
- 87.Kelly AD, Breitkopf SB, Yuan M, Goldsmith J, Spentzos D, Asara JM. PLoS One. 2011;6:e25357. doi: 10.1371/journal.pone.0025357. [DOI] [PMC free article] [PubMed] [Google Scholar]
- 88.A J, Qian S, Wang G, Yan B, Zhang S, Huang Q, Ni L, Zha W, Liu L, Cao B, Hong M, Wu H, Lu H, Shi J, Li M, Li J. PLoS One. 2010;5:e13186. doi: 10.1371/journal.pone.0013186. [DOI] [PMC free article] [PubMed] [Google Scholar]
- 89.Breccia M, Alimena G. Leuk Res. 2009;33:871–875. doi: 10.1016/j.leukres.2009.01.040. [DOI] [PubMed] [Google Scholar]
- 90.Klawitter J, Kominsky DJ, Brown JL, Christians U, Leibfritz D, Melo JV, Eckhardt SG, Serkova NJ. Br J Pharmacol. 2009;158:588–600. doi: 10.1111/j.1476-5381.2009.00345.x. [DOI] [PMC free article] [PubMed] [Google Scholar]
- 91.Klawitter J, Kominsky DJ, Brown JL, Klawitter J, Christians U, Leibfritz D, Melo JV, Eckhardt SG, Serkova NJ. Br J Pharmacol. 2009;158:588–600. doi: 10.1111/j.1476-5381.2009.00345.x. [DOI] [PMC free article] [PubMed] [Google Scholar]
- 92.Harlan WR, Jr, Wakil SJ. J Biol Chem. 1963;238:3216–3223. [PubMed] [Google Scholar]
- 93.Yoshii Y, Furukawa T, Saga T, Fujibayashi Y. Cancer Lett. 2015;356:211–216. doi: 10.1016/j.canlet.2014.02.019. [DOI] [PubMed] [Google Scholar]
- 94.Trevino MB, Machida Y, Hallinger DR, Garcia E, Christensen A, Dutta S, Peake DA, Ikeda Y, Imai Y. Diabetes. 2015;64:1299–1310. doi: 10.2337/db14-0559. [DOI] [PMC free article] [PubMed] [Google Scholar]
- 95.Sampath H, Ntambi JM. Lipids. 2005;40:1187–1191. doi: 10.1007/s11745-005-1484-z. [DOI] [PubMed] [Google Scholar]
- 96.Mashima T, Seimiya H, Tsuruo T. Br J Cancer. 2009;100:1369–1372. doi: 10.1038/sj.bjc.6605007. [DOI] [PMC free article] [PubMed] [Google Scholar]
- 97.van Alphen RJ, Wiemer EA, Burger H, Eskens FA. Br J Cancer. 2009;100:228–232. doi: 10.1038/sj.bjc.6604801. [DOI] [PMC free article] [PubMed] [Google Scholar]
- 98.Kruger NJ, von Schaewen A. Curr Opin Plant Biol. 2003;6:236–246. doi: 10.1016/s1369-5266(03)00039-6. [DOI] [PubMed] [Google Scholar]
- 99.Kotake Y, Sagane K, Owa T, Mimori-Kiyosue Y, Shimizu H, Uesugi M, Ishihama Y, Iwata M, Mizui Y. Nat Chem Biol. 2007;3:570–575. doi: 10.1038/nchembio.2007.16. [DOI] [PubMed] [Google Scholar]
- 100.Ye X. Hum Reprod Update. 2008;14:519–536. doi: 10.1093/humupd/dmn023. [DOI] [PubMed] [Google Scholar]
Associated Data
This section collects any data citations, data availability statements, or supplementary materials included in this article.
Supplementary Materials
Data set S1, SILAC phosphoproteomics.
Data set S2, phosphosite pathway analysis DAVID.
Data set S3, polar metabolomics.
Data set S4, 13C-glucose metabolomic flux.
Data set S5, nonpolar lipidomics.