Abstract
The water-soluble carbodiimide, 1-ethyl-3-(3-(dimethylaminopropyl)-carbodiimide (EDC) is widely used in protein chemistry. We used EDC-induced gelatin cross-linking as a model for amide bond formation to resolve reaction ambiguities with common variables of buffers, gelatin concentration, and pH. Percentage changes in SEC high molecular weight peak areas were used to follow the reactions. Differences in reaction rate and extent were observed with four commonly used buffers, while differences in extent were observed for commonly used concentrations and pH. We also investigated an anhydride mechanism for aqueous EDC-induced amide bond formation that has received little attention since its proposal in 1995. Gelatin carboxyl groups had a synergistic role during the addition of hydrazine to corroborate the anhydride formation between carboxyl groups. EDC-induced degradation of gelatin was investigated using percentage changes in SEC low molecular weight peak areas. The degradation occurred in excess EDC at neutral to alkaline pH and was enhanced substantially when reacting amino groups were not available. A mechanism of EDC-induced gelatin degradation is proposed and designated the extended Khorana mechanism. This EDC side reaction has the potential to occur in peptides and proteins under similar conditions.
Keywords: carbodiimide, gelatin, amide bond formation, cross-linking, degradation, carboxylic anyhydride
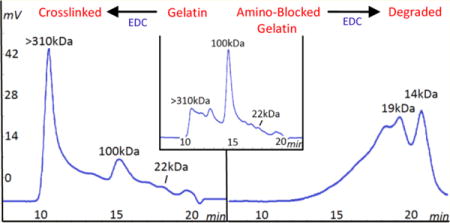
Graphical abstract
INTRODUCTION
Carbodiimides are used frequently in organic synthesis, bioconjugation, and drug delivery as evidenced by several review articles and textbook chapters.1–5 The water-soluble carbodiimide, 1-ethyl-3-(3-(dimethylaminopropyl)-carbodiimide (EDC) is a popular reagent for cross-linking two proteins or for activation of carboxylic acids for reaction with ligands containing amino groups because the resulting linkage contains only an amide (i.e., peptide) bond. However, the substantial influence of variables such as solvent, pH, stoichiometry, and side reactions has led to some ambiguity on the effects of these variables, as well as adding complexity to the amide bond formation. For example, a carboxylic anhydride intermediate for this reaction is recognized to commonly occur in organic solvents,3,4 but it has received little attention since Nakajima and Ikada6 proposed it as a major mechanism in aqueous solvents in 1995. In addition, EDC adducts on proteins after the reaction were only recently found to affect protein structure and activity.7
Gelatin is the denatured and partially hydrolyzed product of collagen. This proteinaceous material has the amino acid sequence and functional groups of proteins, as well as the random coil conformation and molecular flexibility of a water-soluble polymer. Gelatin cross-linking has been investigated in solubility issues of gelatin capsules,8 in formation of microspheres,9 and for insight into the cross-linking process itself.10 Gelatin reactions with EDC have been used in this laboratory for gelatin modification and cross-linking,11 synthesis of anticancer drug conjugates,12,13 and evaluation of drug conjugate properties on cytotoxicity.14 The close proximity, molecular flexibility, and reactivity of carboxyl and amino groups make gelatin a good substance for investigation of EDC-induced cross-linking. Such cross-linking may be used as a model for EDC-induced amide bond formation.
In our previous investigation of a gelatin drug conjugate,13 EDC was implicated in substantial gelatin degradation to lower molecular weight species. While other variables such as concentration, pH, and elevated temperature during sample preparation and analysis were involved, controls without EDC did not show degradation. If confirmed, the possibility of a degradation side reaction with EDC would have important implications for this widely used protein reagent. Analytical size exclusion chromatography is used in the current investigation to examine for both increase or decrease in molecular size. The goals of this investigation were to (1) clarify roles of the reaction variables of buffer, pH, and reactant concentration in EDC-induced amide bond formation, (2) investigate the Nakajima and Ikada6 proposed anhydride mechanism in EDC reactions, and (3) examine the possibility of EDC-induced degradation in the proteinaceous material gelatin.
EXPERIMENTAL SECTION
Materials
Type B bone gelatin with a 159 kDa molecular weight-average and 11.5% w/w moisture content was supplied by Kind and Knox (Gelita USA, Sargent Bluff, IA). The gelatin IEP of 5.1 was determined by isoelectric focusing electrophoresis.14 Citraconic anhydride, 1-ethyl-3-(3-(dimethylamino)propyl) carbodiimide HCl (EDC), hydrazine hydrate (Cat. No. 225819-50G), p-nitrobenzaldehyde, dimethylformamide, acetyl hydrazide, and water Chromasolv for HPLC were obtained from Sigma-Aldrich (St. Louis, MO). The buffer for most experiments, 2-(N-morpholino)ethanesulfonic acid (MES) and other buffers, eluent salts, and syringe filters (0.2 μm pore, SFCA, Cat. No. 09-754-13) were obtained from Fisher (Pittsburgh, PA).
EDC Reactions for Cross-Linking, Buffer Effects, and Gelatin Concentration Effects
Gelatin granules were hydrated in 10 mL of 0.05 or 0.1 M buffer at pH values of 3, 5, or 7 for 1.5 to 2 h then heated at 65 °C for 2 min to dissolve and prepare stock gelatin solutions ranging in concentration from 0.5 to 16.7 mg/mL. Reactant quantities were based on one gram of gelatin containing 1.2 mmol carboxyl groups and 0.33 mmol amino groups.15,16 Six milliliters of the stock solution was reacted with a 2.5× EDC (1.5 to 50 mM) molar excess of gelatin carboxyl groups (0.6 to 20 mM) at room temperature with mild stirring while maintaining a constant pH. Controls of gelatin solution without EDC were prepared from the same stock solution. At the appropriate times, samples were removed for HPSEC assay. Three replicates from the same stock solution were used for the gelatin concentration effect experiments, while all other replicates were from three independent stock solutions.
HPSEC Assay of Gelatin Samples
The HPLC-SEC assay of gelatin samples13 was a modification of a previously reported procedure.17 Samples were diluted to a concentration of 0.5 mg/mL in a sample solvent of 0.1 M sodium phosphate at pH 7.4 with 0.025% sodium azide, heated for 2 min at 65 °C, and filtered with a 0.2 μm syringe filter for loading into inserts and vials. A Waters Millenium HPLC system with a BioSep S4000 SEC column (Phenomenex, Torrance, CA) and mobile phase of 0.1 M sodium phosphate at pH 7.4 with 0.5% sodium lauryl sulfate was run at 0.5 mL/min with a sample chamber and column temperature of 40 °C for a 10 μL injection, a 30 min run time, and detection at 214 nm. Samples containing both gelatin and EDC were in the sample chamber no more than 1 min before injection onto the column. Polystyrenesulfonate standards (Phenomenex, Torrance, CA) ranging from 10.6 to 282 kDa Mw were used to determine molecular weights. One standard was used with each assay run to account for any shifts in peak retention times over the lifetime of the column. Calibration plots were constructed with the standards from several assays. A typical calibration plot prepared with six standards was log Mw = −0.153 min + 4.19 (R2 = 0.9916). Higher Mw standards established the excluded species size of about 310 kDa. The content of gelatin–hydrazine or blocked gelatin in lyophilized solids after preparation was determined from HPSEC calibration plots of gelatin concentration and chromatogram area.
HPSEC Measurement of Cross-Linking and Degradation
Chromatograms were evaluated for cross-linking as follows. The total area of the sample chromatogram was determined from the instrument software. The peak area of the excluded species and adjacent species within the same peak was determined and expressed as a percent of the total area. The end of the peak area measurement was the minimum preceding the beta chain peak at 12–13 min. This percent value was designated as the percent high molecular weight (%HMW) species. The extent of cross-linking was evaluated by comparing the sample %HMW to the same parameter measured in uncross-linked gelatin controls. Degradation was determined in a similar manner for all peaks representing species smaller than the 100 kDa alpha chain.
Hydrazine Addition and Determination of Hydrazine Content
Gelatin granules at a gelatin concentration of 9.6 or 19.2 mg/mL were hydrated and dissolved as described above in 0.05 M MES at pH 6. Hydrazine (265 or 530 μL) was dissolved in 4 mL of MES and adjusted to pH 6. One milliliter of the hydrazine solution containing 20× molar excess of gelatin carboxyl groups was added to 5 mL of the gelatin solution to produce final gelatin concentrations of 8 and 16 mg/mL and final hydrazine concentrations of 192 or 384 mM. The solution was allowed to stand for 1 h, and reacted with a 1.25× EDC (12 or 24 mM) molar excess of gelatin carboxyl groups at pH 6 for 3 h. The reaction solution was transferred to a 50 mL polypropylene centrifuge tube, and ice-cold absolute ethanol was added up to 47 mL followed by centrifugation at 900g and 15 °C for 15 min. After decanting the alcohol solution, the precipitate was dissolved in 4 mL of water with 200 mg of NaCl and heating at 65 °C for 2 min. To this solution, the addition of ice-cold ethanol, centrifugation, and decanting was repeated. The precipitate was dissolved in 8 mL of water with heating as above followed by lyophilization and storage at −20 °C. Prior to assay for hydrazine content, the mass of gelatin–hydrazine in the precipitate was determined from a gelatin HPSEC calibration plot.
The hydrazine determination procedure was modified from a previous report.13,18 The gelatin hydrazine product was dissolved in 1.365 mL of 0.1 M acetate buffer (pH 5) at accurately prepared concentrations ranging from approximately 0.025 to 0.20 mg/mL. To each solution, 0.135 mL of p-nitrobenzaldehyde (5 mM), dissolved in dimethylformamide, was added to obtain a concentration of 450 mM. These solutions, in microcentrifuge tubes, were placed in a water bath for 3 h at 37 °C. Absorbance was measured at 340 nm, and concentrations of hydrazone bonds formed with p-nitrobenzaldehyde were quantified using an extinction coefficient of 16,800 M−1 cm−1. The extinction coefficient of the hydrazone chromophore was determined after synthesizing it from a reaction between p-nitrobenzaldehyde and acetylhydrazide, filtering the hydrazone precipitate, and recrystallizing it in ethanol. This hydrazone was used to prepare a standard plot at concentrations ranging from 20 to 300 μM in 0.1 M acetate buffer (pH5) using absorbance measurements at 340 nm.19 Incomplete reaction of hydrazide groups (41%) with the reagent was determined from control experiments with acetylhydrazide measuring the extent of hydrazone formation with p-nitrobenzaldehyde after 3 h at 37 °C at various molar ratios of reagent to hydrazide ranging from 5 to 100.
Preparation of Blocked Gelatin and Its EDC Reaction
Gelatin was hydrated, heated, and dissolved in 40 mL of 0.05 M MES pH 7.0 at a concentration of 16 mg/mL. Six milliliters of the gelatin solution was placed into each of six 20 mL glass disposable scintillation vials. A 17× molar excess of citraconic anhydride (50 μL, 93 mM) to gelatin amino groups was added to each solution, and pH 8–9 was maintained for 1 h. Each solution was transferred to a 50 mL polypropylene centrifuge tube, brought to 50 mL with ice cold absolute ethanol and centrifuged at 15 °C and 900g for 15 min. After decanting the alcohol solution, the precipitate was dissolved in 4 mL of water with 200 mg of NaCl and heating at 65 °C for 2 min. To this solution, the addition of ice-cold ethanol, centrifugation, and decanting was repeated. The precipitate was finally dissolved in 4–8 mL of water with heating as above followed by lyophilization and storage at −20 °C.
The concentration of blocked gelatin in the lyophilized powder was determined by HPSEC calibration plots as described above. To a 16.7 mg/mL solution (20 mM gelatin carboxyl groups) of blocked gelatin in 4 mL of 0.05 M MES at pH 7.0, a 2.5× molar excess of EDC (38.4 mg, 33 mM) to gelatin carboxyl groups was added. The reaction was continued for 3 h at 40 °C and room temperature, with samples collected at 30, 60, 90, 120, and 180 min, followed by sample preparation and HPSEC analysis as described above. A control of blocked gelatin without EDC was treated and analyzed as above. After the three h EDC reaction, the degraded blocked gelatin product was collected by alcohol precipitation and lyophilization, and then exposed to a second EDC reaction under the same conditions of pH 7.0 and 40 °C for 3 h. Samples were collected at 0, 60, and 180 min for HPSEC analysis. A control for the second EDC reaction was the first EDC reacted material exposed to the second reaction conditions but without EDC. Another control for the second EDC reaction was blocked gelatin exposed to the conditions of the two reactions without EDC.
Gelatin Degradation Reactions
Gelatin stock solutions in MES were prepared as described above and used at or diluted to 16.7 mg/mL (20 mM gelatin carboxyl groups), 4 mg/mL (4.8 mM gelatin carboxyl groups), and 0.5 mg/mL (0.6 mM gelatin carboxyl groups). Six milliliters of the solution was reacted with a 2.5× EDC (50, 12, and 1.5 mM, respectively) molar excess of gelatin carboxyl groups for 2 min or 1 h (for 0.5 mg/mL) for carboxyl activation at pH 5 followed by adjustment to pH 8.5 for the indicated times of 3 to 6 h. Samples and controls (without EDC) for HPSEC measurement of degradation were collected after the carboxyl activation times and after exposure to the alkaline pH. Samples were prepared and assayed as described above, except for the gelatin samples of 0.5 mg/mL, which were diluted to 0.25 mg/mL to reduce the amount of EDC going onto the column.
Statistics
Values were first evaluated by a one-way ANOVA after which any significant differences were evaluated by Tukey’s test of multiple comparisons. Statistical significance was P < 0.05.
RESULTS
EDC Cross-Linking Reactions with Gelatin
In a previous study, gelatin reactions with EDC were correlated with decreased free amino groups and decreased swelling to confirm covalent cross-linking from the EDC reaction.11 HPSEC chromatography was used in the current study to evaluate EDC-induced cross-linking of gelatin carboxylic acid groups to amino groups. The increased molecular weight of the cross-linked species was followed as changes in peak areas of the chromatograms. All species larger than the exclusion limit (or void volume) elute together at one time. Increases in peak area of the excluded and adjacent species are used to follow the cross-linking. The species within this single peak are designated as high molecular weight (HMW) species.
Chromatograms showing EDC cross-linking of gelatin at pH 5 from 0 to 10 min are shown in Figure 1. Controls without EDC were also examined. Samples were removed from solution at the designated time for HPSEC assay. The original gelatin molecular weight distribution shown in Figure 1a is polydisperse, with species ranging from ∼18 kDa (19 min) to >310 kDa (∼10 min). The α-chain species of 100 kDa (14 min) is most abundant, and the β-chain species of about 180 kDa (12 min) and possibly the γ-chain species (ca. 300 kDa) are also detectable. The highest molecular weight species >310 kDa are combined in the exclusion species peak at 10–11 min. The 23 min peak represents the buffer and azide species in the sample solvent. By the first measurement at 2 min of cross-linking (Figure 1b) the HMW species peak is notably larger than that of the uncross-linked gelatin control indicating a rapid cross-linking reaction. The HMW peak continues to increase at 5 and 10 min (Figure 1c,d). Samples were collected up to 60 min but showed only small changes. The α-chain species decreases during cross-linking as the HMW species increase to indicate α-chain incorporation into the building cross-linked species. The β-chain also participates but to a lesser extent. Low molecular weight species ≤33 kDa (ca. 17 min) do not participate in the cross-linking process.
Figure 1.
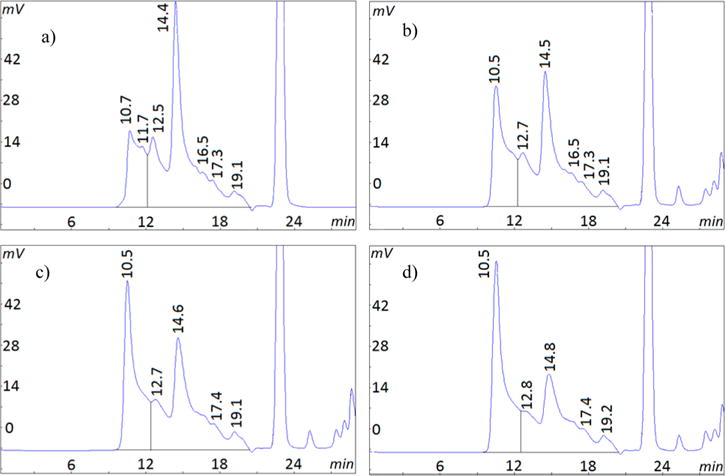
Cross-linking reaction of gelatin with EDC over time shown in HPSEC chromatograms. EDC is 2.5× moles of gelatin carboxyl groups with detection at 214 nm. Key: (a) uncross-linked gelatin control at zero, (b) 2, (c) 5, and (d) 10 min. Peaks at 11 min represent excluded species ≥310 kDa; peaks at 14 min represent the alpha chains of ca. 100 kDa. Vertical line is HMW peak area limit.
Peak areas of the respective species in chromatograms of Figure 1 were expressed as a percent of the total peak area to provide a cross-linking measure as shown in Figure 2. The increasing % HMW species at pH 5 reach a maximum of 50% in Figure 2a compared to the uncross-linked control value of 23% at time zero. A similar experiment at pH 7 also shows the increasing % HMW species with time of EDC reaction. The reactions at both pH appear to reach their maximum values at 20 min. The decline of the α-chain species at both pH 5 and 7 is shown in Figure 2b. The value decreases from a 41% control peak area to a 25% peak area at pH 5 by 60 min of cross-linking. The reduction in areas for the α-chain represents most of the increase in area for the cross-linked species.
Figure 2.
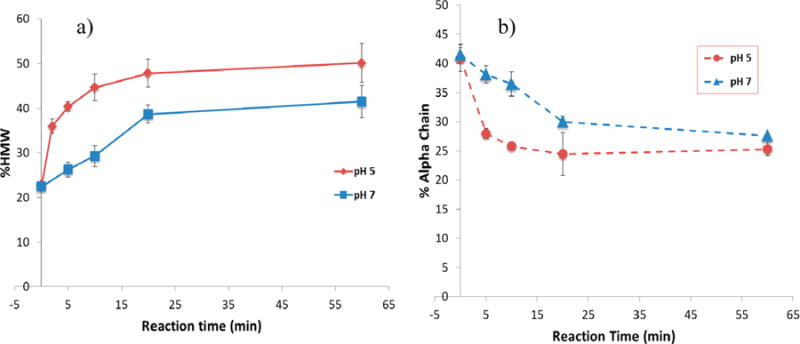
Percent change of gelatin molecular species during EDC cross-linking reaction calculated as percent peak area of total area as shown in Figure 1. Key: pH 5, MES buffer, gelatin 4 mg/mL, from Figure 1; pH 7, bicarbonate buffer, gelatin 16.7 mg/mL. Mean ± SD (n = 3).
On the basis of peak area changes, the dominant component of the cross-linked species appears to be the α-chains but not the much larger HMW chains. This may be due to the larger quantity of alpha chains (40%) compared to HMW species (23%) as shown in Figure 2a. The cross-linking reaction rate can be estimated from the near linear cross-linking change at pH 7 by 20 min (Figure 2a). This value is ∼0.75% per min and is ascribed to reactions primarily between the alpha chains.
Buffers containing amino groups are known to interfere with the EDC reaction but the influence of other buffers is unclear. The effect of buffer and longer times on the EDC cross-linking reaction in gelatin is shown in Figure 3. Cross-linking was measured at pH 5 for 10 min then at 1, 2, and 3 h using four common buffers at the same gelatin concentration. The controls in uncross-linked gelatin for each experiment were combined to produce values at time zero and 3 h of 22 ± 1% and 21 ± 1%, respectively. The 3 h control is used in the figure. While differences were observed at 10 min, the reactions in all buffers examined were complete by 1 h. The reaction in MES was the fastest and most extensive reaching 44% at 10 min and an average 59% at the maximum reaction time. The decreasing order of reaction extent in the buffers was MES = sodium bicarbonate > sodium acetate = sodium phosphate. The lowest reaction (28%) was observed in sodium acetate by 10 min. These results show that MES is the most favorable buffer of the four buffers examined for this EDC reaction. The acetate buffer may interfere with the reaction, perhaps by allowing a competing EDC reaction with acetate carboxyl groups. The phosphate buffer also may interfere with the reaction, but not to the extent as shown in acetate buffer at the examined pH 5.
Figure 3.
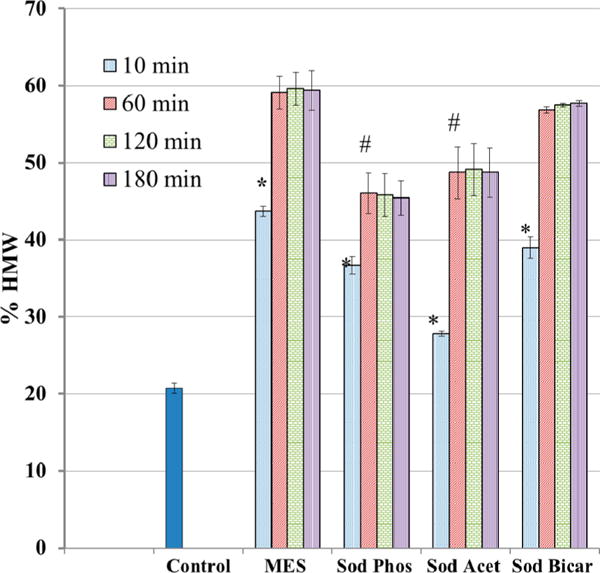
Effect of buffer on EDC cross-linking reaction with gelatin: pH 5, EDC at 2.5× gelatin carboxyl groups, gelatin 10 mg/mL, buffers at 0.1 M, 1 h reaction, % HMW determined as shown in Figure 1. Control is gelatin in buffer without EDC. Mean ± SD (n = 3). *p < 0.05 vs control. #p < 0.05 vs MES 1 h.
The effect of pH on EDC cross-linking reaction extent at different gelatin concentrations is shown in Figure 4. These reactions were conducted with the optimum buffer of MES and for the maximum reaction extent of 1 h as shown in Figure 3. At comparable gelatin concentrations, the order of reaction pH is 5 > 7 > 3, but there is virtually no reaction at pH 3. A concentration effect is observed at pH 5 and 7 in which the reaction extent increases with gelatin concentration producing the highest reactivity observed (59%) at pH 5 for 10 mg/mL of gelatin. Higher concentrations at this pH produced gelation and could not be used. The reactions at pH 7 reach a plateau maximum (40%) for gelatin concentrations ≥8 mg/mL (p = 0.051). This maximum occurs regardless of the increase in EDC used at higher gelatin concentrations to maintain a constant EDC: gelatin carboxyl group molar ratio (2.5:1). It is noteworthy that at 4 mg/mL of gelatin no EDC reaction occurs at pH 7 and 3, while a near complete reaction occurs at pH 5. At the low end of reactivity for pH 5, the % HMW values are equivalent to controls at 0.5 and 1 mg/mL, but the reaction is clearly present at 2 mg/mL. Controls without EDC for each pH were indistinguishable (mean = 22 ± 1% SD); only one set is shown for clarity. These pH results are consistent with the generally recognized pH 4–6 range for effective EDC-induced amide bond formation in proteins and peptides.5 A similar optimum of pH 5 was reported for EDC-induced amide bonds between carboxyl groups of polyacrylic acid and ethylenediamine.6 It is ascribed to the optimum balance between the carboxyl groups reacting in their ionized state with the amino groups reacting in their unionized state as well as a sufficient hydrogen ion concentration to protonate EDC.
Figure 4.
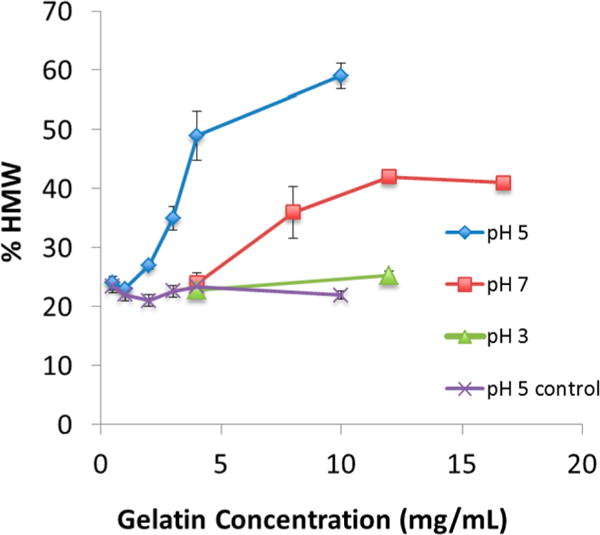
pH and gelatin concentration effect on EDC cross-linking reaction. Reactions in 0.05 M MES for 1 h. EDC at 2.5× gelatin carboxyl groups; % HMW determined as shown in Figure 1. Control is gelatin in buffer without EDC. Mean ± SD (n = 3).
EDC-Induced Ligand Addition Reaction with Gelatin
The carbodiimide EDC is frequently used for ligand addition to proteins by forming an amide bond between the two species. This ligand addition is commonly described as a two-step reaction in which the first step is EDC activation of protein carboxyl groups to form an O-acylisourea active intermediate.5 The second step is the activated species reacting with a nucleophilic ligand such as a primary amino group. The ligand is often a peptide but could also be other molecules with an amino group.
EDC-induced hydrazine addition to gelatin was quantitatively determined to evaluate participation of the anhydride mechanism as proposed by Nakajima and Ikada.6 Hydrazine addition is shown in Figure 5a for two gelatin concentrations. To facilitate the reaction and to hinder cross-linking, hydrazine was present at 20× the molar amount of gelatin carboxyl groups (corresponding to 80× the competing gelatin amino groups) and was allowed to mix with gelatin for 1 h prior to EDC addition. Nevertheless, a small amount of cross-linking of 29 ± 0.5 and 32 ± 1.4% HMW was observed (see Figure 5b). EDC was present at 1.25× the molar amount of gelatin carboxyl groups for a 3 h reaction. The reaction was conducted at pH 6 after experiments at pH 5 showed less yield. The greater hydrazine addition at pH 6 is ascribed to the pKa1 of 7.94 for the reactive amino group in hydrazine producing more amino groups in the favored unionized state. At 8 mg/mL of gelatin, 89 ± 5.3 hydrazine moles are bound per mole of gelatin. At 16 mg/mL of gelatin the value for hydrazine addition increases to 181 ± 39. These values correspond to 47% and 96%, respectively, of the theoretical number of gelatin carboxyl groups. The higher gelatin concentration is reacted with a corresponding higher EDC and hydrazine concentration to maintain the same reaction stoichiometry. A reaction based on the two step mechanism described above would be expected to yield the same hydrazine addition per mole of gelatin at the two different gelatin concentrations. However, substantially greater addition occurs at the higher gelatin and concurrent higher gelatin carboxyl group concentration, which indicates these groups have a synergistic role in the reaction. This role is ascribed to anhydride formation from the carboxylate reacting with a nearby O-acylisourea (i.e., actived carboxyl group) and subsequent reaction with an amino group as described by Nakajima and Ikada.6
Figure 5.
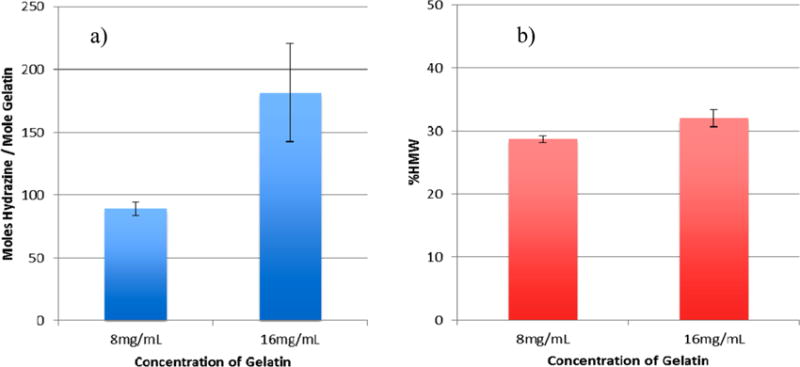
EDC-induced hydrazine addition is enhanced at higher gelatin concentration. (a) Moles of hydrazine per mole of gelatin. (b) Cross-linking during the hydrazine addition reaction. Hydrazine at 20× and EDC at 1.25×, gelatin carboxyl groups, reaction at pH 6 for 3 h. Mean ± SD (n = 3).
EDC-Induced Degradation of Gelatin
In a previous investigation, we observed substantial gelatin degradation after reactions with EDC and sample preparation, which raised the possibility of this reagent participating in the degradation process.13 The role of degradation was first examined in the current investigation as shown in Figure 6. A 2 min EDC reaction with gelatin carboxyl groups at the reaction optimum of pH 5 (Figure 6a) was followed by 3 h at the alkaline pH of 8.5 (Figure 6b). The HMW species from extensive cross-linking at pH 5 for 2 min (54% HMW) did not increase during 3 h at pH 8.5 indicating the absence of further cross-linking. However, the near absence of the α-chain peak (15 min retention time) and increase in the low molecular weight 19 min species (∼19 kDa) indicates degradation during the alkaline exposure. At a lower gelatin concentration of 4 mg/mL, a similar sequence of brief EDC reaction at pH 5, followed by quenched cross-linking and induced degradation at the alkaline pH is seen in Figure 6c,d. At this concentration, degradation is shown by decreases in the HMW species (32% to 23%) and α-chain (31% to 28%) as well as increases in low molecular weight species at 16 and 19 min. Degradation is again observed at the lowest gelatin concentration of 0.5 mg/mL in Figure 6e,f shown by decreases in the HMW peak (23% to 18%) and in the α-chain (40% to 34%). However, longer acid and alkaline exposures are required to produce these changes. The controls for all three concentrations at each of the above times showed no degradation. These results demonstrate that EDC can induce small but measurable amounts of gelatin degradation under certain conditions. The process shown here involves an interrupted EDC cross-linking reaction followed by a degradation reaction in the presence of excess EDC at alkaline pH.
Figure 6.
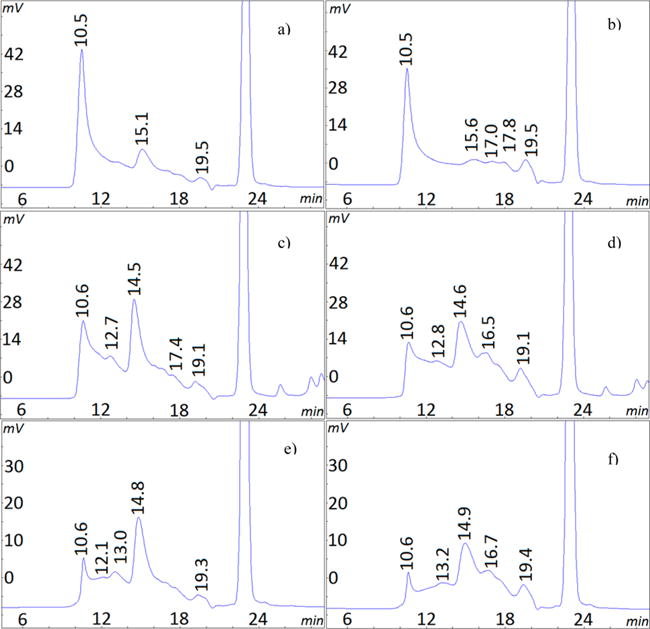
HPSEC chromatograms showing EDC degradation of gelatin. EDC first reacted at pH 5 in MES, then continued at pH 8.5 for the indicated times and gelatin concentrations. Key: (a) 16.7 mg/mL, 2 min at pH 5; (b) 16.7 mg/mL, 2 min at pH 5, then 3 h at pH 8.5; (c) 4 mg/mL, 2 min at pH 5; (d) 4 mg/mL, 2 min at pH 5, then 4 h at pH 8.5; (e) 0.5 mg/mL, 1 h at pH 5; (f) 0.5 mg/mL, 1 h at pH 5, then 6 h at pH 8.5.
A second degradation experiment was conducted to directly examine the EDC degradation reaction in the absence of a competing cross-linking reaction. Gelatin amino groups were blocked with citraconic anhydride to prevent their cross-linking reaction with carboxyl groups. The chromatogram of the blocked gelatin control shown in Figure 7a is identical to unreacted gelatin (see Figure 1a). The HPSEC chromatogram for a 3 h EDC reaction with blocked gelatin at pH 7.0 and 40 °C is shown in Figure 7b. The chromatogram shows a decrease in the alpha chain as well as increases in the peaks for smaller species at 16 and 19 min indicating notable degradation. This degradation is occurring at neutral pH, elevated temperature, and an absence of amino groups. The EDC reaction with blocked gelatin was also conducted at room temperature which also produced degradation but to a lesser extent (see below). After the 3 h EDC reaction, the degraded blocked gelatin product was collected by alcohol precipitation and lyophilization, and then exposed to a second EDC reaction under the same conditions of pH 7.0 and 40 °C for 3 h. The chromatogram of this twice EDC reacted blocked gelatin in Figure 7c indicates substantial degradation as shown by the species at 18, 19, and 20 min representing molecular weights of 27, 19, and 14 kDa, respectively. These results confirm that EDC can induce breakdown of the gelatin polypeptide chain into smaller molecular species.
Figure 7.
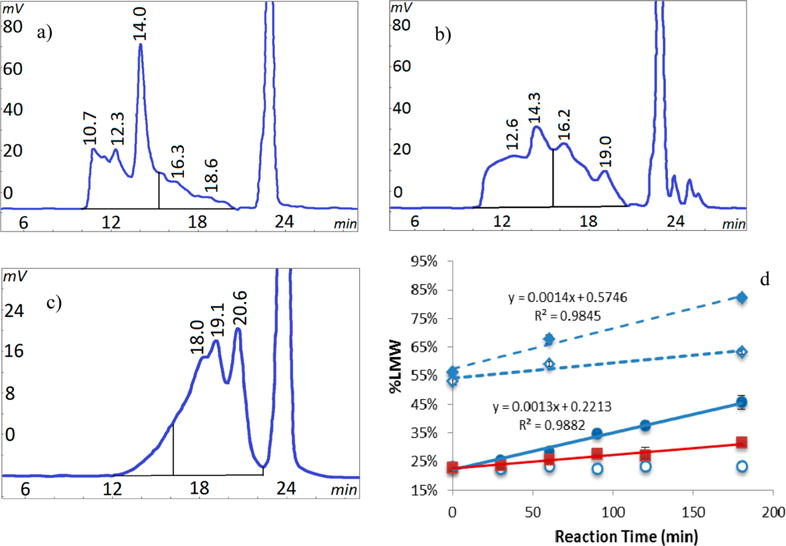
EDC degradation of gelatin with blocked amino groups. (a) SEC chromatogram of control blocked gelatin after 180 min at 40 °C without EDC. (b) SEC chromatogram of blocked gelatin after 180 min EDC reaction at 40 °C. (c) SEC chromatogram of blocked gelatin after a second 180 min EDC reaction (total of 360 min) at 40 °C. (d) Degradation represented as percent change of peak areas for species <100 kDa (% LMW) over time to produce (a) (○), to produce (b) (●), to produce (c) (⧫), room temperature 180 min EDC reaction (■), second 180 min without EDC following first 180 min with EDC at 40 °C (◊). Vertical line is boundary of LMW peak area. Mean ± SD (n = 3).
The above degradation process was followed during the 3 h reaction in Figure 7d. Degradation is shown as an increasing percent of the low molecular weight species smaller than the 100 kDa α-chain (% LMW) calculated in a manner similar to that for % HMW. The increase in % LMW for the first EDC reaction can be distinguished from the blocked gelatin control as early as 60 min at room temperature (25.7% ± 0.9% vs 23.0% ± 0.2%) and 40 °C (28.6% ± 0.8% vs 23.5% ± 0.5%). The control values shown in the graph represent the 40 °C experiment; the virtually identical room temperature control values are not shown. The degradation increases with time and appears linear for both temperatures reaching 32% and 46% LMW by 3 h for room temperature and 40 °C, respectively. Values for the second EDC reaction at times 0, 60, and 180 min were substantially higher at 56%, 68%, and 82% LMW, respectively. Degradation producing the largest % LMW value is shown by the substantial shifts in the chromatogram peaks in Figure 7c.
A control for the second EDC reaction was the first EDC reacted material exposed to the second reaction conditions but without EDC. The 53.2% ± 1.1% LMW value for this material at time 0 in Figure 7d represents degradation of 45.7% ± 2.5% after the first 3 h EDC reaction as well as a small amount of degradation (∼7%) during the alcohol precipitation and lyophilization separation steps. This once EDC reacted control continues to degrade up to a value of 63.3% ± 0.8% without EDC present by 3 h at pH 7 and 40 °C. A blocked gelatin control without any EDC treatments but exposed to the same separation steps showed no degradation. This result indicates that an EDC adduct was retained on gelatin after the first EDC reaction and separation steps to then induce degradation in an amino group deficient environment upon exposure to neutral pH and elevated temperature. The indicated EDC adduct formation is consistent with a previous report of formation and characterization of EDC adducts on a dipeptide and four proteins, but no degradation was noted.7
DISCUSSION
Size exclusion chromatography has been used to identify and characterize macromolecules such as polymers,20 proteins,21 and gelatin.13,17 One potential drawback of using this method with polydisperse random coil macromolecules like gelatin is the difficulty of separating entangled molecules, which results in unresolved areas between peaks of different species.22 Nevertheless, the use of HPSEC chromatograms to follow cross-linking in gelatin is attractive because of (a) the ability to follow changes in sizes of the molecular species and (b) the collection of large cross-linked species above the exclusion limit within one peak. Other cross-linking measurements have been based on specific functional groups, such as loss of amino groups11,23 and consequently are dependent on a specific mechanism. The current method is based on increases in molecular weight from intermolecular reactions and is independent of a mechanism with specific functional groups.
EDC Reaction Mechanisms
Both, EDC cross-linking and hydrazine addition reactions above produce an amide bond between carboxyl and amino groups and provide additional information on these EDC mechanisms. Nakajima and Ikada investigated EDC reactions with carboxyl groups of polyacrylic acid. They concluded that the carboxylic anhydride mechanism recognized to occur for amide formation in organic solvents occurs quite extensively under aqueous conditions.6 The synergistic role of carboxyl groups in hydrazine addition for the current investigation indicates the anhydride mechanism is occurring and corroborates the proposed anhydride mechanism for amide bond formation. This corroboration is important because the mechanism has received little attention since it was reported in 1995.
The EDC anhydride mechanism as well as the two-step addition mechanism are shown in Figure 8. The first step is protonation of the EDC molecule to form a carbocation and attack by ionized carboxyl groups to form the O-acylisourea intermediate. This activated carboxyl group can then proceed with four different reactions depending on concentrations of reactants and pH. The first (1) possible reaction is with water in the absence of a nucleophile, which regenerates the carboxyl group and produces a urea product. The second (2) possible reaction is a slower and less extensive reaction with an amino group, which produces an amide bond and a urea product (the two-step reaction). The third (3) possible reaction is with a nearby ionized carboxyl group to form an anhydride followed by an extensive reaction with an amino group to form an amide bond and a urea byproduct (steps 3 and 5 of Figure 8). Such amide bonds form easily at pH 5–7. The carboxyl groups regenerated after forming an amide bond can react with excess EDC to reform the O-acylisourea and continue forming amide bonds with amino groups by either the anhydride pathway (3) or the slower two-step pathway (2) when carboxyl groups are insufficiently close, or participate in the fourth (4) possible reaction. The fourth reaction of the O-acylisourea is an O → N rearrangement to form an N-acylisourea. This rearrangement is reported to occur in excess carbodiimide7,24,25 and is supported by experimental evidence of its formation and stability in neutral and mildly acidic conditions.6,7 It is unclear, however, if the rearrangement results from a direct EDC reaction with the O-acylisourea6 or from an intramolecular rearrangement.4 The role of this reaction in degradation is discussed below.
Figure 8.
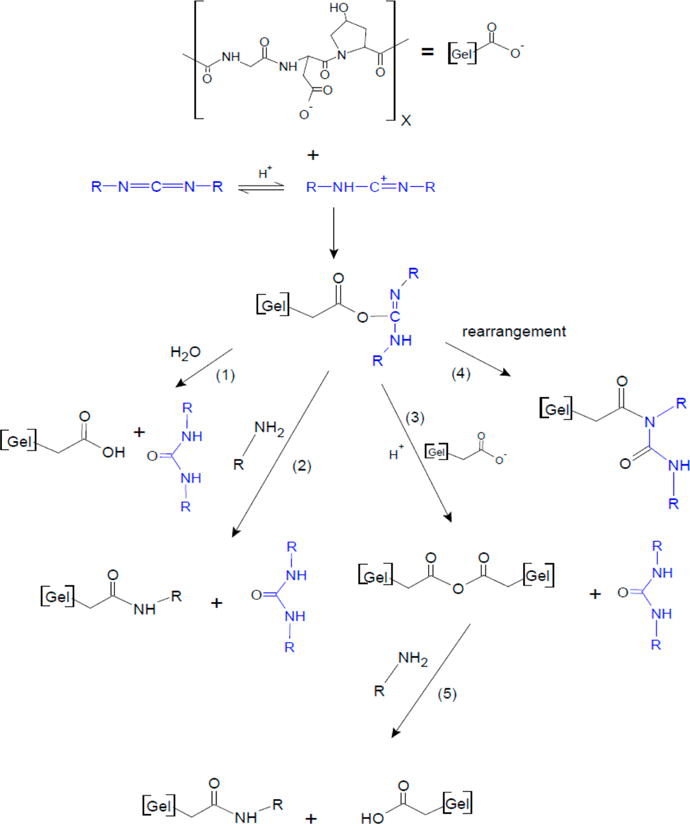
EDC reactions with gelatin after formation of the O-acylisourea intermediate. (1) reaction with water, (2) slow reaction with amino groups, (3) reaction with a nearby carboxyl group, (4) formation of N-acylisourea, and (5) fast reaction of anhydride with amino group (after Nakajima and Ikada6).
Proposed EDC Degradation Mechanism
The above results demonstrate that EDC-induced gelatin degradation occurs under certain conditions. The degradation rate can be estimated using the above data. The change for degradation at room temperature at pH 7 by 3 h (Figure 7d) is ∼0.05%. This can be compared to the estimated rate of cross-linking noted above (Figure 2a) of ∼0.75% per min. The degradation rate is approximately an order of magnitude less than the rate of amide bond formation in cross-linking.
The degradation conditions can be clarified based on the EDC reaction mechanisms in Figure 8. The EDC cross-linking at pH 5 in Figure 6 is ascribed to the O-acylisourea forming the anhydride species and reacting with an amino group to form an amide bond cross-link. At the change to pH 8.5 the cross-linking reaction stops, and in the presence of excess EDC the O-acylisourea rearranges to the N-acylisourea.7,24,25 In the absence of amino groups in Figure 7, the O-acylisourea with excess EDC also rearranges to the N-acylisourea.
An early report of the carbodiimide reaction describes a role of the N-acylisourea species in selective cleavage of an amino acid from the carboxyl end of a dipeptide under alkaline conditions.26 We propose a modification of this reaction that differs for gelatin by an EDC reaction with the multiple carboxyl bearing amino acids within the gelatin chain. It is designated the extended Khorana reaction. Each step of the Khorana mechanism is shown in Figure 9a as originally described with a glycylglycine benzyl derivative.26 The corresponding proposed steps for gelatin peptide bond cleavage along the backbone of the molecular chain are shown for comparison in Figure 9b. The carbodiimide or EDC molecule first reacts with a carboxyl group to form the O-acylisourea activated species. The O-acylisourea rearranges into the N-acylisourea species as noted in Figure 8 but shown with more detail in Figure 9. The next step is nucleophilic addition of the peptide nitrogen to the N-acylisourea to form an intermediate 5- or 6-membered ring for the dipeptide or gelatin, respectively, as shown in Figure 9a,b. In the presence of hydroxyl ion at neutral or alkaline pH the peptide bond adjacent to the ring is cleaved while the ring breaks and splits the EDC adduct. The result is one peptide chain that ends in a carboxyl group and another chain ending with the split EDC adduct. Khorana identified N-acylisourea carbodiimide adducts in the products of the reaction under alkaline and hydro-alcoholic conditions as a basis for this mechanism.26 Gelatin degradation occurs at less alkaline conditions used in the earlier studies. A gelatin molecule in solution has a flexible, open and random coil conformation that is likely to allow close proximity of the N-acylisourea imino group to the peptide nitrogen at virtually all intrachain amino acid residues that contain carboxyl groups. This accessibility could facilitate the reaction at intrachain sites for gelatin degradation.
Figure 9.
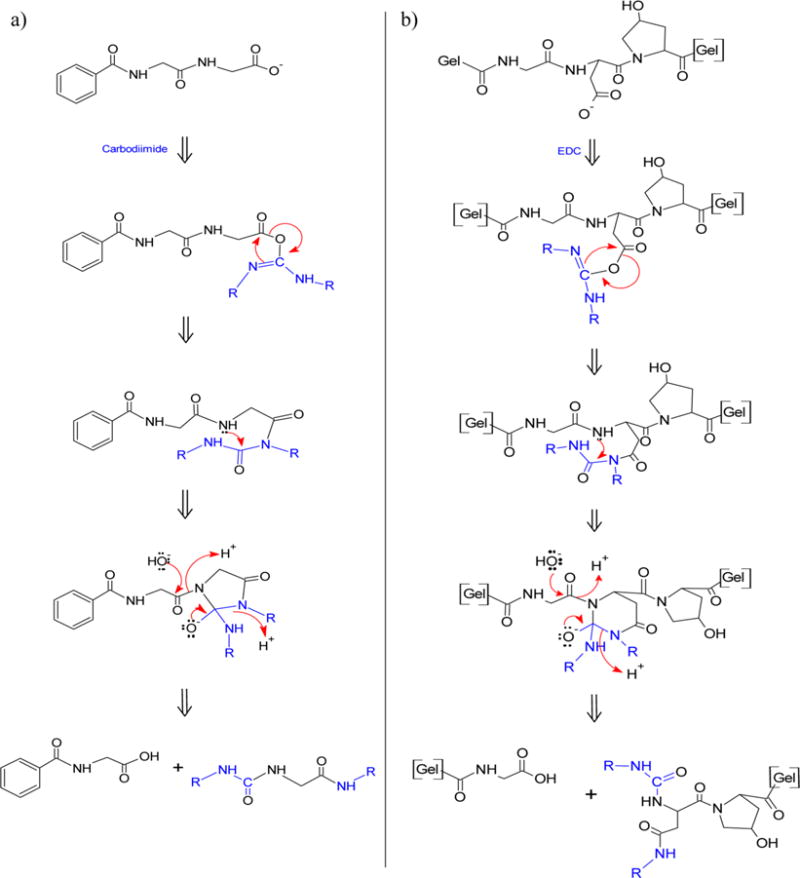
Proposed mechanism of EDC-induced degradation of gelatin as an extended Khorana mechanism. (a) Khorana mechanism26 for peptide bond cleavage of terminal amino acid. (b) Extended Khorana mechanism for peptide bond cleavage of an intrachain amino acid in gelatin.
On the basis of the above results and supporting literature, gelatin degradation first requires excess EDC and formation of the N-acylisourea adduct. At a neutral or alkaline pH, hydroxyl ions and the adduct initiate peptide bond cleavage. In the absence of amino groups and its favored EDC reaction, degradation can occur without competition and to a substantial extent. Once the adduct is formed it could induce a small amount of degradation without additional EDC (see Figure 7d). It is also interesting to note that linearity of the degradation reaction in Figure 7 suggests the reaction is a zero order process, which is supported by regeneration of the carboxyl reacting species as described in the mechanism (see Figure 9b). These degradation conditions could occur with EDC reactions at neutral or alkaline pH in which the amino group containing ligand is consumed with excess EDC. Degradation could also occur when the EDC reaction is followed with dilution, dialysis, or size exclusion chromatography using neutral or mildly alkaline buffers. It is conceivable that EDC-induced degradation could occur with proteins under these conditions, and more so if these conditions include denaturation such as in electrophoresis. In addition, peptides and proteins with large numbers of aspartic and glutamic acid amino acids could be subject to greater degradation based on EDC reactions of their residue carboxylic acids. However, little or no degradation was observed under common EDC reaction conditions described in the literature and examined in this investigation. For example, EDC reactions at pH 5 up to 3 h shown in Figure 3 produced no degradation.
CONCLUSIONS
Several reactions between the frequently used protein reagent, EDC, and gelatin were evaluated in this investigation. Chromatograms from SEC can be used to calculate a parameter to follow EDC reactions with gelatin that increase or decrease its molecular weight. Using EDC-induced gelatin cross-linking as a model for amide bond formation, some reaction ambiguities from the effects of buffers, gelatin concentration, and pH were clarified. Four nonamino group buffers produced moderate differences in the rate and extent of the reaction. The pH of greatest reaction extent (pH 5 > 7 > 3) is consistent with the generally recognized pH 4–6 range for effective EDC reactions in proteins and peptides.5 Different combinations of gelatin concentration and reaction pH can produce widely different results. For example, at 4 mg/mL of gelatin no EDC reaction occurs at pH 7 and 3, while a near complete reaction occurs at pH 5.
Another goal of this investigation was to examine the previously proposed anhydride mechanism for EDC-induced amide bond formation under aqueous conditions.6 The results corroborate this mechanism in which a gelatin carboxyl group reacts with an EDC-activated carboxyl group, O-acylisourea, to form an anhydride, which then reacts with an amino group containing ligand. This mechanism is in contrast to the more generally accepted mechanism of the O-acylisourea species reacting directly with the amino group.
EDC-induced degradation of gelatin was also investigated and found to occur under certain conditions. Substantial degradation occurred in the presence of excess EDC when reacting amino groups were not available at neutral pH 7.0 and elevated temperature. Moderate degradation, also with excess EDC, occurred in the presence of amino groups at an alkaline pH 8.5 in which no cross-linking amide bonds were formed. The rate of degradation at room temperature is an order of magnitude less than amide bond formation during cross-linking. The proposed mechanism of EDC-induced degradation of gelatin is a modification of a previously reported mechanism of EDC-induced cleavage of a terminal amino acid in a dipeptide.26 This EDC side reaction has the potential to have a significant impact in peptide and protein macromolecules under similar conditions. Little or no degradation was observed at pH 5 to 7, room temperature, with available reacting amino groups, and an excess of EDC.
Acknowledgments
The authors thank Phenomenex for support with size exclusion columns. The authors also gratefully acknowledge technical assistance from Rahul Samuldrawar, Hyun (Kate) Kim, and Mit Patel. The authors also thank Darren Wu for preliminary experiments showing EDC degradation of gelatin. Financial support was received for this investigation from NIH R15CA135421.
Footnotes
Notes
The authors declare no competing financial interest.
References
- 1.Khorana HG. The chemistry of carbodiimides. Chem Rev. 1953;53:145–166. [Google Scholar]
- 2.Kurzer F, Douraghi-Zadeh K. Advances in the chemistry of carbodiimides. Chem Rev. 1967;67(2):107–152. doi: 10.1021/cr60246a001. [DOI] [PubMed] [Google Scholar]
- 3.Williams AAI, Ibrahim T. Carbodiimide chemistry: recent advances. Chem Rev. 1981;81:589–636. [Google Scholar]
- 4.Podlech J. Carbodiimides. In: Goodman M, Toniolo C, Moroder L, Felix A, editors. Houben-Weyl Methods in Organic Chemistry. E22. Thieme; New York: 2004. pp. 517–533. [Google Scholar]
- 5.Hermanson GT. Bioconjugate Techniques. 2nd. Academic Press; San Diego, CA: p. 2008. [Google Scholar]
- 6.Nakajima N, Ikada Y. Mechanism of amide formation by carbodiimide for bioconjugation in aqueous media. Bioconjugate Chem. 1995;6(1):123–30. doi: 10.1021/bc00031a015. [DOI] [PubMed] [Google Scholar]
- 7.Lopez-Alonso JP, Diez-Garcia F, Font J, Ribo M, Vilanova M, Scholtz JM, Gonzalez C, Vottariello F, Gotte G, Libonati M, Laurents DV. Carbodiimide EDC induces cross-links that stabilize RNase A C-dimer against dissociation: EDC adducts can affect protein net charge, conformation, and activity. Bioconjugate Chem. 2009;20(8):1459–73. doi: 10.1021/bc9001486. [DOI] [PubMed] [Google Scholar]
- 8.Digenis GA, Gold TB, Shah VP. Cross-linking of gelatin capsules and its relevance to their in vitro-in vivo performance. J Pharm Sci. 1994;83(7):915–21. doi: 10.1002/jps.2600830702. [DOI] [PubMed] [Google Scholar]
- 9.Narayani R, Rao KP. Controlled release of anticancer drug methotrexate from biodegradable gelatin microspheres. J Micro-encapsulation. 1994;11(1):69–77. doi: 10.3109/02652049409040439. [DOI] [PubMed] [Google Scholar]
- 10.Kuijpers AJ, Engbers GHM, Feijen J, De Smedt SC, Meyvis TKL, Demeester J, Krijgsveld J, Zaat SA, Dankert J. Characterization of the Nethwork Structure of Carbodiimide Cross-linked Gelatin Gels. Macromolecules. 1999;32(10):3325–3333. [Google Scholar]
- 11.Ofner CM, III, Bubnis WA. Chemical and swelling evaluations of amino group crosslinking in gelatin and modified gelatin matrices. Pharm Res. 1996;13(12):1821–7. doi: 10.1023/a:1016029023910. [DOI] [PubMed] [Google Scholar]
- 12.Bowman BJ, Ofner CM., III Characterization and in vitro methotrexate release from methotrexate/gelatin conjugates of opposite conjugate bond polarity. Pharm Res. 2000;17(10):1309–15. doi: 10.1023/a:1026460023503. [DOI] [PubMed] [Google Scholar]
- 13.Wu DC, Cammarata CR, Park HJ, Rhodes BT, Ofner CM., III Preparation, drug release, and cell growth inhibition of a gelatin: doxorubicin conjugate. Pharm Res. 2013;30(8):2087–96. doi: 10.1007/s11095-013-1065-9. [DOI] [PMC free article] [PubMed] [Google Scholar]
- 14.Chen CS, Ofner CM., III The effect of molecular weight, drug load, and charge of gelatin-MTX conjugates on growth inhibition of HL-60 leukemia cells. Pharm Res. 2009;26(2):338–45. doi: 10.1007/s11095-008-9746-5. [DOI] [PubMed] [Google Scholar]
- 15.Veis A. The Macromolecular Chemistry of Gelatin. Academic Press; New York: p. 1964. [Google Scholar]
- 16.Bubnis WA, Ofner CM., III The determination of epsilon-amino groups in soluble and poorly soluble proteinaceous materials by a spectrophotometric method using trinitrobenzenesulfonic acid. Anal Biochem. 1992;207(1):129–33. doi: 10.1016/0003-2697(92)90513-7. [DOI] [PubMed] [Google Scholar]
- 17.Dupont AL. Study of the degradation of gelatin in paper upon aging using aqueous size-exclusion chromatography. J Chromatogr A. 2002;950(1–2):113–24. doi: 10.1016/s0021-9673(02)00010-9. [DOI] [PubMed] [Google Scholar]
- 18.King TP, Zhao SW, Lam T. Preparation of protein conjugates via intermolecular hydrazone linkage. Biochemistry. 1986;25(19):5774–9. doi: 10.1021/bi00367a064. [DOI] [PubMed] [Google Scholar]
- 19.Cammarata CR, Wu DC, Ofner CM., III . AAPS Annual Meeting and Exposition. Vol. 13 American Association of Pharmaceutical Scientists; Washington, D.C.: 2011. Developing a Spectrophotometric Assay for Hydrazide Group Determination as an Evaluation of a Gelatin Conjugate Precursor. [Google Scholar]
- 20.Balke ST, Mourey TH. Local polydispersity detection in size exclusion chromatography: method assessment. J Appl Polym Sci. 2001;81(2):370–383. [Google Scholar]
- 21.Shimomura H, Spiro RG. Studies on macromolecular components of human glomerular basement membrane and alterations in diabetes. Decreased levels of heparan sulfate proteoglycan and laminin. Diabetes. 1987;36(3):374–81. doi: 10.2337/diab.36.3.374. [DOI] [PubMed] [Google Scholar]
- 22.Carpenter JF, Randolph TW, Jiskoot W, Crommelin DJ, Middaugh CR, Winter G. Potential inaccurate quantitation and sizing of protein aggregates by size exclusion chromatography: essential need to use orthogonal methods to assure the quality of therapeutic protein products. J Pharm Sci. 2010;99(5):2200–8. doi: 10.1002/jps.21989. [DOI] [PubMed] [Google Scholar]
- 23.Ma DH, Lai JY, Cheng HY, Tsai CC, Yeh LK. Carbodiimide cross-linked amniotic membranes for cultivation of limbal epithelial cells. Biomaterials. 2010;31(25):6647–58. doi: 10.1016/j.biomaterials.2010.05.034. [DOI] [PubMed] [Google Scholar]
- 24.Swaisgood H, Natake M. Effect of carboxyl group modification of some of the enzymatic properties of 1-glutamate dehydrogenase. J Biochem. 1973;74:77–86. doi: 10.1093/oxfordjournals.jbchem.a130233. [DOI] [PubMed] [Google Scholar]
- 25.Timkovick R. Detection of the stable addition of carbodiimide to proteins. Anal Biochem. 1977;156:135–143. doi: 10.1016/0003-2697(77)90387-6. [DOI] [PubMed] [Google Scholar]
- 26.Khorana HG. Peptides. Part III. Selective Degradation from the Carboxyl End. The Use of Carbodiimides. J Chem Soc. 1952:2081–2088. [Google Scholar]


