Abstract
We demonstrate that nano-hydrophobicity, which governs the biological aggressiveness of nanoparticles, is determined by the outermost regions of surface ligands. We have also successfully modulated nano-hydrophobicity using systematic surface ligand modifications and built the first computational model of nano-hydrophobicity.
Keywords: Gold, Nanoparticle, Transmission electron microscopy (TEM), Hydrophilicity/hydrophobicity, Macrophages, Cytotoxicity
1. Introduction
Because of their large surface energy, nanoparticles strongly adsorb surrounding molecules. The resulting nanoclusters interact with biological molecules [1–3] and cells [3–5] perturbing physiological systems [6]. However, properly crafted nanoparticles might be used for medical purposes such as biological sensors [7–9], drug delivery carriers [10–12] and tissue engineering materials [13,14]. Nano-bio interactions are primarily determined by the combined properties of nanoclusters [5,15–17], of which one key property is the hydrophobicity of nanoclusters or nano-hydrophobicity [18–20]. Nano-hydrophobicity can be tentatively defined as the combined properties on nanoparticles to enable them to distribute in organic phase relative to their distribution in water phase. Generally, foreign hydrophobic agents are harmful to biological systems and are consistently avoided, which is exemplified in the phenomena of cell membranes and protein folding. However, many key therapeutic interventions, such as drug delivery, require a certain degree of hydrophobicity [21,22]. Therefore, a clear understanding of the factors determining nano-hydrophobicity and efficient approaches for the prediction and modulation of nano-hydrophobicity are crucial for the development of safe biomaterials and nanomedicinal applications.
Many factors affect nano-hydrophobicity [18,23]. Among them, surface properties are likely a dominant factor because nanoparticles uniquely have a very large surface area. The synthesis of surface ligand-modified nanoparticle libraries is a powerful tool to modulate nanoparticle properties [24–28]. To reveal the correlation between surface ligands and nano-hydrophobicity for the eventual prediction and regulation of nano-hydrophobicity, novel approaches combining both experimental and computational methods are needed. To accomplish this goal, the current investigation was carried out and reported below.
2. Materials and methods
2.1. Synthesis of f-GNPs for library 1
f-GNPs for library 1 were prepared as we previously reported [25].
2.2. Transmission electron microscope (TEM) observation of f-GNPs
GNP-13, GNP-22, GNP-26 and GNP-42 were suspended in water with sonication. TEM images of the GNPs were taken using a JEM-1011 (Japan) transmission electron microscope. TEM images of f-GNPs in library 2 were done by the same procedure.
2.3. Dynamic light scattering (DLS) measurements of f-GNPs
f-GNPs were suspended in water with sonication. Dynamic diameter of GNPs was measured at 25 °C on a Malvern zetasizer instrument (UK). All samples were performed under the same concentration and bubbles were forbidden during the measurements. Each sample was measured three times.
2.4. Zeta potential measurements of f-GNPs
f-GNPs were suspended in water with sonication. Zeta potentials of GNPs were measured at 25 °C on a Malvern zetasizer instrument (UK) under neutral conditions. All samples were performed under the same concentration and bubbles were forbidden during the measurements. Each sample was measured three times.
2.5. Modified “shaking flask” method for LogP determination
The widely used “shaking flask” method was employed in the measurement of LogP values for f-GNPs. To obtain octanol-saturated water and water-saturated octanol, octanol and water were premixed and stirred for 24 h. Then two phases were separated after reaching equilibrium. About 0.1 mg GNP (suspended in 100 µL water), 1.90 mL octanol-saturated water and 2.00 mL water-saturated octanol were added to the 4 mL polypropylene tubes and the mixture was shaken on an orbital shaker for 24 h at room temperature. The mixture was allowed to stand still for 3 h, followed by the separation of GNP from two phases. GNP in octanol and water was then quantified by ICP-MS measurements respectively. The LogP values can be obtained as:
2.6. ICP-MS measurement
ICP-MS measurements were conducted on Agilent 7500 (USA). A series of gold standard solutions (20, 10, 5, 2, 1, 0.5 and 0 ppb) were prepared to obtain a standard curve for quantification. A 300 µL of f-GNP in octanol or water were added to a 10-mL colorimetric tube, dried and digested overnight in 400 µL Aqua Regia. After diluting to 5mL, the concentration of f-GNPs was diluted and determined by ICP-MS.
2.7. Nano-group contribution approach (Nano-GCA)
We designed a Nano-ligand Group Contribution Approach (Nano-GCA) to calculate the LogP values of the GNPs in this study. The size of water molecule is about 0.3 nm, so when an atom (or functional group) of one ligand has a distance less than 0.3 nm to the closest ligand, it cannot be reached by water molecule and has no contribution to the final calculation. Therefore, we proposed a new parameter to be used in the Nano-GCA as follows (Equation (1)):
| (1) |
Among them, LogP is the calculated LogP value; C0 is a constant; Gi is the occurrences of ith atom/group in a GNP ligand; C(~) i is the corrected contribution of ith atom/group in a GNP ligand; Ci is the constant contribution of ith atom/group for normal organic ligands, and Pi is a penalty factor due to the steric hindrance effect of GNP ligands as mentioned above. The Ci values were obtained from our in house LogP calculator and were listed in Tables S2 and S5. As the results, we used the following method to calculate the Penalty factor (Pi) (Equation (2)):
| (2) |
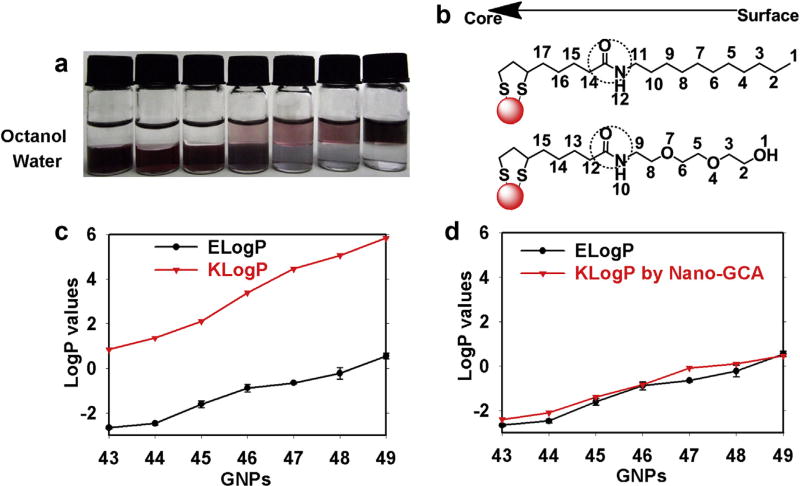
Among them, the Ni is the label for each atom or functional groups as shown in Fig. 5b. The K is a constant which represents the distance moved from surface to the GNP core by each bond. In this study, the value was set to 0.1, which is similar to the approximate movement by a single carbon–carbon bond (0.15 nm). The value 0.3 was used as the threshold because it is the average size of water molecules. This equation was used to calculate the LogP values of the 42 GNPs.
Fig. 5.
(a) Partition of f-GNPs in octanol–water phases; (b) Nano-GCA scheme for modeling the contributions of the atoms and groups (also see Table S5). (c) Comparison of f-GNP's ELogP to KLogP values calculated by traditional GCA method using the entire ligand and the ligand density. (d) Comparison of the f-GNP's ELogP values to the KLogP values calculated using the Nano-GCA method. Error bars: standard deviation of values from three independent measurements.
It is clear that the density of the ligand is critical to determine the steric hindrance effect. For this reason, we designed another smaller GNP set (GNP library 2), in which the GNPs have different ligand density. Based on the Equation (2), we proposed to add the ligand density as an extra parameter of GNP LogP calculations as following (Equation (3)):
| (3) |
The parameter Dj is the density of the ligand on each GNP which is calculated by the number of ligand divided by the surface area of the Au core. The Nm is a normalizing constant and equals to 15 in this study, which is similar to the average number of atoms or bonds for the GNP ligands. The value 0.3 was used as the threshold because it is the average size of water molecules. This enhanced Nano-GCA approach could be applied to calculate the LogP for the seven GNPs in library 2 since the density of ligands was available for these newly designed GNPs.
Based on the nano-GCA approach, the LogP values were calculated by the contributions of the atoms/groups of ligands (Equation (1)). Due to the existence of the structural hindrance, which was represented by penalty factor Pi in Equation (1), only the atoms/groups near to the surface will give significant effects. Table S2 shows the detailed contributions of all the atoms/groups for the surface ligands to the LogP calculations of the 42 GNPs. From this table, we need to point out that some groups (–CH3 and –OH in Table S2) only exist in the end of GNP ligands. Although we showed the contributions (in Equation (1)) of these two groups for LogP calculations in different locations from ligand surface, the occurrence parameter Gi in Equation (1) constantly equal to zero if they do not locate on the ligand surface. More importantly, it is noticeable that using the current Nano-GCA model of these 42 GNPs, the LogP values were calculated based on the contributions of the first four heavy atoms/groups from the ligand surface. Starting the fifth atoms, the contributions of the fragments were eliminated since the solvent molecules (such as water molecules) were considered not to be able to reach and affect the contributions of these atoms/groups. This approximation, which was developed arbitrarily, may result in prediction errors since we did not consider the density of ligands in this dataset. It is likely that the solvent molecules could reach deeper when the density of the surface ligands becomes lower. For this reason, we designed and synthesized seven GNPs in library 2. By employing ligand density as a parameter in Nano-GCA (Equation (3)), the contributions of ligand fragments varied with different ligand density (Table S5).
2.8. Synthesis of ligands for library 2
2.8.1. General procedure for the synthesis of hydrophilic ligand A
Triethylene glycol (1#, 67 mL, 500 mmol) and TEA (28.11 mL) were dissolved in 50 mL DCM. A solution of 4-toluene sulfonyl chloride (19.05 g, 100 mmol) in 100 mL DCM was added to the mixture dropwise in ice bath. Then the mixture was allowed to react at room temperature until the end of the reaction which could be monitored by TLC. The filtrate was extracted with water twice and the organic layer was dried with anhydrous sodium sulfate, the resulting solution was evaporated and purified by column chromatography on silica gel (Et2O:CH2Cl2 = 1:2) to give a product of 2#.
Phthalimide (15.37 g, 83 mmol), Hexadecyltri-n-butylphosphonium bromide (4.39 g, 8.625 mmol) and the product of 2# (21.0 g, 69 mmol) were dissolved in 200 mL methylbenzene. Under the protection of N2, the reaction was conducted in oil bath with controlled temperature at 90–100 °C for 4 h. The solvent was evaporated and purified by column chromatography on silica gel (Petroleum ether: ethyl acetate = 1:1) to give a product of 3#.
Hydrazine hydrate (760 µL, 12 mmol) and 3# (1.674 g, 6 mmol) was mixed with ethanol (60 mL), the reaction was stirred for 6 h at 75 °C until no white precipitation appeared. The mixture was filtrated at room temperature. The filtrate was evaporated and was added with DCM, discard the white solid and the solution was evaporated to give a product of 4#.” to “Hydrazine hydrate (760 µL, 12 mmol) and 3# (1.674 g, 6 mmol) were mixed with ethanol (60 mL) and the reaction mixture was stirred for 6 h at 75 °C. The mixture was filtered at room temperature. The filtrate was evaporated and washed with DCM, to give product 4#.
Thioctic acid (0.619 g, 3 mmol) was dissolved in 15 mL DCM. DCC (0.5674 g, 2.75 mmol) was added and stirred for 2 h until a large amount of white solid appeared. Then the product of 4# (1.210 g) and DMAP were added to the above mixture dropwise, and stirred for 4 h at room temperature. After reaction, retain the filtrate and was added with EtOAc in ice bath, the resulting white precipitation was removed and the solution was concentrated and purified by column chromatography on silica gel (CH2Cl2:CH3OH = 20:1) to give the end product of ligand A. 1HNMR (400MHz, DMSO) δ 1.46 (m, 2H), 1.56 (m, 3H), 1.66 (m, 1H), 1.86 (m, 1H), 2.06 (t, J = 9.6, 2H), 2.46 (m, 1H), 3.19 (m, 4H), 3.31 (m, 4H), 3.49 (m, 6H), 3.60 (m, 1H), 4.56 (t, J = 7.2, 1H), 7.82 (t, J = 7.2, 1H). ESI-MS m/z = 338 (MH+).
2.8.2. General procedure for the synthesis of hydrophobic ligand B
Thioctic acid (0.6190 g, 3 mmol) was dissolved in 15 mL DCM, DCC (0.5674 g, 2.75 mmol) was then added in and a large amount of white solid appeared after stirring for 2 h. After that, n-Undecylamine (387 µL, 3.75 mmol) and DMAP (0.0305 g, 0.25 mmol) was added to the mixure respectively in order and the mixture was stirred for 4 h at room temperature. Discarding the solid material in the mixture, the solvent was evaporated under reduced pressure, and EtOAc was added in ice bath, after removal of white precipitation with a filter, the solution was extracted with NaHCO3 (0.05 M, twice), HCl (2%, once) and water (once), respectively. Then the obtained organic layer was dried with anhydrous sodium sulfate. At last, the filtrate was concentrated and purified by column chromatography on silica gel (Petroleum ether: ethyl acetate = 2:1) to give the product of ligand B. 1HNMR (400 MHz, DMSO) δ 0.88 (t, 3H), 0.91–1.16 (m, 16H), 1.29 (m, 4H), 1.51 (m, 3H), 1.75 (m, 1H), 1.89 (m, 1H), 2.04 (m, 2H), 2.47 (m, 1H), 3.07 (m, 2H), 3.14 (m, 2H), 3.63 (m, J = 9.6, 1H), 7.71 (t, J = 7.2, 1H). ESI-MS m/z = 360 (MH+).
2.9. Synthesis of f-GNPs for library 2
0.625 mL of water containing hydrogen tetrachloroaurate (III) trihydrate (0.032 mmol) was added to a solution of mixture of ligand A and ligand B in different ratios in DMF, after stirring for 30 min at room temperature, sodium tetrahydroborate (5.0 mg, 0.131 mmol) was added to the mixture dropwise. The solution turned red immediately and was stirred for 4 h at room temperature. 1 N HCl was added to the reaction mixture dropwise to neutralize the excess sodium tetrahydroborate until the pH reached 7.0. To remove the free ligand and solvent molecules from the nanoparticles, the reaction mixture was centrifuged at 15,000 rpm for 20 min. The colorless supernatant was decanted and the solid was dissolved in DMF and deionized water alternatively by sonication and centrifuged again at 15,000 rpm for 20 min. This wash–centrifugation cycle was repeated five times. After the final washing step, the nanoparticles were dried in vacuum at 50 °C for 12 h.
2.10. Analysis of integrity of GNP ligands by HPLC/MS after I2 cleavage
GNPs (1.0 mg) were suspended in 100 µL MeOH. A solution of I2 (100 µL, 13 mg/mL) was added to the mixture and it was stirred for 30 min at room temperature. Then the naked GNPs were removed by centrifugation at 15,000 rpm for 30 min, and 20 µL of the supernatant was injected into the HPLC/MS/UV system for analysis.
Separately, a series of standard solutions of ligand A and ligand B with known concentrations were prepared respectively and were analyzed on HPLC/MS/UV system. From chromatogram peak areas of each ligand, a standard curves for each ligand was obtained. These standard curves were used for quantitative analyses of cleaved ligands.
HPLC/MS was performed on a Waters XTerra MS-C18 (2.1 mm × 50 mm, 5 µm) system with a PDA detector, UV detection was at 214 nm, the eluent was acetonitrile and water. The injection was 10 µL for all samples and standard solutions at 25 °C.
2.11. Analysis of integrity of GNP ligands by 1HNMR after I2 cleavage
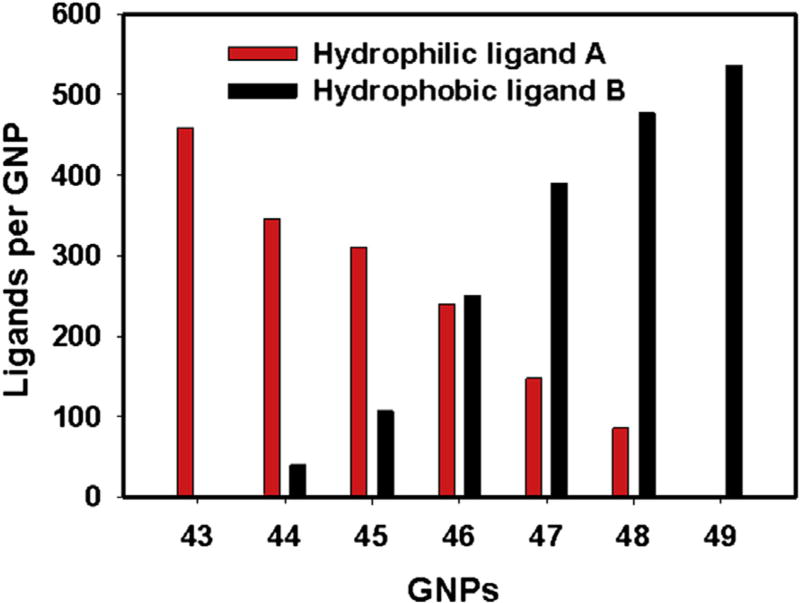
Ligand integrity on GNP-43, -46, and -49 were cleaved and analyzed using NMR method. GNP-43 has only the hydrophilic ligand A. GNP-46 has almost 1:1 mixture of hydrophilic ligand A and hydrophobic ligand B (Number of A:Number of B = 240:251). GNP-49 has only the hydrophobic ligand B. GNPs (20 mg) were suspended in 2 mL of MeOH. A solution of I2 (2 mL, 13 mg/mL) was added to the mixture and it was stirred for 30 min at room temperature. The naked GNPs were removed by centrifugation at 15,000 rpm for 30 min and the supernatant was analyzed by 1HNMR. The naked GNPs were washed and dried for elemental analysis to confirm that there is no remaining ligand molecule on nanoparticles.
2.12. Macrophages
THP-1 cells were cultivated in complete RPMI 1640 culture medium and were grownina humidified incubator at 37 °C (95%roomair, 5% CO2). The incubation of THP-1 cells into macrophages was triggered by incubation with 1‰ phorbol 12-myristate 13-acetate (PMA, Sigma, USA) for 48 h. Macrophages were identified by their adherence to the plastic surface. The nonadherent monocytes were removed carefully and the macrophages in the original plate were washed twice with RPMI 1640.
2.13. Cytotoxicity assays
Cell viability of f-GNP treated THP-1 macrophages was determined by CellTiter-Glo assays. f-GNPs were prepared in cell culture medium. An equal volume of cell culture medium was used as control. Macrophages (4 × 10⁴ cells in 100 µL of culture medium/well) were treated with f-GNPs at concentrations of 100 and 200 µg/mL in a 96-well plate for 24 h. Then the percentage of survival THP-1 macrophages was determined by CellTiter-Glo assay (Promega Corporation, USA) as described by manufacture's protocol.
2.14. Quantitative analysis of cell uptake
Cell uptake of f-GNPs was quantified by ICP-MS measurement. Macrophages (40 × 104 cells in 500 µL of culture medium/well) were incubated with f-GNPs (25 µg/mL) in a 24-well plate for 24 h. Macrophages were washed with PBS three times and detached by adding trypsin-EDTA solution. The detached cells were counted and prepared for ICP-MS measurements.
3. Results and discussion
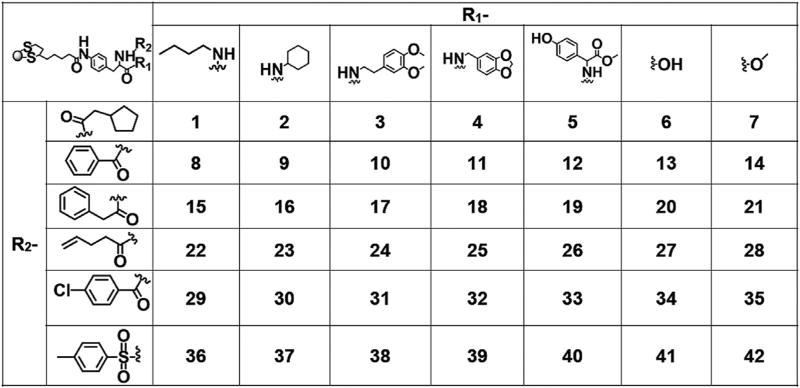
GNP is an ideal model of spherical nanoparticles due to its inertness and the ease of synthesis and surface modification. To generate libraries of GNPs functionalized with ligands (f-GNPs) possessing a wide range of hydrophobicity, we first assembled a combinatorial GNP library containing 42 members (Library 1, Fig. 1). Highly diverse building blocks including seven amines (R1) and six acylators (R2) were used to construct 42 diverse surface ligands to synthesize Library 1. f-GNPs were synthesized by reduction of chloroauric acid in the presence of NaBH4 and the functional ligands (Method 1).
Fig. 1.
Chemical structures of surface ligands and numbering of combinatorial f-GNP library (Library 1) members.
The GNP members of Library 1 had an average diameter of 5.0 nm based on TEM assessment (Method 2 and Fig. S1). Dynamic diameters for f-GNPs in water were between 200 and 300 nm (Method 3 and Figs. S1 and S2) and were stable in aqueous solution (Fig. S3). Like other nanoparticles, these f-GNPs aggregated slightly in water due to their nano-hydrophobicity. The surface ζ potential values of the f-GNPs reflect the electrostatic and electrodynamic properties of the interfaces between the nanoparticles and the aqueous environment. The ζ potential values for all GNPs were lower than −30 mV (Method 4 and Fig. S4), accounting for their stability in aqueous solution.
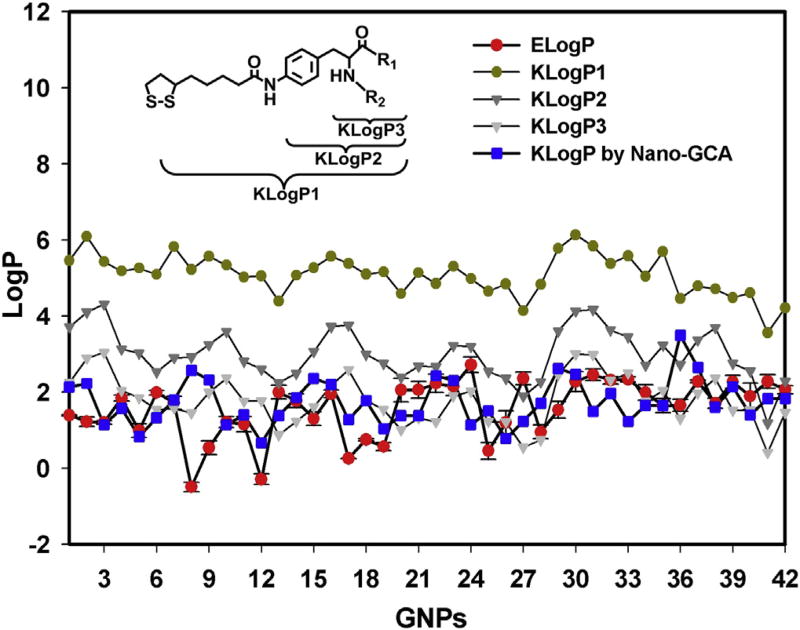
The hydrophobicity of an agent is experimentally evaluated by its LogP value. The LogP of a substance is the logarithm of the ratio between its concentration in an oil phase (water-saturated octanol) and in a water phase (octanol-saturated water). The LogP for each f-GNP in the library was experimentally determined using a modified “shaking flask” method [29] (Method 5) and the Au concentration in each portion was determined by inductively coupled plasma mass spectrometry (ICP-MS) analysis (Method 6, Table S1), herein called ELogP. ELogP values for f-GNP Library 1 ranged from 2.3 to −0.5 (Fig. 2). To reveal the correlation between ligand hydrophobicity and nano-hydrophobicity, we first computed the LogP values for the entire surface ligand using a traditional group contribution approach (GCA) on the basis of ligand structure (KLogP1) [30]. However, the KLogP1 values deviated significantly from the ELogP values, skewing toward higher hydrophobicity value by 3–4 LogP units. Whereas small molecules have a high degree of freedom in solution, the movement of nanoparticle-bound ligands is highly restricted except for the outermost portion of the ligand. Furthermore, the inner segments of the ligand are usually buried by neighboring ligands when the ligand density is high, as it is in this case. As a result, the contacts between solvent molecules and ligand regions near the Au core might be negligible. To test this hypothesis, the calculated LogP values for different ligand substructures, KLogP2 and KLogP3 (Fig. 2), were obtained and compared to the ELogP values. The results (Fig. 2) demonstrated that the KLogP3 values were much closer to the ELogP values than to KLogP1 or KLogP2, indicating that the groups near the outermost region of the surface ligands contributed more to nano-hydrophobicity. Using traditional GCA, each group is equivalently weighted in the calculation and steric hindrance is not considered. To further improve these calculations, a nano-ligand GCA (Nano-GCA) that considers the steric hindrance from surface ligands and the size of water molecules as factors influencing LogP values was applied to the computation (Method 7). Using this approach, the LogP values were calculated including only contributions from ligand groups near the surface. Table S2 depicts the quantitative contribution of each ligand fragment to the LogP calculations. The Nano-GCA approach was an improvement and was more accurate than the KLogP3 value, with the mean absolute error (MAE) reduced from 1.01 to 0.82 and the correlation coefficient (R2) improved from 0.32 to 0.51.
Fig. 2.
Comparison of ELogP values with different computed LogP values. Error bars: standard deviation of values from three independent measurements.
The exposed region of surface ligands might be influenced by both the distance from the core surface and the ligand density. To facilitate the calculation process, only the average density and distance from the core were considered in the above Nano-GCA calculation. To gain an improved understanding of the influence of both distance and accurate surface ligand density on nano-hydrophobicity, another f-GNP library (f-GNP Library 2) was designed and synthesized with a continuous change in hydrophobicity obtained by varying the surface ligand ratio.
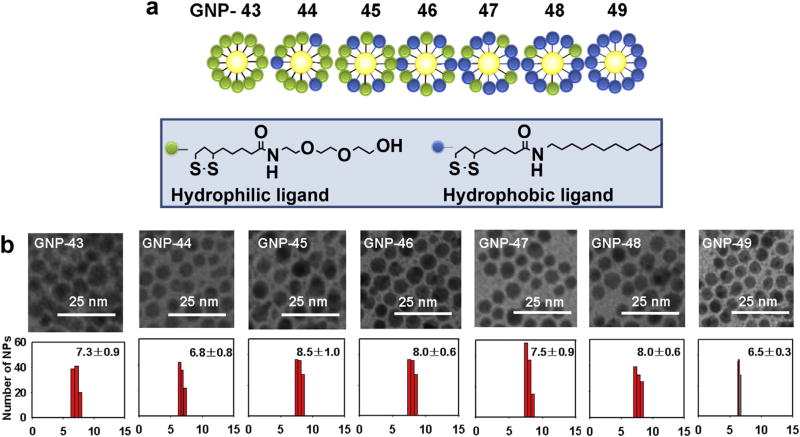
In Library 2, a controlled ratio of hydrophobic and hydrophilic ligands was used to cover the GNP surface, generating a continuous change in the apparent surface hydrophobicity (Fig. 3a). The synthesis of the two surface ligands and GNP Library 2 are shown in Scheme S1 and Methods 8 and 9. The sizes of f-GNPs in Library 2 were between 7.0 and 8.0 nm (Fig. 3b). For surface ligands to affect nano-hydrophobicity, presumably a critical combined property of ligand density and ligand length must be reached. Although such critical parameters still await for further evaluation, we set to determine whether a very high density of ligands was reached in our studies establishing a basis for observing distinctive LogP values from these GNPs. Quantitative analysis of the multiple ligands cleaved from f-GNPs using I2 was accomplished using LC/MS/UV (Method 10, Figs. S5 and S6) [31]. The number of hydrophobic ligands from f-GNP 43–49 ranged from 0 to 536 per particle, and the number of hydrophilic ligands ranged from 459 to 0, indicating a total ligand number between 418 and 563 per particle (Table S3, Fig. 4). To further prove the integrity of ligands on GNPs, we analyzed GNPs 43, 46, and 49 using 1HNMR analyses of cleaved ligands. After I2 cleavage [31], remaining GNPs were separated and analyzed by elemental analysis for C, H, and N to confirm that the cleavage reaction was complete. The cleaved compounds mixtures were analyzed by 1HNMR (Method 11, Figs. S7, S8, S9). Correct ligands in the proper ratio were confirmed by this analysis.
Fig. 3.
(a) Structures and numbering of combinatorial f-GNP library (Library 2) members with a continuous change in hydrophobicity and density by varying the ratio of two ligands covalently linked on the surface of the GNP. (b) TEM images and size distribution of GNPs in library 2.
Fig. 4.
Quantification of cleaved ligands for f-GNPs in library 2 using LC/MS/UV analysis. After I2 cleavage, the identity of ligands was confirmed on the basis of their MW found by mass spectrometry and by comparing their retention times with authentic compounds. The molar concentrations of ligands A or B were quantified on the basis of a standard curves prepared from pure compound A or B (Fig. S5). The number of ligands on each GNP was then calculated.
In an octanol/water system, a gradual increase in hydrophobic ligand density from f-GNP 43 to 49 also increased nano-hydrophobicity, and f-GNPs were gradually transferred from the water phase to the oil phase at equilibrium (Fig. 5a). The ELogP values of these f-GNPs were experimentally determined (Fig. 5c, Tables S3 and S4). Initially, the traditional GCA method was used to predict the LogP values considering the contributions of each atom or group from the entire ligand. However, the significant discrepancies between the ELogP values and the calculated KLogP values indicated the failure of this approach (Fig. 5c). Similar to Library 1, the LogP values of these f-GNPs were estimated based on the properties of the whole ligand and were significantly shifted several units toward more hydrophobic values. This result provided additional confirmation that the exposed region of ligands contributed more than the buried region at this ligand density.
To account for steric hindrance effects, the Nano-GCA method was again applied to KLogP calculations for GNP Library 2. The computational scheme, contributions of atoms and groups, and details of the computational protocol are explained in Fig. 5b and Table S5 in SI. The computed KLogP values by nano-GCA method matched the ELogP values well (Fig. 5d), with an MAE value of 0.27 and R2 = 0.96 (Fig. S10). Compared to the results in Table S2, the modeling results of Library 2 accounted for the surface ligand density of each individual f-GNP. Therefore, the simulation of Library 2 was more accurate than the simulation of Library 1.
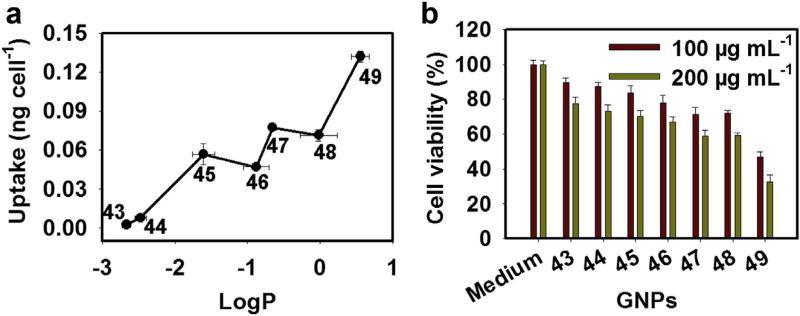
The accurate prediction of nano-hydrophobicity is important for potential biological and medical applications of nanoparticles. To demonstrate that nano-hydrophobicity directly influences a nanoparticle's biological aggressiveness, we further investigated the correlation between cell uptake/cytotoxicity and nano-hydrophobicity (Method 12, 13 and 14). Macrophages constitute our body's first line of defense against foreign particles. To evaluate the danger of nano-hydrophobicity to biological systems, we examined the cellular uptake and cytotoxicity of f-GNPs in THP-1 macrophages. Macrophages internalized more hydrophobic f-GNPs within the same time period (Fig. 6a) and were more susceptible to toxicity by these nanoparticles than by more hydrophilic ones (Fig. 6b). Therefore, nano-hydrophobicity was directly correlated with the cell uptake and cytotoxicity of nanoparticles.
Fig. 6.
Uptake of f-GNPs of varying hydrophobicity by macrophages and associated cytotoxicity. (a) Amount Quantity of f-GNP particles per cell after incubating phorbol-12-myristate-13-acetate (PMA)-induced THP-1 macrophages with f-GNPs (25 µg mL−1) for 24 h. The gold content was quantitatively determined by inductively coupled plasma mass spectrometry (ICP-MS). (b) Percentage of THP-1 macrophage survival after treatment with f-GNPs (100 and 200 µg mL−1) for 24 h with 100% as macrophages treated with cell culture medium alone.
4. Conclusions
In summary, our results demonstrate that the biologically relevant property of nano-hydrophobicity is determined primarily by the outermost region of ligand when the core material does not vary. By varying surface ligands using a nanoparticle library synthesis approach, we have modulated nano-hydrophobicity from −2.66 to 0.55, thereby demonstrating the directed engineering of nano-hydrophobicity. Computational approaches such as the Nano-GCA method enable models to predict nano-hydrophobicity with R2 as high as 0.96. Predictable and controllable nano-hydrophobicity is expected to have a major impact on nanomedicine and nanotoxicology research.
Supplementary Material
Acknowledgments
We thank Yan Xin, Fei Li and Alexander Sedykh for technical assistance. This work was supported by National Natural Science Foundation of China (21137002) and the Strategic Priority Research Program of the Chinese Academy of Sciences (XDB14030401).
Footnotes
Appendix A. Supplementary data
Supplementary data related to this article can be found at http://dx.doi.org/10.1016/j.biomaterials.2015.02.043.
References
- 1.Mahmoudi M, Lynch I, Ejtehadi MR, Monopoli MP, Bombelli FB, Laurent S. Protein–nanoparticle interactions: opportunities and challenges. Chem Rev. 2011;111:5610–37. doi: 10.1021/cr100440g. [DOI] [PubMed] [Google Scholar]
- 2.Yang J, Lee JY, Too H-P, Chow G-M. Inhibition of DNA hybridization by small metal nanoparticles. Biophys Chem. 2006;120:87–95. doi: 10.1016/j.bpc.2005.10.011. [DOI] [PubMed] [Google Scholar]
- 3.Mu Q, Jiang G, Chen L, Zhou H, Fourches D, Tropsha A, et al. Chemical basis of interactions between engineered nanoparticles and biological systems. Chem Rev. 2014;114:7740–81. doi: 10.1021/cr400295a. [DOI] [PMC free article] [PubMed] [Google Scholar]
- 4.Yi C, Liu D, Fong C-C, Zhang J, Yang M. Gold nanoparticles promote osteogenic differentiation of mesenchymal stem cells through p38 MAPK pathway. ACS Nano. 2010;4:6439–48. doi: 10.1021/nn101373r. [DOI] [PubMed] [Google Scholar]
- 5.Nel AE, Mäadler L, Velegol D, Xia T, Hoek EM, Somasundaran P, et al. Understanding biophysicochemical interactions at the nano–bio interface. Nat Mater. 2009;8:543–57. doi: 10.1038/nmat2442. [DOI] [PubMed] [Google Scholar]
- 6.Zhang Y, Bai Y, Jia J, Gao N, Li Y, Zhang R, et al. Perturbation of physiological systems by nanoparticles. Chem Soc Rev. 2014;43:3762–809. doi: 10.1039/c3cs60338e. [DOI] [PubMed] [Google Scholar]
- 7.Tian BZ, Lieber CM. Synthetic nanoelectronic probes for biological cells and tissues. Annu Rev Anal Chem. 2013;6:31–51. doi: 10.1146/annurev-anchem-062012-092623. [DOI] [PMC free article] [PubMed] [Google Scholar]
- 8.Jans H, Huo Q. Gold nanoparticle-enabled biological and chemical detection and analysis. Chem Soc Rev. 2012;41:2849–66. doi: 10.1039/c1cs15280g. [DOI] [PubMed] [Google Scholar]
- 9.Changfeng W, Bull B, Christensen K, McNeill J. Ratiometric single-nanoparticle oxygen sensors for biological imaging. Angew Chem Int Ed. 2009;48:2741–5. doi: 10.1002/anie.200805894. [DOI] [PMC free article] [PubMed] [Google Scholar]
- 10.Nahire R, Haldar MK, Paul S, Mergoum A, Ambre AH, Katti KS, et al. Polymer-coated echogenic lipid nanoparticles with dual release triggers. Biomacromolecules. 2013;14:841–53. doi: 10.1021/bm301894z. [DOI] [PMC free article] [PubMed] [Google Scholar]
- 11.Han G, Ghosh P, De M, Rotello VM. Drug and gene delivery using gold nanoparticles. Nanobiotechnology. 2007;3:40–5. [Google Scholar]
- 12.Ghosh P, Han G, De M, Kim CK, Rotello VM. Gold nanoparticles in delivery applications. Adv Drug Deliv Rev. 2008;60:1307–15. doi: 10.1016/j.addr.2008.03.016. [DOI] [PubMed] [Google Scholar]
- 13.Kim K, Fisher JP. Nanoparticle technology in bone tissue engineering. J Drug Target. 2007;15:241–52. doi: 10.1080/10611860701289818. [DOI] [PubMed] [Google Scholar]
- 14.Shi J, Votruba AR, Farokhzad OC, Langer R. Nanotechnology in drug delivery and tissue engineering: from discovery to applications. Nano Lett. 2010;10:3223–30. doi: 10.1021/nl102184c. [DOI] [PMC free article] [PubMed] [Google Scholar]
- 15.Kim ST, Saha K, Kim C, Rotello VM. The role of surface functionality in determining nanoparticle cytotoxicity. Acc Chem Res. 2013;46:681–91. doi: 10.1021/ar3000647. [DOI] [PMC free article] [PubMed] [Google Scholar]
- 16.Verma A, Stellacci F. Effect of surface properties on nanoparticle–cell interactions. Small. 2010;6:12–21. doi: 10.1002/smll.200901158. [DOI] [PubMed] [Google Scholar]
- 17.Walkey CD, Olsen JB, Guo H, Emili A, Chan WC. Nanoparticle size and surface chemistry determine serum protein adsorption and macrophage uptake. J Am Chem Soc. 2012;134:2139–47. doi: 10.1021/ja2084338. [DOI] [PubMed] [Google Scholar]
- 18.Gessner A, Waicz R, Lieske A, Paulke B-R, Mäader K, Müller R. Nanoparticles with decreasing surface hydrophobicities: influence on plasma protein adsorption. Int J Pharm. 2000;196:245–9. doi: 10.1016/s0378-5173(99)00432-9. [DOI] [PubMed] [Google Scholar]
- 19.Pogodin S, Werner M, Sommer J-U, Baulin VA. Nanoparticle-induced permeability of lipid membranes. ACS Nano. 2012;6:10555–61. doi: 10.1021/nn3028858. [DOI] [PubMed] [Google Scholar]
- 20.Moyano DF, Goldsmith M, Solfiell DJ, Landesman-Milo D, Miranda OR, Peer D, et al. Nanoparticle hydrophobicity dictates immune response. J Am Chem Soc. 2012;134:3965–7. doi: 10.1021/ja2108905. [DOI] [PMC free article] [PubMed] [Google Scholar]
- 21.Lipinski CA, Lombardo F, Dominy BW, Feeney PJ. Experimental and computational approaches to estimate solubility and permeability in drug discovery and development. Adv Drug Deliv Rev. 2001;46:3–26. doi: 10.1016/s0169-409x(00)00129-0. [DOI] [PubMed] [Google Scholar]
- 22.Lipinski CA. Lead-and drug-like compounds: the rule-of-five revolution. Drug Discov Today Technol. 2004;1:337–41. doi: 10.1016/j.ddtec.2004.11.007. [DOI] [PubMed] [Google Scholar]
- 23.Xiao Y, Wiesner MR. Characterization of surface hydrophobicity of engineered nanoparticles. J Hazard Mater. 2012;215:146–51. doi: 10.1016/j.jhazmat.2012.02.043. [DOI] [PubMed] [Google Scholar]
- 24.Zhou H, Mu Q, Gao N, Liu A, Xing Y, Gao S, et al. A nano-combinatorial library strategy for the discovery of nanotubes with reduced protein-binding, cytotoxicity, and immune response. Nano Lett. 2008;8:859–65. doi: 10.1021/nl0730155. [DOI] [PubMed] [Google Scholar]
- 25.Zhou H, Jiao P, Yang L, Li X, Yan B. Enhancing cell recognition by scrutinizing cell surfaces with a nanoparticle array. J Am Chem Soc. 2010;133:680–2. doi: 10.1021/ja108527y. [DOI] [PubMed] [Google Scholar]
- 26.Zhang B, Xing Y, Li Z, Zhou H, Mu Q, Yan B. Functionalized carbon nanotubes specifically bind to α-chymotrypsin's catalytic site and regulate its enzymatic function. Nano Lett. 2009;9:2280–4. doi: 10.1021/nl900437n. [DOI] [PMC free article] [PubMed] [Google Scholar]
- 27.Gao N, Zhang Q, Mu Q, Bai Y, Li L, Zhou H, et al. Steering carbon nanotubes to scavenger receptor recognition by nanotube surface chemistry modification partially alleviates NFκB activation and reduces its immunotoxicity. ACS Nano. 2011;5:4581–91. doi: 10.1021/nn200283g. [DOI] [PMC free article] [PubMed] [Google Scholar]
- 28.Wu L, Zhang Y, Zhang C, Cui X, Zhai S, Liu Y, et al. Tuning cell autophagy by diversifying carbon nanotube surface chemistry. ACS Nano. 2014;8:2087–99. doi: 10.1021/nn500376w. [DOI] [PMC free article] [PubMed] [Google Scholar]
- 29.Leo A, Hansch C, Elkins D. Partition coefficients and their uses. Chem Rev. 1971;71:525–616. [Google Scholar]
- 30.Zhu H, Sedykh A, Chakravarti SK, Klopman G. A new group contribution approach to the calculation of LogP. Curr Comput.-Aided Drug Des. 2005;1:3–9. [Google Scholar]
- 31.Zhou H, Li X, Lemoff A, Zhang B, Yan B. Structural confirmation and quantification of individual ligands from the surface of multi-functionalized gold nanoparticles. Analyst. 2010;135:1210–3. doi: 10.1039/c0an00066c. [DOI] [PMC free article] [PubMed] [Google Scholar]
Associated Data
This section collects any data citations, data availability statements, or supplementary materials included in this article.


