

Abstract
The induction of autophagy by nanoparticles causes nanotoxicity, but appropriate modulation of autophagy by nanoparticles may have therapeutic potential. Multiwalled carbon nanotubes (MWCNTs) interact with cell membranes and membrane-associated molecules before and after internalization. These interactions alter cellular signaling and impact major cell functions such as cell cycle, apoptosis, and autophagy. In this work, we demonstrated that MWCNT-cell interactions can be modulated by varying densely distributed surface ligands on MWCNTs. Using a fluorescent autophagy-reporting cell line, we evaluated the autophagy induction capability of 81 surface-modified MWCNTs. We identified strong and moderate autophagy-inducing MWCNTs as well as those that did not induce autophagy. Variation of the surface ligand structure of strong autophagy nanoinducers led to the induction of different autophagy-activating signaling pathways, presumably through their different interactions with cell surface receptors.
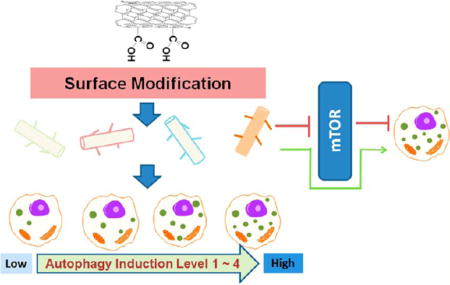
Keywords: carbon nanotube, surface modification, mTOR, autophagy, combinatorial library, signaling pathway
Graphical Abstract
Autophagy is a catabolic mechanism that is evolutionarily conserved from yeast to mammals. According to how the degrading components are delivered to the lysosomes, the autophagy can be further classified into macroautophagy, microautophagy, and chaperone-mediated autophagy. Macroautophagy is the most common form of autophagy. During macroautophagy (abbreviated as autophagy), unnecessary or dysfunctional cellular components from stressed cells are degraded to provide energy. Under normal physiological conditions, this process is suppressed to a basal level by the serine/threonine protein kinase mammalian target of rapamycin (mTOR). Upon starvation or rapamycin treatment, the inhibitory effects of mTOR on its target, autophagy-related gene (atg) proteins, are relieved. Atg proteins form complexes on the phagophore assembly sites and initiate autophagosome formation.1 Other autophagy-inducing pathways independent of mTOR are also known.2For example, an increased release of lumenal Ca2+ to the cytosol induces a downstream signaling cascade leading to mTOR-independent autophagy.3 However, many mTOR-independent autophagy induction pathways have yet to be elucidated. Considering the complexity of cellular signaling networks, vast uncertainties regarding autophagy induction and control remain.
Autophagy plays an essential role in maintaining the homeostasis of cells. The inability to regulate autophagy is associated with aging,4 neurodegeneration,5 cancer,6 type-2 diabetes,7 and atherosclerosis.8 For example, autophagy blockade that disables a cell's ability to degrade overexpressed α-synuclein may be a cause of Parkinson's disease.9 Autophagy deficiency also increases the risk of tumorigenesis.6 Once the tumor is established, tumor cells rely on autophagy to protect them against metabolic stress and drug therapy.6,10 But if the autophagy was kept at a relatively high level, cells may undergo autophagic cell death.11 Thus, some therapeutic agents that could induce autophagic cell death in tumor cells are promising as a useful supplement to current cancer treatment strategies.12 Therefore, the role of autophagy in physiology and pathology is very complex, and its precise regulation is essential. A bottleneck in the development of therapeutics is a shortage of pharmacological tools that modulate different autophagy pathways to control autophagy events. Although the current small molecule approach is promising, it must be complemented by other approaches.13 With the rapid development of nanotechnology, nanomaterial-based products have been widely used in various industries, medicine, and more than 1300 marketed consumer products. A thorough understanding of the mechanisms that nanoparticles use to perturb biological systems, including autophagy induction, is critical for a more comprehensive elucidation of nanotoxicity. Bioactive nanomaterials may also serve as powerful tools to solve unmet medical needs, such as the development of autophagy inducers and inhibitors.
Like small molecules, nanoparticles such as carbon nanotubes (CNTs) trigger cell autophagy.14,15 Unpredictable autophagy induction or autophagy flux blockade by nanoparticles often induces cytotoxicity.16 However, autophagy modulation by nanoparticles may also present a potential therapeutic opportunity. Both the dimensions and surface properties of nanoparticles affect the autophagic responses of cells.17,18 In addition to their wide applications in industrial and consumer products, CNTs have also been explored in applications such as drug delivery, imaging enhancement, and tissue engineering inside the human body. The feasibility of modifying the surface chemistry of CNTs permits the introduction of various biological properties. We19,20 and other groups21 have shown that surface functionalization of CNTs helps optimize their bioactivities for biomedical applications21 and toxicity remediation.19,20
To further our previous efforts on modulating the biological activities of CNTs through surface chemistry modifications, in this investigation, we explored how surface-modified CNTs modulate cell autophagy to various manageable levels, including a complete evasion of autophagy. In addition to modulating autophagy intensity, we also report for the first time that surface ligand modification switches mTOR-dependent autophagy induction to an mTOR-independent signaling pathway.
RESULTS AND DISCUSSION
Surface-Modified Carbon Nanotubes as Cell Autophagy Probes
Cellular perturbations by nanoparticles include the induction of autophagy.22,23 Some modified single-walled CNTs prevent autophagy;24 however, the structural basis of autophagy induction remains unclear. To gain a better understanding of the role of CNT surface chemistry in autophagy regulation, we systematically investigated autophagy induction by 81 multiwalled CNTs (MWCNTs) with surface ligands modified by combinatorial chemistry (Figure S1, Supporting Information). This MWCNT library was designed to have maximum surface ligand structural diversity.25,26 To achieve this design, we selected synthetic building blocks that produce final ligands with the most diverse physicochemical properties, such as hydrophobicity, hydrogen binding, pKa, and solubility, on the basis of computational analysis. MAS–1H NMR and FT-IR analyses confirmed that the diverse molecules were successfully and quantitatively linked to the MWCNTs.20 The loading capacity of ligands on the surface of the MWCNTs was 0.3–0.4 mmol/g, as indicated by quantitatively analyzing the nitrogen content of the products after a complete amidation reaction with the precursor MWCNT-COOH. On the basis of the functional loading (0.3–0.4 mmol/g) and surface area (500 m2/g) of the carbon nanotubes, we estimated that the average density of the modification was approximately 4–5 modifications per 10 nm2. This ligand density indicated that functional groups are mainly distributed along the sidewalls of nanotubes in addition to the tube termini. This result was not surprising because strong oxidation conditions were used in the preparation of MWCNT-COOH. Because multiple oxidation and purification steps were used, trace metal impurities were very low as quantified by ICP-MS analysis of 23 trace metals (Table S1, Supporting Information). MWCNTs were thoroughly characterized to understand their physicochemical properties and biological interactions. Although rigorous characterization could not be performed on every MWCNT, we carefully analyzed more than 20 randomly selected and diverse MWCNTs by transmission electron microscopy, zeta potential measurement, magic angle spinning NMR, FTIR, elemental analysis, and serum protein binding assay (Figure S1 and Table S1, Supporting Information). These analyses demonstrated that the MWCNTs had comparable morphologies, solution electrostatic and electrodynamic properties, and serum protein binding abilities. The cytotoxicity of all 81 MWCNTs was assessed in several cell lines. Below a concentration of 100 µg/mL, MWCNTs exhibited very low cytotoxicity. All MWCNTs were stably suspended in water at a concentration of 2 mg/mL. For cell assays, MWCNTs were suspended in cell culture medium that contained fetal bovine serum proteins, which further increased the solubility and stability of the nanotube suspension. The characterizations of these 81 MWCNTs confirmed that they were highly consistent in terms of morphology, physical properties, ligand density, and stability of their aqueous suspensions. Therefore, we expect that the interactions between these MWCNTs and cells should be the result of interactions between surface-modified nanotubes and cell surface molecules.
MWCNTs Tune Cell Autophagy to Various Levels
To assess cell autophagy quickly using a high-throughput format, we stably transfected human astrocytoma U87 cells with the LC3-GFP construct to establish an autophagy reporter cell line. U87 cells are astrocyte-like and are good models of astrocytes normally found in human brains.27 LC3 (microtubule-associated protein 1A/1B-light chain 3) is an ubiquitin-like protein. Upon autophagic stimulation, it is conjugated to phosphatidylethanolamine to form the LC3-II isoform, a marker for autophagy,28 on the surface of autophagosomes. Thus, the formation of autophagosomes can be directly observed as fluorescent punctuates when LC3 colocalizes with autophagosomes in LC3-GFP U87 cells. Our experiment showed that the cytotoxicity of the MWCNTs was rather low at concentration of 100 µg/mL in HEK 293 cell line (Figure S2, Supporting Information). However, at these concentrations, the cells were subjected to a stressful condition, which might induce autophagy. MWCNT-COOH and 80 surface-modified MWCNTs were incubated with LC3-GFP U87 cells, and autophagy induction was determined on the basis of the relative number of fluorescent autophagosomes (LC3-GFP punctuates) formed. Counting the LC3-GFP punctuates allowed us to rank the autophagy-inducing capabilities of the MWCNTs (Figure 1, Figure 2A). The cell culture medium and 7 MWCNTs induced 8 or less punctuates in cells, representing a basal level of autophagy induction;7 MWCNTs induced more than 18 punctuates in the cells, indicating strong autophagy induction, 41 MWCNTs induced 12–18 punctuates, and 26 MWCNTs induced 8–12 punctuates (Figures 2B and S3, Supporting Information).
Figure 1.

Autophagy induction by MWCNT library in LC3-GFP U87 cells. Surface modifications on MWCNTs were shown by R1R1N – and R2 side chain groups indicated in a combinatorial synthesis format. MWCNTs were screened against an autophagy reporter cell line stably expressing LC3-GFP fusion protein (LC3-GFP U87). Concentration of CNT was 100 µg/mL, and cell incubation time was 24 h. The scale bar in upper left panel represents 10 µm.
Figure 2.

Heat-map of autophagy induction capabilities of MWCNTs. Cell autophagy induction by 81 MWCNTs was assessed in a high throughput assay. The combinatorial MWCNT library synthesis format can be seen in (A). The numbering of library members are shown from 1 to 80. LC3-GFP U87 reporter cells were incubated with MWCNT (100 µg/mL) for 24 h, and the average number of punctuates per cell was counted for a population of at least 30 cells. The autophagy induction capability was ranked in four categories as shown by different colors (A) and plotted (B).
Considering that the counting of fluorescent punctuates was somewhat subjective, we also quantitatively determined LC3-II protein levels by an immunoblotting assay, as described in later sections. The cellular level of LC3-II was proportional to the level of autophagy induction as assessed by fluorescent LC3-GFP punctate. Therefore, these results demonstrate that cellular autophagy can be modulated to various levels by modifying the chemical structure of the MWCNT surface ligands. Cell autophagy is very complex. Autophagy-mediated cell death is one plausible mechanisms for nanotoxicity.16 However, autophagy is also a common mechanism for beneficial cell survival. In cancer chemotherapy, autophagy may also mediate unwanted cancer cell survival, and thus novel therapeutic agents are critical for controlling cellular autophagy. CNTs have been explored and considered for various biomedical applications.29 Their roles in modulating cell autophagy, as demonstrated here, further indicate their potential in nano-medicine. In this diversely designed MWCNT library, each MWCNT carried a unique surface ligand. The ligands on the different MWCNTs have very different chemical structures and diverse physicochemical properties, which may allow the MWCNTs to interact with cells or cell surface proteins with different binding affinities, thereby inducing different levels of cell autophagy.
Autophagy Induction by MWCNTs Across Cell Lines
Autophagy induction as a result of the interaction of nanoparticles with cell surface receptors or cell signaling pathways should not be limited to a single cell line. To determine if our findings are limited to neural cells, we investigated the autophagy-inducing effects of MWCNTs in HEK 293, a human embryonic kidney cell line. Although the HEK 293 cells were not transfected with LC3-GFP, their autophagy could be unambiguously detected by LC3 II formation after MWCNT treatment. First, we incubated HEK 293 and U87 cells with seven MWCNTs (MWCNT-COOH, 8, 9, 11, 13, 33, 41) and measured LC3 II formation in both cell lines (Figure 3A,B). The significant induction of LC3 II bands confirmed that these MWCNTs induced autophagy in both cell lines. Next, we randomly selected MWCNTs that possessed different autophagy induction capabilities and again examined their autophagy induction by assessing LC3 II formation. In both cell lines, these MWCNTs induced LC3 II formation at different levels (Figure 3C,D), consistent with the autophagy induction capabilities indicated in our primary screening (Figure 1). These results demonstrated that surface-modified MWCNTs modulate cell autophagy to different levels and that this modulation may not be limited to one single cell line. This finding enables the development of autophagy-regulating nanotherapeutics or biocompatible nanomaterials for general use.
Figure 3.

Autophagy induction by MWCNTs as indicated by LC3-II formation across cell lines. Cells were treated with MWCNTs with strong autophagy induction in HEK 293 (A) and U87 (B) cell lines and MWCNTs with various autophagy induction in HEK 293 (C) and U87 (D) cell lines. The concentration of MWCNT was 100 µg/mL. Cells were incubated with MWCNT for 24 h before protein extraction and Western blotting using an LC3B antibody. β-Actin was used as a loading control.
MWCNTs with Different Chemistries Induce Autophagy by Activating Different Signaling Pathways
Autophagy is regulated by mTOR-dependent or -independent signaling pathways.30 Pharmacological manipulation of autophagy requires flexibility in regulating various autophagy-related pathways.13 We next examined whether altering the chemical structure of the surface ligand of the MWCNT would change the molecular pathways involved in autophagy activation.
p70S6K and p85S6K are substrates of mTOR kinase. The phosphorylation of p70S6K and p85S6K directly reflects the activation of mTOR.31 In mTOR-dependent autophagy induction, mTOR or the phosphorylation of p70S6K/p85S6K is suppressed. Using the anti-S6K antibody recognizing the phosphorylated (active) forms of the p70S6K and p85S6K proteins, we found that rapamycin significantly suppressed the phosphorylation of both p70S6K and p85S6K, consistent with the direct inhibition of mTOR by rapamycin (Figure 4A). Autophagy-inducing MWCNT-COOH generated LC3 II formation and also suppressed p70 and p85 phosphorylation (Figure 4A). This indicates that MWCNT-COOH induces autophagy through the mTOR-dependent pathway and its autophagy induction capability is not as strong as rapamycin. MWCNTs 13 and 33 exhibited similar inhibition of phosphorylation (Figure 4B). However, MWCNT 41 did not inhibit mTOR, yet it significantly induced cell autophagy as shown by LC3-II formation (Figure 3). This indicates that MWCNT 41 might induce autophagy through an mTOR-independent signaling pathway. Other MWCNTs, such as 9 and 11, may induce similar effects to differing extents. These results suggest that modifying the surface chemistry of MWCNTs can enable the modulation of autophagy induction by activating different cellular signaling pathways.
Figure 4.

mTOR-dependent and -independent autophagy induction by MWCNTs. The phosphorylation level of mTOR kinase substrates p85S6K and p70S6K was analyzed by immunoblot assay (A). The involvement of mTOR pathway in autophagy was quantified by the ratio of band intensities of phospho-p70S6K over β-actin (B). Red arrows indicate MWCNT-COOH and MWCNT 41. Rapamycin (Rapa, 4 µM) was used as a positive control.
Two MWCNTs with Different Surface Chemistries Induce Autophagy by Activating mTOR-Dependent or -Independent Pathways
To further clarify the autophagy induction mechanisms, we investigated autophagy induction by MWCNT-COOH and MWCNT 41. Both MWCNTs have similar diameters, length distributions, surface electrostatic properties, and functional group densities (loadings), with the exception of their different surface ligands (Table S1, Supporting Information). First, we confirmed that both MWCNTs induced autophagy, as indicated by the number of LC3 punctuates (Figure 5A). To confirm these results, autophagosomes were identified by TEM in the cytosol of HEK 293 cells after treatment with MWCNT-COOH and MWCNT 41 for 4 h (Figure 5B). Furthermore, both MWCNTs induced cellular LC3 II formation in a dose-dependent manner, which validated autophagy induction at the molecular level (Figure 6A). MWCNTs were also observed in autophagosomes, demonstrating that cells tend to clear MWCNTs through the autophagic lysosomal pathway like other infectious agents.32 Autophagy is a dynamic process including the formation of autophagosomes and the degradation of autophagosomes by lysosomes. An increased level of LC3 II, which is a marker of autophagosome formation, could be caused by either an enhanced formation of autophagosomes at a regular rate of their degradation or a blockade of the autophagosome degradation with a basal level of autophagy. Nanomaterials have been reported to have controversial roles on the autophagy flux. Some impair lysosome function and induce an accumulation of autophagosomes even at a basal level of autophagy.22 Others enhance autophagosome formation.33 To elucidate whether MWCNTs induced autophagy, we used a specific vacuolar-type H+-ATPase inhibitor bafilomycin A1 to clamp the degradation of autophagosomes by lysosomes.28 Our data showed that MWCNT-COOH or MWCNT 41 induced a higher level of LC3 II in HEK 293 cells treated with bafilomycin A1 than cells treated with bafilomycin A1 alone (Figure 6B). Therefore, MWCNT-COOH and MWCNT 41 induced autophagy rather than a blockade of lysosomal degradation of autophagosomes.34
Figure 5.

MWCNT-COOH and MWCNT 41 induce cell autophagy. (A) Induced cell autophagy is assayed by immunofluorescence in U87 reporter cells. Representative images of MWCNT 100 µg/mL were shown. Medium and rapamycin (Rapa, treated for 4 h at 4 µM) were respectively used as negative and positive controls. The scale bar (top left) is for 20 µm. (B) Transmission electron microscope images show autophagosomes formation in treated HEK 293 cells; the inset images are the enlargement of a single autophagosome (broad black arrow indicates an autophagosome; narrow black arrow in the inset indicates MWCNTs in autophagosomes). The scale bar represents 500 nm.
Figure 6.

Autophagy induction by MWCNTs but not ligands. In HEK 293 cells, MWCNT-COOH and MWCNT 20 induce an increased level of LC3 II isoform, while the small molecule ligands alone did not. (A) After treatment with both MWCNT-COOH and MWCNT 41 at different concentrations, the levels of LC3 I and LC3 II isoforms were detected by immunoblot assay. Rapamycin (treatment for 4 h at 4 µM) was used as the positive control. 3-Methyladenine was used as an autophagy inhibitor. (B) HEK 293 cells were treated with MWCNT-COOH or MWCNT 41 at 100 µg/mL with or without bafilomycin (100 nM) for 4 h. Cell lysate was then analyzed by Western blot against LC3B antibody. Bar chart represents the normalized band intensity ratio of LC3 II and β-actin as quantified by ImageJ. (C) Free small molecule ligands for modifying both MWCNTs surface did not cause an increase in level of LC3 II isoform using the equivalent concentration 0.04 µM. β-Actin was used as loading control.
The observed autophagy induction could be partially or entirely due to the free ligands detached from the MWCNTs. To demonstrate that the autophagy induction effect is a result of surface-modified MWCNTs rather than the sole action of the free ligands, we tested the effects of free ligand molecules on autophagy induction in HEK 293 cells. A concentration of 0.04 µM was deemed equivalent to the presumed situation that 100% of the ligands were detached from the surface of the MWCNTs at the experimental concentration. We treated cells with two ligand molecules (structures in Figure 6C) at this concentration for 24 h. Although MWCNT-COOH and MWCNT 41 led to a dose-dependent increase in LC3 II formation in HEK 293 cells (Figure 6A), neither free ligand molecule induced these effects (Figure 6C). This result confirms that the surface-modified MWCNT and not the free ligand induced cell autophagy. In addition, a basal level of autophagy was observed in both U87 and HEK 293 cells (culture medium in Figure 5A and 6A), confirming that basal autophagy was necessary to maintain normal cell physiology.35
MWCNT-COOH and MWCNT 41 are both strong autophagy inducers, but it is not clear if they activate autophagy through the mTOR-signaling pathway. To answer this, we examined the activation of mTOR and its substrate, p70S6K. MWCNT-COOH treatment inhibited the phosphorylation of both mTOR and p70S6K in a dose-dependent manner (Figure 7A). In sharp contrast, MWCNT 41 treatment did not reduce the phosphorylation of either of the proteins (Figure 7B, C). These contrasting results demonstrate that MWCNT-COOH triggers mTOR-dependent autophagy induction, while MWCNT 41 triggers mTOR-independent autophagy induction (Figure 7D).
Figure 7.

mTOR-dependent and -independent autophagy induced by MWCNT-COOH and 41. HEK 293 cells were treated with MWCNTs at different concentrations for 24 h before harvesting cell lysates for immunoblot assay. Rapamycin (4 µM) was used as a positive control. β-Actin was used as a loading control. (A) The phosphorylated forms of mTOR (p-mTOR) and its substrate p70S6K (p-p70S6K) were decreased by treatment with MWCNT-COOH in a dose dependent manner. (B) In comparison, treatment with MWCNT 41 did not lead to such a change. Values above each band represent the band intensity ratio for p-mTOR/mTOR. (C) Ratio of band intensity for p-p70S6K/β-actin and p70S6K/β-actin. *P < 0.05, **P < 0.01 vs medium control, #P < 0.05 vs value at 50 µg/mL. (D) A schematic showing the action modes of MWCNT-COOH and MWCNT 41. MWCNT-COOH suppresses the phosphorylation of mTOR. This action inhibits the phosphorylation of the substrate p70S6K and therefore releases its suppression on autophagy. MWCNT 41 activates autophagy by another pathway. Question marks indicated unknown mechanism.
Sometimes autophagy is induced when cells were under survival pressure such as cell apoptosis.11 To test this possibility, we examined whether the two MWCNTs induced apoptosis. Comparing with the cells treated with cell culture medium, MWCNT-treated cells showed no significant increase in early apoptosis, late apoptosis, or necrosis (Figure 8A). We then further investigated the activation of the apoptosis signaling at the molecular level. Apoptosis is a programmed cell death process controlled by a caspase signaling cascade. Caspase 3 is its central effector, the cleavage of which indicates the execution of apoptosis. Therefore, we analyzed the caspase 3 cleavege by Western blot. Consistent with the flow cytometry data, the cleaved caspase 3 was not detected (Figure 8B). Our data showed that MWCNTs did not induce apoptosis in HEK 293 cells at the conditions when autophagy was detected. Thus, we ruled out the possibility that the MWCNT-induced autophagy was a mere reaction to survival pressure.
Figure 8.

Lack of MWCNT-induced cell apoptosis. (A) After incubation with MWCNT-COOH or MWCNT 41 (100 µg/mL, 24 h), HEK293 cells were treated with annexin V PE and 7-AAD and analyzed by flow cytometry. Cells treated with culture medium or paclitaxel (100 nm) for 24h were used as negative and positive controls. (B) Procaspase 3 and cleaved caspase 3 were analyzed to detect the activation of apoptosis signaling. Cells treated with staurosporine (1 µM) for 24 h were used as positive control. β-Actin was used as loading control.
The differences in autophagy induction may reflect an alternate mode of interaction between the MWCNTs and the cells. Two MWCNTs may interact differently with cells, resulting in differing levels of cell internalization. To test this, we analyzed the amount of MWCNTs taken up by cells after labeling the MWCNTs with fluorescent FITC-BSA. Both MWCNTs exhibited a similar amount of cell uptake at various time points, indicating that the rate and the amount of cell uptake were similar for these MWCNTs (Figure S4, Supporting Information). We next examined the cell uptake by TEM and found that both MWCNTs were localized in identical cell organelles: endosomes, cytoplasm, autophagosomes, and lysosomes in addition to those bound to cell membranes (Figures 7 and 9). These results indicate that there is no difference in the amount of cell uptake and intracellular distribution of MWCNTs between MWCNT-COOH and MWCNT 41. Therefore, the differences in their autophagy induction mechanisms may be the result of unique interfacial interactions due to the different surface chemistries of the MWCNTs. A more likely explanation is that the two MWCNTs bind to different cell surface receptors because they are found membrane-bound before and after endocytosis (Figure 9 A, E).
Figure 9.

The subcellular localization of MWCNT in HEK 293 cells. After being treated with MWCNTs at 100 µg/mL for 4 h, HEK 293 cells are fixed and sectioned for TEM bobservation. The MWCNTs are localized in endosomes (A,E), cytoplasm (B,F), lysosomes (C,G) and binding to cell membrane (D,H). Scale bar indicates 500 nm. The upper panel is MWCNT-COOH, the lower panel is MWCNT 41.
MWCNT-COOH and MWCNT 41 May Bind to Different Cell Surface Receptors
We examined several possible explanations of the differences in autophagy induction between the two MWCNTs. Perturbation of calcium flux is an established mechanism for mTOR-independent autophagy induction.36 We first tested whether these two MWCNTs perturbed calcium flux differently. Our experimental data revealed that neither MWCNT altered calcium channel function (Figure S5, Supporting Information), suggesting that calcium flux perturbation is unlikely. Next, we speculated that induction of autophagy might alter gene expression profiles, particularly for those genes related to autophagy signaling. We then analyzed whether these two MWCNTs perturb autophagy-related genes using an autophagy specific PCR array of 84 autophagic genes. The mRNA expression levels of the 84 genes in HEK 293 cells after treatment with MWCNTs were compared to those in the same cells treated with cell culture medium (Table S3, Supporting Information). A change greater than 2-fold was considered biologically significant (Figure 10A,B and Table 1).
Figure 10.

MWCNT-COOH affects IGF-1 functions. Shattered plots of mRNA level of HEK 293 cells treated with MWCNT-COOH (A) or MWCNT 41 (B). (C) Bar chart of relative mRNA level of IGF1. (D) Immunoblot assay indicated that MWCNT-COOH, but not MWCNT 41, inhibits IGF-1 protein level. And MWCNT 41 inhibited IFNA2 more significantly than MWCNT-COOH. The gray intensity of the bands was quantified against GAPDH by ImageJ and labeled above each bands. (E) Current understanding of MWCNT-COOH induced autophagy. MWCNT-COOH induced mTOR dependent autophagy through blockade of IGF-1 expression. Green arrow means induction, red line means suppression, while dashed line indicates a pathway that needs further investigation.
TABLE 1.
MWCNT Induced Gene Expressions with Significant Alteration
| fold change
|
|||
|---|---|---|---|
| gene | CNT-COOH/medium | CNT-41/medium | CNT-41/CNT-COOH |
| IGF-1 | −2.08 | 1.20 | 2.50 |
| TNF | 2.11 | 1.05 | −2.01 |
| IFNA2 | −1.86 | −3.08 | −1.50 |
| IFNG | 7.75 | 1.05 | −7.40 |
| PIK3CG | 8.15 | 9.31 | 1.14 |
After treatment with MWCNT-COOH, IGF1 mRNA levels were downregulated by 2.08-fold compared to treatment with culture medium. However, after MWCNT 41 treatment, the expression level of IGF1 was almost unchanged (Table 1). Autophagy is a cellular response to environmental stress signals. Many transmembrane protein act as stress sensors at the cell membrane, such as insulin-like growth factor-1 (IGF-1) receptor.37 Deprivation of growth factors (including insulin and IGF-1) from the extracellular milieu releases the inhibitory effects of mTOR on autophagy by a series of signaling steps.38 MWCNT-COOH suppressed IGF-1 at both the mRNA and protein levels, while MWCNT 41 did not (Figure 10C,D). These findings suggest that MWCNT-COOH might block stress sensor proteins or interfere with their functions in detecting extracellular stress. Because MWCNTs tend to bind to cell membranes when they interact with cells, even after they are internalized in endosomes (Figure 9D), we propose that MWCNT-COOH functions by preventing signaling molecules from binding to the cell membrane receptors.39 Surface ligand modifications of MWCNT 41 altered its interactions with the cell and eliminated such effects.
The PCR array data indicated that many antiviral genes (such as IFNG, TNF) were upregulated in MWCNT-COOH-treated cells. Endotoxin levels from 0.5 to 50 EU/mL or higher may induce perturbations to immune functions,40 activation of related receptors,41 and expression of related genes.42,43 To test the possibility of MWCNT contamination, we examined the endo-toxin level in two solutions of MWCNTs using Limulus Amebocyte Lysate (LAL) method. Experiments showed that endotoxin concentration in both solutions was below 0.1 EU/mL. Ruling out the possibility of endotoxin contamination, the upregulation of these genes most likely indicated an immune perturbation by MWCNTs. Because autophagy might be induced by immune signaling molecules,44 immune perturbation by MWCNT-COOH might induce cell autophagy. By contrast, this perturbation was neutralized when cells were treated with MWCNT 41. Both IFNG and TNF mRNA levels returned to the same levels as in the medium control after MWCNT 41 treatment. Furthermore, the PCR array data revealed that the expression of IFNA2 (interferon alpha 2) was significantly reduced in cells treated with MWCNT 41 at both the mRNA and protein levels (Table 1 and Figure 10D) compared to the culture medium control. IFNA2 is an immune signaling cytokine with an antiviral function. The alteration of IFNA2 expression is often associated with certain pathogenic conditions. As a stress response machinery, autophagy plays a role in balancing immune responses.45 An early study showed that autophagy is needed to maintain IFNA2 levels during infection.46 We thus postulate that, after surface modification, MWCNT 41 may bind to IFNA2 receptors. Previous study showed that activation or inhibition of a specific receptor was able to up- or down-regulate the expression of the corresponding ligand.47 Binding to IFNA2 receptors may inhibit the expression of IFNA2 to such a level that autophagy is activated to balance this potential detrimental effect. However, the detailed signaling mechanism awaits further investigation (Figure 10E).
In brief, MWCNT-COOH decreased the expression of IGF-1 and increased immune perturbations to cells, thus leading to mTOR-dependent autophagy. However, surface-modified MWCNT 41 neutralized these effects but decreased the expression of IFNA2, leading to mTOR-independent autophagy.
CONCLUSIONS
To develop safe nanomaterials and potential nano-medicinal agents that regulate cell autophagy, we explored the possibility of controlling autophagy induction by systematically modifying the surface chemistry of MWCNTs. By analyzing autophagosome formation and autophagy-associated biomarkers, we have identified MWCNTs that yield strong autophagy induction or no autophagy induction. These findings demonstrate that potential pharmaceutical autophagy modulators and biocompatible nanomaterials can be developed through nanoparticle surface modifications. Differences in surface chemistry allow MWCNTs to trigger autophagy through different signaling pathways, demonstrating the flexibility and specificity of autophagy modulation by nanoparticles as a result of well-defined interactions with specific molecular signaling pathways.
MATERIALS AND METHODS
MWCNT Library Characterization and Endotoxin Detection
The MWCNT library was synthesized as described in our previous article. The TEM analysis of nanotubes were performed using JEOL 1200 EX Transmission Electron Microscope at 80 kV. The images were captured using an AMT 2k CCD camera. The length of the nanotubes was measured using Image Pro Plus 6.0.
For zeta potential analysis, selected MWCNTs were first diluted either in ultrapure water (18.2 MΩ) or in DMEM medium supplemented with 10% FBS to about 25 µg/mL, and their zeta potentials were measured by a laser particle size analyzer (Malvern Nano ZS, Malvern, UK).
To measure the trace metal impurities in MWCNTs, 1 mL of nitric acid was added to about 1 mg of MWCNTs in a Teflon digestion vessels. The MWCNTs were then digested at 200 °C for 45 min using a microwave by MARS (CEM Corp., Matthews, NC) microwave sample preparation system. The resulting solution was diluted to a proper concentration range and subjected to ICP-MS determination.
Each MWCNT (1.0 mg) was weighed and sterilized at 121 °C for 30 min. Next, 1 mL of complete cell culture medium was added, and the suspension was sonicated for 30 min. The resulting suspension (1 mg/mL) was diluted to the desired concentrations prior to use.
To determine the endotoxin level, MWCNT-COOH and MWCNT 41 were diluted to 100 µg/mL in PBS solution and incubated at 4°C for 72 h. After being centrifuged at 16000g for 30 min, the supernatant was subjected to endotoxin test using a Limulus Amebocyte Lysate (LAL) kit from Pierce. The levels of both MWCNT variants were below 0.1 EU/mL.
Reagents and Antibodies
Rapamycin (R8781), 3-methylade-nine (M9281), bafilomycin A1 (B1793), FITC-BSA (A9771) were purchased from Sigma-Aldrich (St Louis, MO, USA). Staurosporine (S1882), Fluo-3 AM (S1056) were purchased from Beyotime Institute of Biotechnology (Shanghai, China). Primary antibodies against LC3B (#2775), p-p70s6k (#9206), p70s6k (#9202), p-mTOR (#2974), mTOR (#2972) and GAPDH (#2118) were purchased from Cell Signaling (Boston, MA, USA). Primary antibodies against IGF-1 (AP14099b) and β-actin (AM1021b) were purchased from Abgent (San Diego, CA, USA). Primary antibody against procaspase 3 (sc-56046) and IFNA2 (sc-73305) was purchased from Santa Cruz (Santa Cruz, CA, USA). Primary antibody against cleaved-caspase 3 (YC0006) was purchased from Immunoway (Newark, DE, USA). Horseradish peroxidase (HRP)-conjugated secondary antibodies were purchased from Biorad (Richmond, CA, USA). PVDF membranes and the Western blot luminescence reagent and Guava Nexin Reagent were purchased from Millipore (MA, USA).
LC3-GFP U87 Cell Line
The LC3-GFP U87 cell line was constructed using the retroviral vector MSCV-IRES-LC3-GFP, which was kindly provided by Mr. Michael B. Kastan of the Molecular Oncology Department of St. Jude Children's Research Hospital. The vector contains a cDNA fragment corresponding to an autophagy-specific marker, LC3, which expresses an LC3-GFP fusion protein. The vector was transfected into the U87 cell line to produce the stable GFP-expressing LC3-reporting cell line LC3-GFP U87.
Cell Culture
The LC3-GFP U87, U87, and HEK 293 cell lines were cultured in DMEM (Gibco) culture medium supplemented with 10% fetal bovine serum (Gibco), 100 U/mL of penicillin, and 100 µg/mL of stremycin (Gibco) at 37 °C with 5% CO2. Cells at 80% confluence were trypsinized and counted for each experiment. The HEK 293 cell lines were used between passage 5 and 10.
Quantification of Autophagosomes
The LC3-GFP U87 reporter cells were seeded in confocal dishes and fixed with 4% paraformaldehyde. Laser scanning confocal microscopy (LSM 700, Zeiss, Germany) was used to acquire fluorescent images of cells. To quantify cell autophagy induction, the number of bright punctuates (autophagosomes) was counted in at least 30 cells. Three independent experiments were carried out.
Immunoblotting
After treatment, cells were harvested and lysed in the cell extraction buffer (Invitrogen, FNN0011) supplemented with proteasome inhibitor (P2714, Sigma) and 1 mM phenylmethanesulfonyl fluoride (PMSF). Equal amounts (20 µg) of protein were loaded onto SDS-PAGE for separation and then transferred onto a PVDF membrane. The membrane was blocked with 5% w/v nonfat dry milk (in TBS with 0.05% Tween-20). After incubation with the specific primary antibody (1:1000,5% nonfat dry milk or BSA in TBS with 0.05% Tween-20) at 4 °C overnight, the membrane was washed three times with TBST (TBS with 0.05% Tween-20) solution. The membrane was then incubated with secondary antibody (1:5000, in 5% nonfat dry milk, TBS with 0.05% Tween-20) at room temperature for 1 h followed by another three washes with TBST. The protein bands were developed by incubation with a luminescent reagent. ImageJ was used to quantify the band intensity.
Phospho-p70S6k Substrate Assay
Briefly, after incubating HEK 293 cells with two MWCNT variants at the concentration of 100, 50,25 µg/mL for 24 h, cells were harvested, and equal amounts of total proteins were subjected for Western blot analysis against phosphor-p70S6K and phosphor-mTOR antibodies. β-Actin was used as a loading control.
PCR Array Analysis
After incubation with MWCNTs for 24 h, the HEK 293 cells were lysed with Trizol (Invitrogen, CA, USA), followed by mRNA extraction. Approximately 1.5 µg of mRNA was used for cDNA synthesis by Superscript III (Invitrogen, CA, USA). The cDNA was then added to the wells of an autophagy-specific PCR array plate (PAHS-084A, Qiagen). Each well (84 in all) contained an autophagy-specific gene primer mix and another five wells of housekeeping genes as controls. The PCR plate was then subjected to a two-step RT2 PCR program (95 °C for 15 s, 60 °C for 60s). The expression of 84 autophagy-specific genes was quantified by the ΔΔCt method.
Cellular Uptake
1.0 mg of MWCNT-COOH or MWCNT 41 was dispersed in ultrapure water under sonication. The mixture solutions were then centrifuged at 16000g for 30 min to remove large aggregates. Then equal amount of MWCNTs solution and FITC-BSA solution were mixed and incubated overnight. The resulting solutions were then centrifuged at 16000g for 30 min to remove the unbound FITC-BSA. The pellet was then washed for three times and dispersed in DPBS. The concentration of the MWCNT solution was then quantified by measuring the adsorption at 260 nm. The fluorescent intensity of FITC-BSA bind MWCNT was measured by a fluorescence spectrometer (488/535 nm). The ratio between fluorescence intensity and MWCNT concentration was defined as FITC-BSA binding ratio. MWCNTs were then dispersed in full DMEM culture medium to form a final concentration of 50 µg/mL. After being incubated with HEK 293 cells for 05,2,4,12, 24 h, cells were washed and collected by trypsin. Well dispersed cell solution was subjected to flow cytometry analysis.
Calcium Flux Analysis
HEK 293 cells were treated with MWCNT-COOH or MWCNT 41 at indicated concentration for 24 h. Cells were then carefully washed with DPBS for three times and collected through trypsin digestion (free of EDTA). Next, cells were loaded with 10 µM fluorescent dye Fluo-3 AM in basic DMEM medium and kept in dark at room temperature for 1 h and then at 37 °C for 30 min. Cells were then washed by centrifugation for 3 times and suspended in DPBS and subjected to flow cytometry analysis. The mean fluorescence intensity of the green fluorescence channel was collected.
I dentification of MWCNT Bound Proteins by LC-MS/MS
MWCNTs (100 µg/mL) were incubated with 10% fetal bovine serum (Hyclone) in PBS at 4 h overnight. The mixture solution was washed by centrifugation at 16000g for 30 min for 3 times. The pellet was collected and digested with trypsin enzyme for 12 h at 37 °C to retrieve the MWCNT bound proteins. The resulting peptide solution was then subjected to LC–MS/MS analysis. Product ions generated by fragmentation along the peptide backbone by collision activated dissociation (CAD) were used in an automated database search against the Swissprot database using Mascot search routine.
Supplementary Material
Acknowledgments
We thank Dr. Hongyu Zhou for providing surface-modified MWCNTs. This work was supported by the National Basic Research Program of China (973 Program 2010CB933504) and National Natural Science Foundation of China (21137002 and 21077068).
Footnotes
Conflict of Interest: The authors declare no competing financial interest.
Supporting Information Available: Additional data on carbon nanotube characterization and investigation. This material is available free of charge via the Internet at http://pubs.acs.org.
References
- 1.He C, Klionsky DJ. Regulation Mechanisms and Signaling Pathways of Autophagy. Annu. Rev. Genet. 2009;43:67–93. doi: 10.1146/annurev-genet-102808-114910. [DOI] [PMC free article] [PubMed] [Google Scholar]
- 2.Lipinski MM, Hoffman G, Ng A, Zhou W, Py BF, Hsu E, Liu X, Eisenberg J, Liu J, Blenis J, et al. A Genome-Wide siRNA Screen Reveals Multiple mTORC1 Independent Signaling Pathways Regulating Autophagy under Normal Nutritional Conditions. Dev. Cell. 2010;18:1041–1052. doi: 10.1016/j.devcel.2010.05.005. [DOI] [PMC free article] [PubMed] [Google Scholar]
- 3.Høyer-Hansen M, Bastholm L, Szyniarowski P, Campanella M, Szabadkai G, Farkas T, Bianchi K, Fehrenbacher N, Elling F, Rizzuto R, et al. Control of Macroautophagy by Calcium, Calmodulin-Dependent Kinase Kinase-β, and Bcl-2. Mol. Cell. 2007;25:193–205. doi: 10.1016/j.molcel.2006.12.009. [DOI] [PubMed] [Google Scholar]
- 4.Vellai T. Autophagy Genes and Ageing. Cell Death Differ. 2008;16:94–102. doi: 10.1038/cdd.2008.126. [DOI] [PubMed] [Google Scholar]
- 5.Mizushima N, Hara T. Intracellular Quality Control by Autophagy: How Does Autophagy Prevent Neurodegeneration? Autophagy. 2006;2:302–304. doi: 10.4161/auto.2945. [DOI] [PubMed] [Google Scholar]
- 6.Qu X, Yu J, Bhagat G, Furuya N, Hibshoosh H, Troxel A, Rosen J, Eskelinen E-L, Mizushima N, Ohsumi Y, et al. Promotion of Tumorigenesis by Heterozygous Disruption of the Beclin 1 Autophagy Gene. J. Clin. Invest. 2003;112:1809–1820. doi: 10.1172/JCI20039. [DOI] [PMC free article] [PubMed] [Google Scholar]
- 7.Öst A, Svensson K, Ruishalme I, Brännmark C, Franck N, Krook H, Sandström P, Kjolhede P, Strålfors P. Attenuated mTOR Signaling and Enhanced Autophagy in Adipocytes from Obese Patients with Type 2 Diabetes. Mol. Med. 2010;16:235. doi: 10.2119/molmed.2010.00023. [DOI] [PMC free article] [PubMed] [Google Scholar]
- 8.Liao X, Sluimer JC, Wang Y, Subramanian M, Brown K, Pattison JS, Robbins J, Martinez J, Tabas I. Macrophage Autophagy Plays a Protective Role in Advanced Atherosclerosis. Cell Metab. 2012;15:545–553. doi: 10.1016/j.cmet.2012.01.022. [DOI] [PMC free article] [PubMed] [Google Scholar]
- 9.Lynch-Day MA, Mao K, Wang K, Zhao M, Klionsky DJ. The Role of Autophagy in Parkinson’s Disease. Cold Spring Harbor Perspect. Med. 2012:2. doi: 10.1101/cshperspect.a009357. [DOI] [PMC free article] [PubMed] [Google Scholar]
- 10.White E, Karp C, Strohecker AM, Guo Y, Mathew R. Role of Autophagy in Suppression of Inflammation and Cancer. Curr. Opin. Cell Biol. 2010;22:212–217. doi: 10.1016/j.ceb.2009.12.008. [DOI] [PMC free article] [PubMed] [Google Scholar]
- 11.Maiuri MC, Zalckvar E, Kimchi A, Kroemer G. Self-Eating and Self-Killing: Crosstalk between Autophagy and Apoptosis. Nat. Rev. Mol. Cell Biol. 2007;8:741–752. doi: 10.1038/nrm2239. [DOI] [PubMed] [Google Scholar]
- 12.Wu L, Yan B. Discovery of Small Molecules that Target Autophagy for Cancer Treatment. Curr. Med. Chem. 2011;18:1866–1873. doi: 10.2174/092986711795496773. [DOI] [PubMed] [Google Scholar]
- 13.Fleming A, Noda T, Yoshimori T, Rubinsztein DC. Chemical Modulators of Autophagy as Biological Probes and Potential Therapeutics. Nat. Chem. Biol. 2011;7:9–17. doi: 10.1038/nchembio.500. [DOI] [PubMed] [Google Scholar]
- 14.Man N, Yu S-H. Rare Earth Oxide Nanocrystals as a New Class of Autophagy Inducers. Autophagy. 2010;6:310–311. doi: 10.4161/auto.6.2.11138. [DOI] [PubMed] [Google Scholar]
- 15.Stern ST, Zolnik BS, McLeland CB, Clogston J, Zheng J, McNeil SE. Induction of Autophagy in Porcine Kidney Cells by Quantum Dots: A Common Cellular Response to Nanomaterials? Toxicol. Sci. 2008;106:140–152. doi: 10.1093/toxsci/kfn137. [DOI] [PMC free article] [PubMed] [Google Scholar]
- 16.Stern S, Adiseshaiah P, Crist R. Autophagy and Lysosomal Dysfunction as Emerging Mechanisms of Nanomaterial Toxicity. Part. Fibre Toxicol. 2012;9:20. doi: 10.1186/1743-8977-9-20. [DOI] [PMC free article] [PubMed] [Google Scholar]
- 17.Seleverstov O, Zabirnyk O, Zscharnack M, Bulavina L, Nowicki M, Heinrich J-M, Yezhelyev M, Emmrich F, O’Regan R, Bader A. Quantum Dots for Human Mesenchymal Stem Cells Labeling. A Size-Dependent Autophagy Activation. Nano Lett. 2006;6:2826–2832. doi: 10.1021/nl0619711. [DOI] [PubMed] [Google Scholar]
- 18.Zhang Y, Zheng F, Yang T, Zhou W, Liu Y, Man N, Zhang L, Jin N, Dou Q, Zhang Y, et al. Tuning the Autophagy-Inducing Activity of Lanthanide-Based Nano-crystals through Specific Surface-Coating Peptides. Nat. Mater. 2012;11:817–826. doi: 10.1038/nmat3363. [DOI] [PubMed] [Google Scholar]
- 19.Gao N, Zhang Q, Mu Q, Bai Y, Li L, Zhou H, Butch ER, Powell TB, Snyder SE, Jiang G, et al. Steering Carbon Nanotubes to Scavenger Receptor Recognition by Nano-tube Surface Chemistry Modification Partially Alleviates NFκB Activation and Reduces Its Immunotoxicity. ACS Nano. 2011;5:4581–4591. doi: 10.1021/nn200283g. [DOI] [PMC free article] [PubMed] [Google Scholar]
- 20.Zhou H, Mu Q, Gao N, Liu A, Xing Y, Gao S, Zhang Q, Qu G, Chen Y, Liu G, et al. A Nano-Combinatorial Library Strategy for the Discovery of Nanotubes with Reduced Protein-Binding, Cytotoxicity, and Immune Response. Nano Lett. 2008;8:859–865. doi: 10.1021/nl0730155. [DOI] [PubMed] [Google Scholar]
- 21.Liu Z, Cai W, He L, Nakayama N, Chen K, Sun X, Chen X, Dai H. In Vivo Biodistribution and Highly Efficient Tumour Targeting of Carbon Nanotubes in Mice. Nat. Nanotechnol. 2007;2:47–52. doi: 10.1038/nnano.2006.170. [DOI] [PubMed] [Google Scholar]
- 22.Ma X, Wu Y, Jin S, Tian Y, Zhang X, Zhao Y, Yu L, Liang X-J. Gold Nanoparticles Induce Autophagosome Accumulation through Size-Dependent Nanoparticle Uptake and Lysosome Impairment. ACS Nano. 2011;5:8629–8639. doi: 10.1021/nn202155y. [DOI] [PubMed] [Google Scholar]
- 23.Yu L, Lu Y, Man N, Yu S-H, Wen L-P. Rare Earth Oxide Nanocrystals Induce Autophagy in HeLa Cells. Small. 2009;5:2784–2787. doi: 10.1002/smll.200901714. [DOI] [PubMed] [Google Scholar]
- 24.Liu HL, Zhang YL, Yang N, Zhang YX, Liu XQ, Li CG, Zhao Y, Wang YG, Zhang GG, Yang P, et al. A Functionalized Single-Walled Carbon Nanotube-Induced Autophagic Cell Death in Human Lung Cells through Akt-TSC2-mTOR Signaling. Cell Death Dis. 2011;2:e159. doi: 10.1038/cddis.2011.27. [DOI] [PMC free article] [PubMed] [Google Scholar]
- 25.Su G, Yan B. Nano-Combinatorial Chemistry Strategy for Nanotechnology Research. J. Comb. Chem. 2010;12:215–221. doi: 10.1021/cc900193g. [DOI] [PubMed] [Google Scholar]
- 26.Zhang B, Pai Panandiker A, Yan B. A Nano-Combinatorial Approach to Developing Cancer Diagnostics: Nano-Combinatorial Diagnostics Discovery. Nanomedicine. 2012;7:937–940. doi: 10.2217/nnm.12.64. [DOI] [PubMed] [Google Scholar]
- 27.Dukhande V, Malthankar-Phatak G, Hugus J, Daniels C, Lai JK. Manganese-Induced Neurotoxicity Is Differentially Enhanced by Glutathione Depletion in Astrocytoma and Neuroblastoma Cells. Neurochem. Res. 2006;31:1349–1357. doi: 10.1007/s11064-006-9179-7. [DOI] [PubMed] [Google Scholar]
- 28.Klionsky DJ, Abdalla FC, Abeliovich H, Abraham RT, Acevedo-Arozena A, Adeli K, Agholme L, Agnello M, Agostinis P, Aguirre-Ghiso JA, et al. Guidelines for the Use and Interpretation of Assays for Monitoring Autophagy. Autophagy. 2012;8:445–544. doi: 10.4161/auto.19496. [DOI] [PMC free article] [PubMed] [Google Scholar]
- 29.Zhang Y, Bai Y, Yan B. Functionalized Carbon Nanotubes for Potential Medicinal Applications. Drug Discovery Today. 2010;15:428–435. doi: 10.1016/j.drudis.2010.04.005. [DOI] [PMC free article] [PubMed] [Google Scholar]
- 30.Ravikumar B, Futter M, Jahreiss L, Korolchuk VI, Lichtenberg M, Luo S, Massey DCO, Menzies FM, Narayanan U, Renna M, et al. Mammalian Macroautophagy at a Glance. J. Cell Sci. 2009;122:1707–1711. doi: 10.1242/jcs.031773. [DOI] [PMC free article] [PubMed] [Google Scholar]
- 31.Wang X, Proud CG. mTORC1 Signaling: What We Still Don’t Know. J. Mol. Cell Biol. 2011;3:206–220. doi: 10.1093/jmcb/mjq038. [DOI] [PubMed] [Google Scholar]
- 32.Mizushima N, Levine B, Cuervo A, Klionsky D. Autophagy Fights Disease through Cellular Self-Digestion. Nature. 2008;451:1069–1075. doi: 10.1038/nature06639. [DOI] [PMC free article] [PubMed] [Google Scholar]
- 33.Lu Y, Zhang L, Li J, Su Y-D, Liu Y, Xu Y-J, Dong L, Gao H-L, Lin J, Man N, et al. MnO Nanocrystals: A Platform for Integration of MRI and Genuine Autophagy Induction for Chemotherapy. Adv. Funct. Mater. 2013;23:1534–1546. [Google Scholar]
- 34.Rubinsztein DC, Cuervo AM, Ravikumar B, Sarkar S, Korolchuk VI, Kaushik S, Klionsky DJ. In Search of an “Autophagomometer”. Autophagy. 2009;5:585–589. doi: 10.4161/auto.5.5.8823. [DOI] [PubMed] [Google Scholar]
- 35.Liu EY, Ryan KM. Autophagy and Cancer—Issues We Need to Digest. J. Cell Sci. 2012;125:2349–2358. doi: 10.1242/jcs.093708. [DOI] [PubMed] [Google Scholar]
- 36.Lok C-N, Sy L-K, Liu F, Che C-M. Activation of Autophagy of Aggregation-Prone Ubiquitinated Proteins by Timosaponin A-III. J. Biol. Chem. 2011;286:31684–31696. doi: 10.1074/jbc.M110.202531. [DOI] [PMC free article] [PubMed] [Google Scholar]
- 37.Shaw WM, Luo S, Landis J, Ashraf J, Murphy CT. The C. elegans TGF-β Dauer Pathway Regulates Longevity via Insulin Signaling. Curr. Biol. 2007;17:1635–1645. doi: 10.1016/j.cub.2007.08.058. [DOI] [PMC free article] [PubMed] [Google Scholar]
- 38.Kanazawa T, Taneike I, Akaishi R, Yoshizawa F, Furuya N, Fujimura S, Kadowaki M. Amino Acids and Insulin Control Autophagic Proteolysis through Different Signaling Pathways in Relation to mTOR in Isolated Rat Hepatocytes. J. Biol. Chem. 2004;279:8452–8459. doi: 10.1074/jbc.M306337200. [DOI] [PubMed] [Google Scholar]
- 39.Zhang Y, Mu Q, Zhou H, Vrijens K, Roussel MF, Jiang G, Yan B. Binding of Carbon Nanotube to BMP Receptor 2 Enhances Cell Differentiation and Inhibits Apoptosis via Regulating bHLH Transcription Factors. Cell Death Dis. 2012;3:e308. doi: 10.1038/cddis.2012.48. [DOI] [PMC free article] [PubMed] [Google Scholar]
- 40.Guidance for Industry: Pyrogen and Endotoxins Testing: Questions and Answers. U.S. Food and Drug Administration; Silver Spring, MD: 2012. [Google Scholar]
- 41.Yang R-B, Mark MR, Gray A, Huang A, Xie MH, Zhang M, Goddard A, Wood WI, Gurney AL, Godowski PJ. Toll-Like Receptor-2 Mediates Lipopolysaccharide-Induced Cellular Signalling. Nature. 1998;395:284–288. doi: 10.1038/26239. [DOI] [PubMed] [Google Scholar]
- 42.Kapadia S, Lee J, Torre-Amione G, Birdsall HH, Ma TS, Mann DL. Tumor Necrosis Factor-Alpha Gene and Protein Expression in Adult Feline Myocardium after Endotoxin Administration. J. Clin. Invest. 1995;96:1042. doi: 10.1172/JCI118090. [DOI] [PMC free article] [PubMed] [Google Scholar]
- 43.Doherty G, Lange J, Langstein H, Alexander H, Buresh C, Norton J. Evidence for IFN-Gamma as a Mediator of the Lethality of Endotoxin and Tumor Necrosis Factor-Alpha. J. Immunol. 1992;149:1666–1670. [PubMed] [Google Scholar]
- 44.Kroemer G, Mariño G, Levine B. Autophagy and the Integrated Stress Response. Mol. Cell. 2010;40:280–293. doi: 10.1016/j.molcel.2010.09.023. [DOI] [PMC free article] [PubMed] [Google Scholar]
- 45.Levine B, Mizushima N, Virgin HW. Autophagy in Immunity and Inflammation. Nature. 2011;469:323–335. doi: 10.1038/nature09782. [DOI] [PMC free article] [PubMed] [Google Scholar]
- 46.Lee HK, Lund JM, Ramanathan B, Mizushima N, Iwasaki A. Autophagy-Dependent Viral Recognition by Plasmacytoid Dendritic Cells. Science. 2007;315:1398–1401. doi: 10.1126/science.1136880. [DOI] [PubMed] [Google Scholar]
- 47.Miyazaki Y, Hiraoka S, Tsutsui S, Kitamura S, Shinomura Y, Matsuzawa Y. Epidermal Growth Factor Receptor Mediates Stress-Induced Expression of Its Ligands in Rat Gastric Epithelial Cells. Gastroenterology. 2001;120:108–116. doi: 10.1053/gast.2001.20950. [DOI] [PubMed] [Google Scholar]
Associated Data
This section collects any data citations, data availability statements, or supplementary materials included in this article.