

Abstract
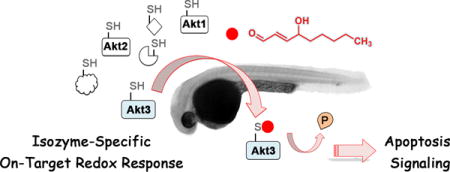
Isozyme-specific posttranslational regulation fine-tunes signaling events. However, sequence/activity redundancy renders links between isozyme-specific modifications and downstream functions uncertain. Methods to study this phenomenon are underdeveloped. A redox-targeting screen unveiled Akt3 as a first-responding isozyme sensing native electrophilic lipids. Electrophile modification of Akt3 modulated downstream pathway responses in cells and Danio rerio (zebrafish) and markedly differed from Akt2-specific oxidative regulation. Digest MS sequencing identified Akt3(C119) as the privileged cysteine that senses 4-hydroxynonenal. The Akt3(C119S) mutant was hypomorphic for all downstream phenotypes shown by wild-type Akt3. The study documents isozyme-specific and chemical redox signal-personalized physiologic responses.
Graphical abstract
Introduction
At the outset of kinase inhibitor discovery programs, substantial worry was levied towards concern that commonalities in terms of substrate and high concentration of endogenous ligands would render selective and effective inhibition near impossible. It is thus a huge testament to the importance of kinase signaling in health and disease that kinases are now considered inherently druggable1 and more than 30% of drug discovery programs target these enzymes2. However, despite these huge triumphs, hurdles remain to be overcome. One inherently challenging task pertains to regulation of specific kinase isozymes, both artificially through drug discovery and naturally through endogenous signaling cues. Mounting evidence indicates that isoform-specific deregulation drives specific tumor phenotypes3–5, highlighting the importance of understanding precise contributions and extent of compensation or redundancies among kinase isoforms in physiologically relevant settings.
Recognizing the significant challenges in designing isoform-specific inhibitors3, innovative work has recently dialed in isoform specificity to a promiscuous inhibitor using an ectopic fusion protein and a chimeric ligand in a method dubbed “BOLT”6 (within the Class Ib bifunctional scaffolding chemical tools in the field of proximity enhancement7). However, in humans >10 protein species are derived from one gene on average8 with added functional diversities stemming from posttranslational modifications and differential interactomes9. Thus the physiologic interplay between isozyme-specific posttranslational modifications and cellular activities remains poorly defined. In terms of post-translational modifications, this issue can be traced to the lack of tools to surgically perturb specific kinase isoforms in cells that, together with high homology across the isoforms, render identification of isoform-specific modifications a formidable undertaking. The complexity is magnified when non-enzymatic post-translational modifications (nE-PTMs) are considered. This is because nE-PTMs are difficult to control experimentally and can be target-protein specific but residue-site non-specific10,11. These intricacies render nE-PTMs not amenable to traditional methods of interrogation such as mutagenesis or targeted knockdown.
Here we used the endogenous reactive lipid-derived signaling molecule, 4-hydroxynonenal (HNE)12–14, as a native electrophilic signal to investigate the “on-target” spectrum and precise ramifications of electrophilic signaling with respect to specific kinase isoforms. From this medium-throughput screen, we identified Akt3 as a privileged sensor of HNE. MS analysis identified that Cys119—not conserved among the three Akt isozymes—was responsible for unique HNE-sensing capability of Akt3, and conversion of this residue to serine ablated sensing activity. Functional downstream assays in both cultured cells and zebrafish Danio rerio showed that relative to the C119S mutant, HNEylation of wt-Akt3 at C119 inhibited Akt3 kinase activity, and modulated downstream signaling.
Results
T-REX screen identifies Akt3 as a privileged sensor
We first established a robust user-controlled redox-targeting platform— compatible with cultured cells and ultimately zebrafish—which allowed identification of individual proteins that can react rapidly with endogenous reactive lipid-derived electrophiles (LDEs) such as HNE12–14 under native settings. Because of the transient nature of HNE, proteins that score positive in the screen are likely “first responders” to the native reactive signal. These important enzymes are a privileged class of sensors that due to their favorable association kinetics are able to sense LDE signals and modulate specific signaling pathways prior to negative impacts of electrophilic stress. Much of the screening set was selected based on literature evidence for HNE-sensing capacity from bolus dosing methods. The screen itself employed T-REX15—a method in which HaloTag fusion to a protein of interest (POI) facilitates covalent conjugation between HaloTag and small-molecule photocaged precursors to reactive LDE signals such that subsequent light-driven uncaging releases a brief and defined “pulse” of a reactive endogenous LDE signal in the microenvironment of the HaloTagged POI10,11,15,16. Provided the POI can react rapidly with the liberated LDE, the LDE will label the POI (Fig. 1a), and a follow-up gel-based quantitation11,15 reports on the extent of on-target LDE modifications on the POI. This approach circumvents a common problem in the identification of genuine “first responders” because these privileged sensors are often lost in the noise created by the slower accumulation of off-target modifications of highly abundant and slow-reacting isozymes during prolonged bolus dosing with excess reactive LDE signals. T-REX combined with the commercial availability of Halo ORFeome library makes screening of potential electrophilic sensors simple (Supplementary Results, Supplementary Fig. 1).
Figure 1. Akt3 is a first-responding isozyme to reactive native lipid signals.
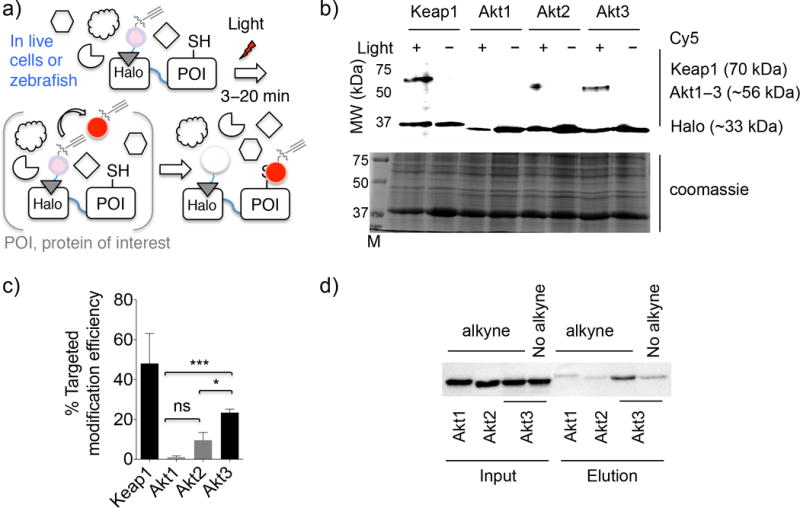
(a) T-REX on-demand redox targeting involves light-driven liberation of LDE signal (red dot) in substoichiometric amounts from a photocaged precursor covalently bound to HaloTag. Class II proximity enhancement7 enables targeted covalent modification of protein of interest (POI; genetically fused to HaloTag) by specific LDEs. Light source: 365 nm, 0.3 mW/cm2 hand-held UV-lamp placed at 1-inch above samples (3–20 min in cells15 or fish embryos). (b) T-REX screen (Supplementary Fig. 1) and validation identified Akt3 to be a first HNE-responder. Keap1 was used for comparison. Top: Cy5 channel; Bottom: Cy5 signal from samples treated with or without light, followed by TEV-protease treatment. M designates MW (molecular weight)-ladder. See Supplementary Fig. 2a for full gels. (c) Quantitation: the Cy5 signal intensity on the band corresponding to POI MW in the samples exposed to light was normalized by the signal intensity on Halo on the corresponding samples not exposed to light. Error bars designate s.d. (Keap1, n =4; Akt1, Akt2, and Akt3, n = 3 independent biological replicates). (d) Orthogonal validation using Click coupling with biotin-azide followed by streptavidin enrichment subsequent to T-REX-enabled targeted-HNE(alkyne)-modification in live cells. “No alkyne” corresponds to probe that had no-alkyne functionalization (Supplementary Fig. 1b), controlling for any non-specific binding/biotinylation. See Supplementary Fig. 2b for a full blot.
Akt3(C119) is a privileged HNE sensor
The screen pinpointed two isoforms of serine/threonine protein kinase, Akt2 and Akt317,18 as the most responsive sensors from the panel (Supplementary Fig. 1a). A secondary validation by two independent methods: in-gel fluorescence (Fig. 1a–c and Supplementary Fig. 2a) and biotin pulldown (Fig. 1d and Supplementary Fig. 2b) both validated Akt3 as a highly efficient electrophile sensor. Akt2 was less responsive to HNE whereas Akt1 was unreactive (Fig. 1b–d, Supplementary Fig. 1a). We next evaluated the specific residue of Akt3 targeted by HNE in cells. Enrichment followed by LC-MS/MS identified C119 as the residue selectively modified by HNE (Fig. 2 and Supplementary Tables 1–3).
Figure 2. C119 of Akt3 is the unique HNE-sensing residue.
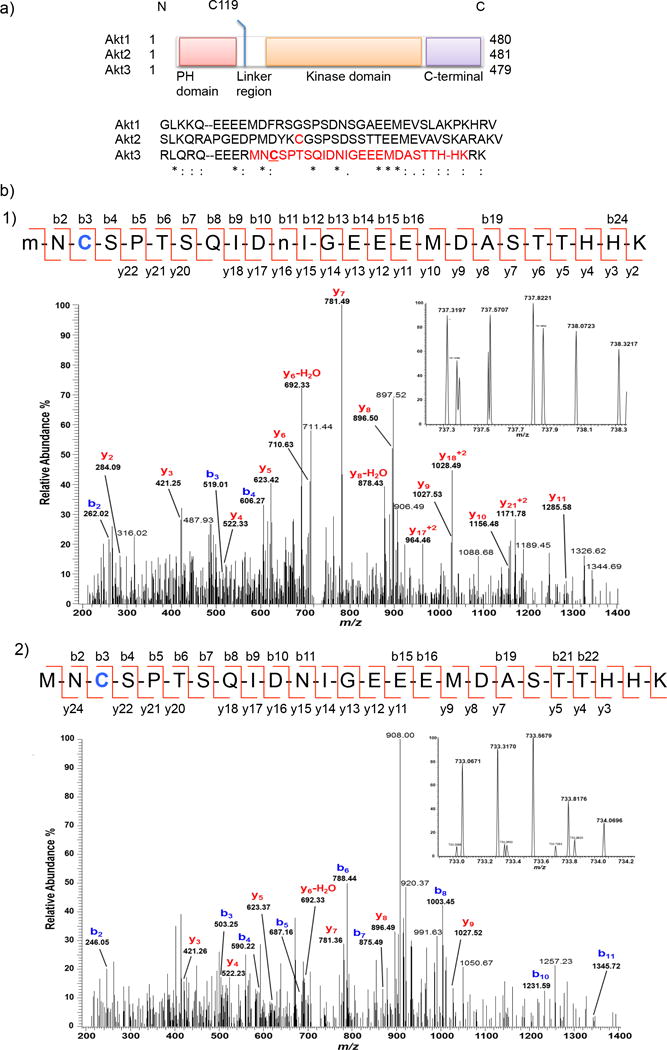
(a) Domain composition of Akt isoforms: the linker region displays the highest divergence in amino acid sequence (shown) among the three isozymes. C124 of Akt2 (in red) is sensitive to H2O219. We identified C119 (underlined) of Akt3 to be the site of HNE(alkyne)-modification on the tryptic peptide shown in red (also see Supplementary Fig. 3). (b) MS/MS Spectra of quadruply-charged ions at m/z 737.31974+ (Panel-1) and m/z 737.06714+ (Panel-2) identify an HNE-modified peptide at C119 residue from Akt3 protein. Although y-ion series in the spectra do not cover the C119 modification, the b-ion series in each MS/MS spectrum along with the high accurate mass (<5 ppm) of the precursor ion (see inset for the MS spectrum) provide a confident identification of C119 modification with reduced HNE-alkyne (+154.1 Da). An additional oxidation on M1 residue and a deamidation on N11 residue (indicated by lower-case m and n) were identified in the peptide (Panel-1). See Supplementary Table 2–3.
C119, located in the linker domain, is unique to Akt3 among the three isozymes based on the sequence alignment (Fig. 2a and Supplementary Fig. 3). The cysteine and its neighboring residues are also conserved in mice Akt3 and zebrafish Akt3 (Supplementary Fig. 3a). By means of comparison, C124 of Akt2 resides in the same linker region but is prone to sulfenylation as a result of PDGF-induced reactive oxygen species (ROS) generation19. Substoichiometric C124 oxidation inhibits Akt2 kinase activity19. Notably, the C124 within Akt2 is not conserved in fish (Supplementary Fig. 3b), indicating that HNE signaling on Akt3 may be the more general regulatory mechanism. By contrast, unlike Akt2 and Akt3, the linker sequence of Akt1 lacks any cysteine residue, likely explaining why Akt1 was completely unresponsive to HNE. These data together suggest Akt isoforms have evolved to sense distinct native redox signals presumably by diversifying or acquiring new function within their linker regions. This would further imply that tissue-specific expression of Akt isoforms would reflect different stressors common to those specific locales. Akt2 is widely known to be critical in glucose homeostasis: Akt3 plays a role in brain development and glioma progression20,21. It is likely that the prevalence of poly-unsaturated fatty acids and their lipid peroxidation products in the brain22,23 may have led evolution to select for Akt3 to be responsive to LDE signals such as HNE, whereas mitochondrial- and growth factor signaling-related ROS production may select Akt2 for redox sensing in the realms of PDGF-induced glucose uptake mechanisms19 (Fig. 2a and Supplementary Fig. 3).
We proceeded to characterize the Akt3(C119S) mutant. When T-REX redox-targeting experiments were replicated in cells expressing Halo-Akt3(C119S), the HNE-sensing ability was substantially reduced (Supplementary Fig. 4a). The C119S mutant was expressed as strongly as Akt3 wild type (wt) or Akt2, and the mutant primarily localized to cytosol similarly to wt Akt3 (Supplementary Fig. 4b–c). Since C119S mutant is correctly regulated and stable, we conclude that C119 is the unique LDE sensor residue on Akt3.
HNEylation downregulates Akt3 kinase activity
One of the key benefits of T-REX is that downstream signaling ramifications caused by specific LDE modifications of sensitive proteins can be assayed easily. Akt3(C119S)—the mutant hypomorphic for HNE-delivery—served as an ideal ‘negative control’, enabling better dissection of on-target redox responses from off-target effects. We used a known ratiometric FRET-based “AktAR” biosensor24 (Fig. 3a) that measures Akt activity directly and can detect relatively small changes in Akt activity. Briefly, the biosensor construct constitutes a CFP/YFP-FRET-pair separated by a linker region that integrates a substrate peptide sequence favored by all Akt isoforms and a FHA2-protein-binding domain. This latter domain binds selectively to the phosphorylated substrate peptide. Co-expression of the individual HaloTagged Akt2 and Akt3 (both wt and C119S) with the reporter resulted in increased FRET from CFP to YFP relative to an empty vector (Supplementary Fig. 5a–b), validating activity of the expressed proteins. Consistent with the protein labeling assay data above (Fig. 1 and Supplementary Fig. 1, 4a), Akt3 HNEylation led to a decrease in FRET signal relative to controls (Fig. 3b–d), indicating a reduction in Akt3 activity. 25 μM Ht-PreHNE introduced artifactual increase in YFP emission prior to light shining, although inhibition of kinase signaling could still be read out by a drop in YFP/CFP ratio upon T-REX. The issue was eliminated by using lower Ht-PreHNE concentrations (Fig. 3 and Supplementary Fig. 5c).
Figure 3. Lipid signals downregulate Akt3 kinase activity selectively.
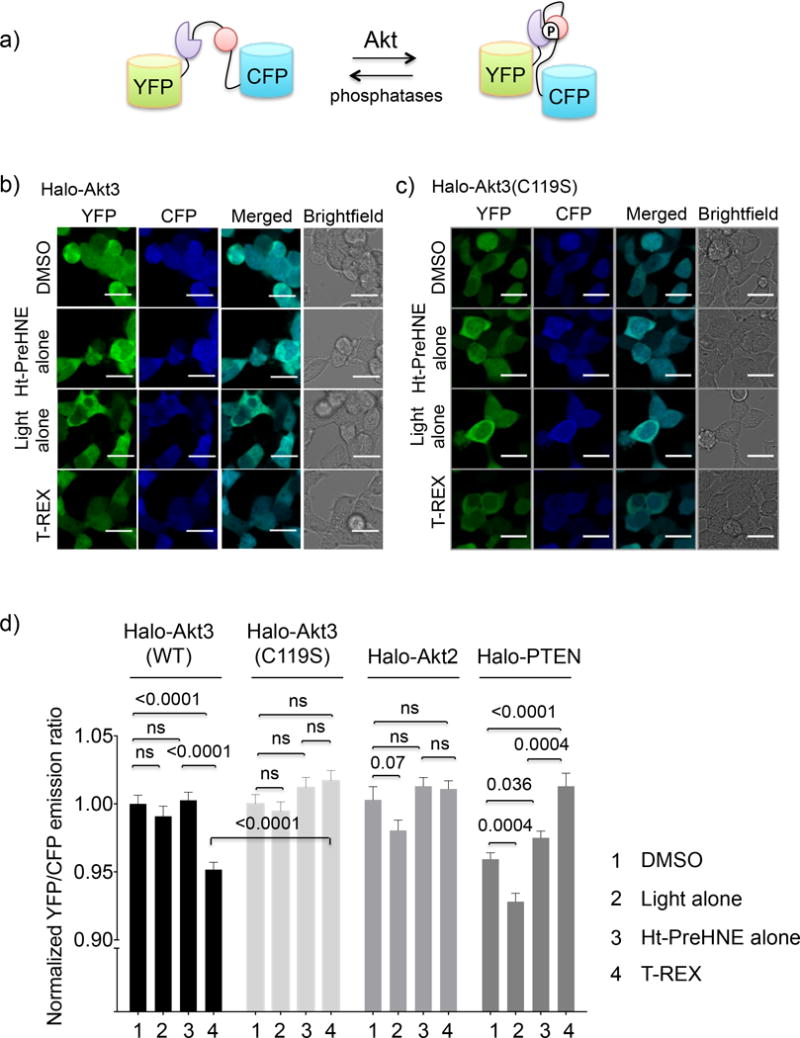
(a) Schematic of the FRET-based Akt activity reporter (AktAR)24. Phosphorylation of a peptide substrate (pink) by Akt isozymes allows a phospho-peptide binding domain (purple) to bind the phosphorylated substrate resulting in an increase in FRET. (b–c and Supplementary Fig. 4) HEK 293T cells co-transfected with AktAR reporter plasmid24 and mRNA encoding either Halo-Akt3 (these data are consistent with a blinded study) (b), Halo-Akt3(C119S) (c), were subjected to T-REX-assisted HNE-targeting. After 8–10 h, cells were excited using an Argon laser (458 nm). Images were obtained using cyan (463–498 nm) and yellow (525–620 nm) channels. Scale bar: 20 μm (f) Quantitation of YFP/CFP ratio of individual cells in b–c and Supplementary Fig. 4 using Image-J. Error bars designate s.e.m. with n = Akt3(wt) (197, 124, 205, 185); Akt3(C119S) (242, 243, 252, 240); Akt2 (107, 103, 103, 104); and PTEN (94, 38, 52, 43) for DMSO, light alone, Ht-PreHNE alone, and T-REX, respectively, where n designates number of cells quantitated per condition from two independently replicated sets at different passage numbers. Also see Supplementary Fig. 4–8.
Figure 4. Akt3(C119)-Specific HNEylation upregulates transcriptional activities of tumor suppressor genes.
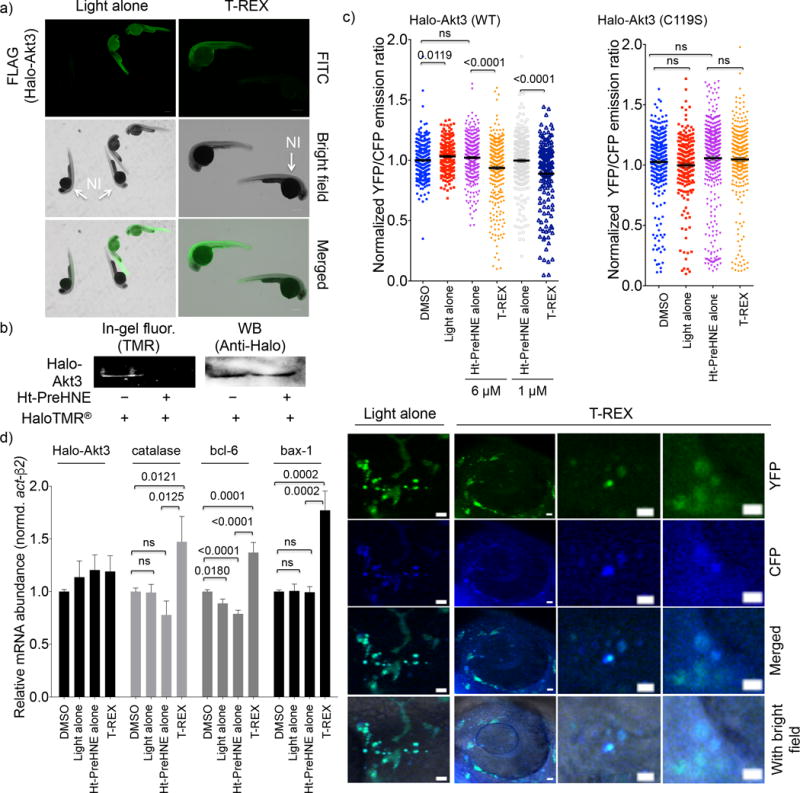
(a) Whole-mount immunofluorescence, detecting for FLAG in fish injected with Halo-Akt3(FLAGx2) mRNA. The non-injected (NI), untreated fish are shown as control. Scale bar, 300 μm. Also see Supplementary Fig. 11. (b) Fish injected with Halo-Akt3 mRNA express the full-length fusion protein (~90 kDa). Pre-treatment of whole embryos with Ht-PreHNE prevents labeling of Halo-Akt3 with HaloTMR® post lysis. Also see Supplementary Fig. 13a for a full gel and blot. (c) Quantitation (Upper) and representative images (lower) of CFP and YFP fluorescence in fish co-injected with Halo-Akt3 mRNA and AktAR plasmid DNA. Also see Supplementary Fig. 15–17. Scale bar: 10 μm. YFP/CFP ratiometric image quantification of individual somatic cells [297 (DMSO), 230 (light alone), 315/270 (Ht-PreHNE alone, 6 vs. 1 μM), and 325/168 (T-REX, 6 vs. 1 μM)] cells from n=5 independent embryos] indicates Akt3-C119-specific HNEylation in wt-fish embryos enabled by T-REX (Supplementary Fig. 16–17) downregulates the kinase activity; these effects were ablated in Akt3(C119S) mutant [298 (DMSO), 225 (light alone), 422 (Ht-PreHNE alone, 1 μM), and 317 (T-REX)]. Error bars are s.e.m. (d) Consistent with results in (c), since Akt3 is an established upstream antagonist of FOXO and p53, Akt3-specific HNEylation-dependent kinase-activity downregulation upregulates transcriptional activities of FOXO and p53 tumor suppressors. Catalase and Bcl6, and Bax-1 are driven by FOXO and p53, respectively. Error bars designate s.e.m (n = 6 independent biological replicates and two technical repeats for each bar). These changes were not observed for Halo-Akt3(C119S) or Halo-Akt2 (Supplementary Fig. 18).
To set these results relative to the maximal response tolerated by this system, we directly compared ratiometric-FRET-quenching observed in T-REX to that observed upon treatment with two different pan-Akt-kinase inhibitors [MK-2206 and afuresertib (GSK2110183)] under otherwise identical conditions (Halo-Akt3 transfected and serum-starved) (Supplementary Fig. 5d–e). A time- and dose-dependent titration revealed that the maximum change in the system, for both inhibitors, was ~30% (Supplementary Fig. 5d–g). This was reached within 3 h after treatment. This plateau was maintained for 24 h, and was the same for both inhibitors, strongly indicating that ~30% is the maximal dynamic range of this assay relative to serum-containing conditions.
Because AktAR assays are typically set up under serum-starved conditions and so are T-REX experiments, we also showed that serum starvation still allowed measurements of FRET changes in both wt- and mutant-expressing cells following treatment with MK-2206 as the representative pan-Akt-inhibitor (Supplementary Fig. 5d). In general, serum starvation caused a maximal 15% drop in signal after > 3 h treatment that remained constant over 24 h (Supplementary Fig. 5e), and the drop in fluorescence caused by MK-2206 was independent of serum starvation. Thus the maximal dynamic range under T-REX conditions is 15%.
Importantly, the activity of kinase-active C119S mutant was unaltered upon T-REX (Fig. 3c–d), consistent with its negligible HNE-sensing capability (Supplementary Fig. 4). In addition, the direct comparison with the results from C119S mutant supported the relevance of the use of these inhibitors (Fig. 3d and Supplementary Fig. 5d–h). These data collectively suggest that under target-specific HNEylation conditions on the wt Halo-Akt3, the extent of Akt3-activity downregulation achieved was 20–30% of the maximum; whereas the kinase activity of the HNE-sensing-defective mutant, Akt3(C119S), was unperturbed.
The magnitude of Akt3-kinase activity suppression is modest (20–30%) but it is readily measured by this assay (see, for instance, time/dose-response curves, or end-point variation, Supplementary Fig. 5e–h) and is indeed of a magnitude expected based on the T-REX-delivery data. HNEylation occupancy on a POI is a function of photouncaging efficiency [the percentage of reactive HNE signal liberated from Ht-PreHNE bound to Halo under the assay conditions (Supplementary Fig. 1b); typically > ~60% after 4-min light-exposure in cells] and targeting efficiency (the percentage of liberated HNE signal delivered to POI). In the case of Akt3, the latter amounts to ~20% (Fig. 1c and Supplementary Fig. 4a, average of multiple runs as described). Given that C119S mutant failed to be labeled effectively (Supplementary Fig. 4a), ~12% occupancy on Akt3 can be functionally ascribed to a single Cys-site-specific modification that is sufficient to elicit a change in kinase activity. Any discrepancy between this change in activity (~20–30%) and occupancy (~12%) can be accounted for by the known dominant-negative effects that can occur for Akt25,26, which predicts that inhibition would be higher than absolute occupancy.
By contrast, HNE targeting to Akt2—a less efficient HNE sensor—failed to elicit disruption of Akt2 activity (Fig. 3d and Supplementary Fig. 6a), although the effect of overexpression of Halo-Akt2 on basal Akt-kinase activity was similar to that of Halo-Akt3 (Supplementary Fig. 5a–b). Given the latter result and follow-up experiments in zebrafish (below), this difference is likely explained by the lower HNE modification efficiency and thus LDE-sensing capability, shown by Akt2. We further validated this assay using PTEN, a bona fide HNE first responder and negative regulator of Akt3 signaling. Targeted HNE modification of PTEN15,16 showed the expected outcome—increase in FRET signal caused by a dominant-negative loss-of-function phenotype27 (Fig. 3d and Supplementary Fig. 6b), and further assured the validity of the assay set up and data interpretation.
HNEylation of Akt3 perturbs downstream targets
The innate LDE sensitivity of Akt3 that we have discovered offers a way to execute remote transcriptional activation and downstream signal propagation at user command without the need for permanent genome editing. As a proof of concept, we used three independent analyses. First, immunofluorescence imaging showed that FOXO translocated post T-REX only in cells expressing wt-Halo-Akt3 but not C119S (Supplementary Fig. 7a–c). Subcellular distribution of Halo-Akt3(C119S) remained the same as wt (Supplementary Fig. 4c and 7b) and Halo-Akt3 localization was unaltered by T-REX-redox-targeting (Supplementary Fig. 7d). We next examined transcriptional upregulation (Supplementary Fig. 8). Overexpression of either Halo-Akt2 or -Akt3 suppressed FOXO-mediated transcriptional activation using luciferase reporter assays (Supplementary Fig. 8a–b), further substantiating that HaloTagged-Akt2 and -Akt3 are functional and that elevated Akt-activity can be detected in this assay. Consistent with HNE-delivery data above (Fig. 1b–d and Supplementary Fig. 4a), selective upregulation of FOXO pathway was observed only upon targeting of Akt3-wt, and not Akt3(C119S) or Akt2 (Supplementary Fig. 8c–d). Finally, caspase activity was selectively increased only in Halo-Akt3-wt-expressing cells, and not Akt3(C119S), subsequent to T-REX (Supplementary Fig. 9).
Phosphorylation is arguably the cell’s go-to information currency, so numerous signaling subsystems intersect with phosphosignaling at specific nodes. The kinase-isozyme-specific HNEylation that we uncover here suggests that volatile LDE signals targeted to specific Cys’s directly influence specific downstream phosphosites through such an information exchange. To test this posit, we turned to ratiometric sandwich-ELISA to measure the functional consequences of Akt3-specific HNEylation on phosphorylation of Akt3 and FOXO. We first treated a plate pre-coated with antibodies to Halo- or FLAG-tag with saturating concentrations of lysates expressing the Halo- or FLAG-tagged transgene of interest that originate from cells exposed to different experimental conditions. We then quantitated the amount of phosphorylation in each sample. The robustness of the assay was first confirmed using MK-2206 to modulate Akt3(T-305)-phosphorylation status as well as inhibit Akt3-catalyzed FOXO1a/3a phosphorylation at T24/T32 (Supplementary Fig. 10a). Consistent with the FRET-quenching assay, complete dephosphorylation of Akt3-wt or –(C119S) mutant occurred in a few hours with MK-2206 and FOXO-phosphorylation was significantly perturbed in all cases with both inhibitors. T-REX-mediated HNEylation did not perturb phosphorylation levels of Akt3(T305) (Supplementary Fig. 10b), confirming that T-REX does not perturb upstream regulatory mechanisms, many of which are redox-sensitive. By contrast, the level of FOXO-phosphorylation was selectively reduced post T-REX only in wt-expressing cells but not in cells expressing C119S (Supplementary Fig. 10c).
HNE regulation selective to Akt3 occurs in Danio rerio
We found that the capability of Akt3 to selectively sense and respond to LDEs also occurs in the zebrafish Danio rerio—an ideal model system for the light-driven redox-targeting tool. Successful, ubiquitous expression of Akt3-wt/(C119S) and GFP-Halo (which was initially used for procedural optimizations) subsequent to mRNA injection into embryo yolk sacs was confirmed by qPCR, western blot, and imaging (Fig. 4a and Supplementary Fig. 11). T-REX conditions against all controls preserved functional morphology of the fish, irrespective of Halo-Akt2/Akt3-wt/(C119S) mRNA injection (Supplementary Fig. 12a–b). The photocaged precursor saturated the Halo binding site in live fish embryos (Fig. 4b and Supplementary Fig. 13a–b) and light-controlled HNE liberation from HaloTag was complete in minutes (Supplementary Fig. 13c–d). Using whole-mount immunofluorescence and western blot analyses, we ascertained that ectopic Akt3 accounted for ~30% of the total Akt pool and the level was unaffected by the probe treatment (Fig. 4a and Supplementary Fig. 11b–c, 14a). The C119S-mutant was expressed to a similar level as wt (Supplementary Fig. 11c, 14b). Importantly, two independent analyses showed T-REX-mediated HNEylation of Akt3 occurs in fish (Supplementary Fig. 14c–d).
We next probed the Akt3-specific modulation of kinase activity and functional redox responses in zebrafish28. Using the same ratiometric FRET-based reporter (Fig. 3a), mosaic expression of the reporter was achieved by co-injecting a plasmid encoding the AktAR biosensor under a CMV-promoter with Halo-Akt3 (either wt or C119S) mRNA directly into the single cell (Fig. 4c and Supplementary Fig. 15–17). We first established that this ratiometric imaging assay was functional in zebrafish using Afuresertib and MK-2206 (Supplementary Fig. 15). Broadly similar data were observed to our results from cell culture (Supplementary Fig. 5d–e). Both compounds were only mildly toxic/teratogenic to fish (Supplementary Fig. 12b). Afuresertib showed approximately 30% quenching. MK-2206 showed lower quenching efficiency, likely due to metabolism/excretion/distribution variations, all of which are variables that are not at play in cell culture (Supplementary Fig. 15).
To measure kinase activity in vivo post T-REX redox targeting, the injected fish were split into T-REX and various control groups 24-h post injection. In T-REX set, a full T-REX HNE targeting of Halo-Akt3 was executed after treatment with the HaloTag-targetable photocaged precursors, whereas in the others, the samples were treated with either vehicle (DMSO), light, or two different concentrations of Ht-PreHNE to account for any non-specific effects on background FRET signal. The expression of the FRET biosensor also had minimal effect on embryo development. Upon specific LDE modification of Akt3 via zebrafish-T-REX, the ratiometric FRET signal was reduced only in fish expressing wt-but not C119S-mutant Akt3 (Fig. 4c and Supplementary Fig. 16–17). The invariant results of kinase activity downregulation measured in both cells and fish using the same ratiometric-FRET-reporter assay, coupled with the ablation of drop in FRET signal in the case of hypomorphic Akt3(C119S) mutant, afford compelling evidence that our data are not biased by overexpression (Fig. 3 and 4c), since transgene expression was at least an order of magnitude lower in fish compared to cells (Supplementary Fig. 4a–b, 11, and 14).
C119-HNEylation affects Akt3 signaling in Danio rerio
We next performed downstream gene analysis using qRT-PCR in zebrafish. Consistent with our data showing relatively low expression of Halo-Akt-(wt/C119S) protein with respect to endogenous global Akt protein expression, basal levels of downstream Akt-controlled genes were unchanged in Halo-Akt3-(wt/C119S) injected fish relative to controls (Supplementary Fig. 18a). None-the-less, we found that relative to beta-actin, T-REX selectively promoted induction of known downstream Akt targets only when Akt3-wt was selectively targeted (Fig. 4d). While all of these downstream transcripts are regulated by both Akt2 and Akt3, replicating identical experiments with either Halo-Akt2 or the hypomorphic mutant Halo-Akt3(C119S), in place of Halo-Akt3 did not activate those genes (Supplementary Fig. 18b–c). Overall these data strongly implicate that HNEylated Akt3 exerts a dominant negative effect on Akt activity, consistent with the cell culture data (above).
Discussion
In the wake of demystification of biological complexities at the genome level by genome sequencing, biologists search for ever more subtle changes at the “post-translational” level. Arguably one overlooked subclass of this incredibly complex field is nE-PTM-driven signaling subsystems. Here we show compelling evidence that isoforms of Akt that share >75% homology differ widely in their ability to sense bioactive electrophiles. Interestingly, the sensing cysteine within Akt3 lies in an unstructured loop, which has relatively low conservation with respect to the functional domains common to all Akt isoforms. A similar (although not identical) cysteine on the same loop region within Akt2 has been reported previously to sense ROS19, indicating that RES/ROS sensing is discriminatory. On balance, these data provide grounds for a hypothesis that variable loop regions may be hotspots of ROS/RES sensing activity. But how these differential sensing modes are derived at the structural/stereoelectronic-level remains an important question that studies like ours can help to address in the future. Interestingly, the functional cysteines within Akt3 and Akt2 show high conservation across different species, indicating that they play an important role that has been selected for some time, consistent with them both having important and hard-wired functional roles.
Of equal importance, we establish Akt3 as a functional HNE-sensing node. Consistent with our previous predictions29, HNE modification of Akt3 at least seems to exert a dominant negative effect. In the case of Akt3, HNEylation downregulates its kinase activity, that can relay into upregulation in several genes that are suppressed by Akt3 activity. This functional informational exchange must occur on specific proteins for ROS/RES to convert to “functional information currency” like ubiquitin and phosphate and assist in the decision making of the cell. We will continue to search for new nodes.
Online Methods
General Materials and Methods
All procedures related to zebrafish studies conform to the National Institutes of Health guidelines regarding animal experimentation and were approved by Cornell University’s Institutional Animal Care and Use committees. Casper strain zebrafish were used for the experiments. Since zebrafish are believed to exhibit polygenic sex determination, at the age at which experiments were undertaken sex of the fish were unable to be determined30.
All primers were from IDT. Phusion HotStart II polymerase was from Thermo Scientific. All restriction enzymes were from NEB. All Halo clones in pFN21a vector (Kazusa Collection) and HaloTag®-TMR ligand were from Promega. Trizol RNA purification kit and Superscript III Reverse transcriptase were from Life Technologies. iQ SYBR Green Supermix was from BioRad. Complete EDTA free protease inhibitor was from Roche. 1X RIPA buffer was from Santa Cruz biotech. 1X Bradford dye was from BioRad. TALON metal affinity resin and His60 nickel resin were from Clonetech. Pre-HNE and HaloTag-targetable photocaged precursor HNE alkyne (Ht-PreHNE) were synthesized as described previously,15,16. Cy5 azide and Cu(TBTA) were from Lumiprobe. Dithiothreitol (DTT), streptomycin sulfate, isopropyl β-D-1-thio-galactopyranoside (IPTG), TCEP-HCl, Coelenterazine, and D-Luciferin were from Goldbio Biotechnology. Coenzyme A was from Avanti Polar lipids. trans-1,2-Diaminocyclohexane-N,N,N′,N′-tetraacetic acid monohydrate (CDTA) was from Alfa Aesar. 2-(4-aminophenyl)-6-methylbenzothiazole (APMBT) was from Enamine. Adenosine triphosphate disodium salt hydrate (ATP) was from Fisher. Biotin-dPEG®11-azide was from Quanta Biodesign. MK-2206.2HCl (S1078) and Afuresertib (S7521) were from Selleckchem. A 10 mM stock of the inhibitors were prepared in DMSO and stored in aliquots in −80 °C. Streptavidin sepharose beads were from GE Healthcare. Bovine Serum Albumin (BSA) powder was from Thermo Scientific. All other chemicals were from Sigma. BL21 (DE3)-RIL codon plus cells were from Stratagene. The plasmid for recombinant expression of TEV protease (pRK793, Addgene #8827), FOXO reporter plasmid FHRE-Luc (Addgene #1789), FLAG-FOXO-1a plasmid (Addgene #12148), FLAG-FOXO-3a plasmid (Addgene #8360), and the empty pCS2+8 vector (Addgene #34931) were from Addgene. HEK 293T cells were from American Type Culture Collection (ATCC). Cell line was validated to be free of mycoplasma contamination using MycoGuard™ Mycoplasma PCR detection kit (Genecopoeia™, MPD-T-050). 1X DPBS, 1X Trypsin (TrypLe), 100X NEAA, 100X sodium pyruvate, 100X Penicillin-Streptomycin and 1X MEM+Glutamax media were from Life Technologies. Fetal Bovine Serum (FBS) was from Sigma (F2442). TransIT 2020 transfection reagent was from Mirus Bio LLC. Polyethylenimine, linear, MW 25,000 (PEI, 23966-1) was from Polysciences, Inc. All tissue-culture treated plasticware was from CellTreat. 365 nm UV lights were from Spectroline (for handheld size, ENF240C) and Thermo Fisher (if larger surface area is needed, XX-15N). For T-REX experiments, the lamps were positioned above confluent monolayer of cells or zebrafish embryos in 6-well plates such that the power of UV irradiation was ~ 5 mW/cm2 (as measured by a hand-held power sensor (Spectroline, XDS-1000). For all confocal imaging experiments, a Zeiss LSM710 confocal microscope was used. Quantitation of fluorescence intensity was performed using Image-J software (NIH, version 1.50g). In-gel fluorescence analysis and imaging of western blots and Coomassie stained gel were performed using BioRad Chemi-Doc MP Imaging system. Densitometric quantitation was performed using Image-J (NIH). Cy5 excitation source was epi illumination and 695/55 emission filter was used. Cell counting was done by Countess II FL (A25750). His6-TEV S219V protease was recombinantly expressed and purified from BL21(DE3)-RIL cells using TALON resin. Quantitative PCR (qRT-PCR) was performed using MyiQ™ Single-Color Real-Time PCR Detection System (Bio-Rad 170-9740). Dual luciferase assay was performed using a BioTek Cytation™ 3 Cell Imaging Multi-mode reader with dual reagent injectors. Primer information and antibodies used are listed in Supplementary Table 1 and 4, respectively.
Construction of plasmids
Ligase-free cloning was used to clone various plasmids (Supplementary Table 1) for expression in mammalian cells and in zebrafish. Halo ORFeome clone library in pFN21a vector was purchased from Promega. To sub-clone the Halo fusion genes in pCS2+8 vector and insert a His6 tag at the N-terminus, the gene of interest (GOI) was cloned out from the original plasmid using the indicated forward (fwd-1) and reverse primers (rev-1). The resultant PCR product was extended using the indicated fwd-2, and rev-2 primers. An additional extension step was performed on the resulting product using fwd-3 and rev-2 primers. The resultant “megaprimer” was inserted into empty pCS2+8 vector (Addgene #34931) linearized with ClaI restriction enzyme (NEB). To make pCS2+8 His6-Halo-(TEV)-Akt3(C119S) mutant, Akt3(wt) was amplified from the original plasmid using the indicated forward (fwd-1) and reverse primers (rev-1). The resultant PCR product was extended using the indicated fwd-2 and rev-2 extender primers. The resultant “megaprimer” was inserted into pCS2+8 His6-Halo-Akt3(wt) after linearizing with ClaI restriction enzyme. To insert 2X FLAG peptide at the C-terminus of pCS2+8 His6-Halo-Akt3(wt), the gene of interest was amplified as described above except that the indicated forward and reverse primers were used. All plasmid sequences were verified by sequencing the entire gene at the genomics facility of Cornell Institute of Biotechnology. Plasmids were purified using EZ-10 spin column plasmid DNA miniprep kits (Bio Basic, BS614).
T-REX in mammalian cells
HEK 293T cells were maintained in 1X MEM+ Glutamax™ media supplemented with 10% FBS, 1X NEAA, 1X sodium pyruvate and 1X Pen-Strep. Cells were grown in humidified, 5% CO2 incubator at 37 °C. For in-gel fluorescence analysis and western blot, ~ 0.7–0.8×10² HEK 293T cells were seeded in 8 cm2 tissue culture dishes. 24 h later, cells were transfected using TransIT-2020 transfection reagent using manufacturer’s recommendation. The subsequent steps were performed under red light. 24–36 h post transfection, monolayer of cells were treated with either 12 μM Ht-PreHNE or indicated concentrations (25 μM in the case of Halo-PTEN activity reporter assays) in serum-free media and incubated for 2.5 h. Cells were gently rinsed with serum-free media three times every 30 min over the next 1.5 h. Meanwhile, UV lamps were turned on 20 min prior to UV irradiation time to warm up the lamp. For samples designated for light exposure, the lids from the dishes were removed and the monolayered cells were placed under 365 nm UV light for 3–20 min (FRET assay and FOXO reporter assay in mammalian cells: 3 min; FRET assay and samples for qRT-PCR in zebrafish: 5 min; MS samples and In-gel fluorescence samples: 20 min)15. The cells were harvested, washed two times with ice-cold PBS and frozen in liquid nitrogen.
Western blotting
Cells were lysed in 1X RIPA buffer containing in final concentrations 1X Roche EDTA-free Protease inhibitor, 1 mM sodium orthovanadate and 1 mM PMSF, by rapid freeze-thaw (x3). Cell debris was removed and the supernatant was collected after centrifugation at 18,000× g for 8 min at 4 °C. Protein concentration was determined using Bradford assay. 30–50 μg of total lysates were resolved by SDS-PAGE and the gel was transferred onto a PVDF membrane at 100 V for 1 h at 4 °C or at 40 V overnight at 4 °C. Membrane was blocked with 5% BSA and probed with various antibodies at the indicated dilutions (Supplementary Table 4).
In-gel fluorescence assay
All steps were performed in dark or under red light. Cells from 8cm2 plates were lysed in 30 μL of buffer containing 50 mM HEPES (pH 7.6), 1% Nonidet P–40 and 0.3 mM TCEP by rapid freeze-thaw (x3). Cells debris was removed by centrifugation at 18,000× g for 8 min at 4 °C. Protein concentration of the clarified lysate was determined using Bradford assay. A portion of the lysate protein was made up to 25 μL final volume containing, in final concentrations, 50 mM HEPES (pH 7.6), 1.0 mg/mL lysate protein, 0.3 mM TCEP, and 0.2 mg/mL TEV protease. The sample was incubated at 37 °C for 45 min, and subsequently subjected to Click reaction31. In a final volume of 30 μL, the click reaction mix consisted of 1.7 mM TCEP, 5% t-BuOH, 1% SDS, 1mM CuSO4, 0.1 mM Cu(TBTA), 10 μM Cy5 azide and the lysate from above. The samples were incubated at 37 °C for 30 min and subsequently quenched with 5 μL of 4X Laemmeli dye containing 6% βME. After additional 5-min incubation at 37 °C, 25 μL of the lysate was resolved by SDS-PAGE. After electrophoresis, the gel was rinsed 3X with ddH2O with 5-min each rinse on a shaker and imaged on a Biorad Chemi-doc-MP Imager. Where applicable, the gel was transferred to a PVDF membrane for western blot analysis.
Biotin azide pull down from mammalian lysate
HEK 293T cells were split in 60 cm2 plate. After the cells reached 60% confluence, the old media were aspirated and replaced with fresh 8 mL complete media. Cells were transfected with 7.5 μg of the designated plasmids encoding the HaloTag fusion gene and 30 μL 1 mg/mL PEI in 600 μL in Opti-MEM media for 24–36 h after which the cells were treated with 25 μM Ht-PreHNE or without alkyne (control) for 2.5 h. Rinsing and light shining protocol were as described above. Cells were harvested, washed twice with chilled 1X DPBS and flash frozen. Cell lysis was performed in 200 μL of lysis buffer containing in final concentrations 50 mM HEPES (pH 7.6), 150 mM NaCl, 1% Nonidet P-40 and 0.3 mM TCEP by rapid freeze-thaw (x3). Lysate was clarified by centrifugation at 18,000× g for 8 min at 4 °C. Total protein concentration was determined using Bradford assay using BSA as a standard. TEV protease at a final concentration of 0.2 mg/mL was added to the lysate and incubated at 37 °C for 45 min. The lysate was subsequently diluted to 2 mg/mL with a buffer made up of 50 mM HEPES (pH 7.6) and 0.3 mM TCEP, and subjected to Click reaction with biotin azide for 30 min at 37 °C. The final concentrations of each components were: 1% SDS, 5% t–BuOH, 200 μM Biotin azide, 2 mM TCEP, 0.9 mM CuSO4 and 0.1 mM Cu(TBTA). The lysate proteins were precipitated by adding 4 volumes of EtOH pre-chilled at −20 °C. The sample was vortexed and incubated at −80 °C overnight (or at least 4 h). The precipitant was collected by centrifugation at 18,000× g for 30 min at 4 °C and washed twice with pre-chilled MeOH then acetone. The pellet was resuspended in 50 μL of 50 mM HEPES (pH 7.6), 4% LDS and 0.5 μM EDTA and dissolved by vortexing and heating at 42 °C for 5 min. LDS was diluted to a final concentration of 0.5% by diluting the sample with 350 μL of 50 mM HEPES (pH 7.6) and added to 50 μL bed volume of Streptavidin sepharose beads pre-equilibrated with 50 mM HEPES (pH 7.6) and 0.5% LDS. The sample was incubated with beads for 2–3 h at room temperature by end-over-end rotation after which the supernatant was removed post-centrifugation at 500× g for 3 min. The beads were washed three times with 500 μL of 50 mM HEPES (pH 7.6) with 0.5% LDS with end-over-end rotation at room temperature for 30 min during each wash. The bound protein was eluted by boiling the beads at 98 °C for 10 min with 30 μL of Laemmeli dye containing 6% βME. The sample was subjected to SDS-PAGE and transferred to a PVDF membrane for western blot analysis.
FRET assay in live mammalian cells
0.4–0.5 ×10² HEK 293T cells were split into 4 × 35 mm glass-bottomed dishes. After 24 h, cells from each plate were transfected with 750 ng of AktAR reporter plasmid and 750 ng of the designated HaloTag fusion gene plasmid in pFN21a vector, using TransIT 2020. 24 h post transfection, cells were treated with 25 μM Ht-PreHNE or the equivalent final volume of DMSO in serum-free media and incubated for 2.5 h. Cells were gently rinsed with serum-free media three times every 30 min over the next 1.5 h. Meanwhile, UV lamps were turned on 10 min prior to UV irradiation time to warm up the lamp. For samples designated for light exposure, the lids from the dishes were removed and the monolayered cells were placed under 365 nm UV light for 3 min. The lids were replaced and the cells incubated for additional 8–10 h before imaging. FRET imaging was performed using a Zeiss LSM 710 confocal microscope as previously described. Briefly, 458 nm argon laser was used for excitation. The signals in cyan channel (463–498 nm) and yellow channel (525–620 nm) were recorded. For quantitation, the mean CFP and YFP signal intensity was measured using Image-J software by drawing a freehand circle around the cells and ratio image was calculated. Graphing and data analysis (Student’s t-test) was performed using Prism software.
ELISA
Antibody was bound to the plate at the stated concentration (1–3 μg/mL) in sodium bicarbonate buffer pH 9.6 for at least 24 h in a 96 well white plate (80 μL per plate) at 4 °C. Maximum incubation time was 48 h. After this time, incubation buffer was removed, washed once with TBS-Tween (100 mM Tris, 150 mM NaCl, 0.03% Tween-20) and then blocked in 5% BSA in TBS-Tween (280 μL per plate) for 3–5 h at rt. After this time, BSA was washed away two times using TBS-Tween, then wells were filled with 150 μL blocking buffer (1.1 % BSA, 5 mM sodium orthovanadate, 20 mM NaF). Cells were lysed in 50 mM HEPES pH 7.6, 1 % NP-40, 5 mM sodium orthovanadate, 20 mM NaF and 2X ROCHE complete minus EDTA protease inhibitors. 30 μg each lysate (quantified by Bradford relative to BSA) was added to each well (approximately 30 μL lysate, but always equal amounts of total lysate buffer was added for each set). For a number of individual data points (usually those yielding the most protein), the amount of lysate loaded was doubled in separate wells and the value recorded was ultimately compared to the value obtained for 1X lysate. This was shown to give equal signal (proving saturation conditions wherein the amount of phosphorylated protein detected reflects the ratio of phosphorylated to non-phosphorylated protein in the lysate). This was incubated at 4 °C overnight. After this time, wells were washed with TBS-Tween 3 times, then primary antibody was added in 1.1 % BSA in TBS-Tween overnight at 4 °C. After this time, wells were washed (primary antibody could be recycled, but this was not done for the data in this manuscript) and HRP-conjugated secondary antibody was added in 1% Milk in TBS-Tween. After 1 h at rt, wells were washed 3 times with TBS-Tween, for 15 min, then once with TBS for 20 min after which time 50 μL TBS was added to each well. HRP was detected using an autoinjector program on a Biotek citation 3 plate reader. Femto ELISA substrate was used, injecting 50 μL Femto ELISA substrates 1 and 2 per well. Signals were calculated relative to well coated in antibody and treated with untransfected lysate. Usually this gave signals very close to those observed for treatment with inhibitor.
Luciferase assay
0.5–0.6 ×10⁵ HEK 293T cells were seeded in each well of a 48-well plate. 24 h later, the cells were transfected with 120 ng of the designated HaloTag fusion gene plasmid and 120 ng of FHRE::Firefly luciferase: pCMV::Renilla luciferase (40:1) mix, by using TransIT–2020 transfection agent. 24 h post-transfection, cells were treated with DMSO or 25 μM Ht-PreHNE for 2.5 h, rinsed three times and irradiated with 365 nm UV light for 3 min. The cells were incubated for either 8 or 18 h. For dual luciferase assay, cells in each well were gently washed with 1X DPBS and lysed in 65 μL of 1X passive lysis buffer that contained in final concentrations 25 mM Tris (pH 7.8), 2 mM 1,2-CDTA, 2 mM DTT, 1 mg/mL BSA, 1 % Triton X-100, and 10% Glycerol. 20 μL lysate was transferred to a white opaque 96-well plate (Corning). Firefly luciferase was read after adding 50 μL of Firefly substrate (75 mM HEPES pH 8.0, 4 mM MgSO4, 20 mM DTT, 0.1 mM EDTA, 0.53 mM ATP, 0.27 mM Coenzyme-A, 0.47 mM D-Luciferin Firefly). Subsequently, 50 μL of Stop and Glow substrate (7.5 mM sodium acetate pH 5.0, 400 mM sodium sulfate, 10 mM CDTA, 15 mM sodium pyrophosphate, 0.025 mM APMBT (2-(4-Aminophenyl)-6-methylbenzothiazol), 5.5 μM Coelenterazine) was added and Renilla luciferase activity was measured.
Caspase assay in mammalian cells
0.5–0.6 ×10⁵ HEK 293T cells were seeded in each well of a 48-well plate. 24 h later, the cells were transfected with 120 ng of the designated HaloTag fusion gene plasmid and 120 ng of 40:1 FHRE::firefly luciferase: pCMV::Renilla luciferase, using TransIT–2020 transfection agent. 24 h post-transfection, cells were treated with DMSO or 25 μM Ht-PreHNE for 2.5 h, rinsed three times and irradiated with 365 nm UV light for 3 min. The cells were incubated for 18 h after which the cells were trypsinized, washed two times and lysed in 65 μL of 1X passive lysis buffer (see Luciferase assay protocol). 20 μL of the lysate was transferred to a white opaque 96-well plate (Corning). Firefly luciferase and Renilla luciferase activities (the latter was used for normalization) were measured as described (see Luciferase assay protocol). FHRE assay data were consistent with those shown in Supplementary Figure S6. 25 μL of the remaining lysate was transferred to a black opaque 96-well plate (Corning) for measuring caspase activity. 100 μL caspase substrate containing 50mM HEPES (7.4), 100mM NaCl, 0.1% CHAPS, 10mM DTT, 1mM EDTA, 10% glycerol and 15 μM Ac-DEVD-AMC was added to each well and the release of AMC was measured continuously by fluorescence for 2 h at 37 °C using a plate reader with excitation at 380 nm and emission at 440 nm.
His-tag pull down
HEK 293T cells were split in 2 × 60 cm2 plate. After the cells reached 60% confluence, the media were aspirated and replaced with fresh 8 mL complete media. Cells were transfected with 7.5 μg of the designated Halo clone and 30 μL PEI in 600 μL in Opti-MEM media for 24–36 h after which the cells were treated with 25 μM Ht-PreHNE for 2.5 h. Rinsing and light shining protocol were as described above. Cells were harvested, pooled, washed twice with chilled 1X DPBS and flash frozen. Cell lysis was performed in 500 μL of lysis buffer containing in final concentrations 50 mM HEPES (pH 7.6), 100 mM NaCl, 1% Nonidet P-40, 10 mM Imidazole, 5 mM βME and Roche protease inhibitor by a rapid freeze-thaw (x3). Lysate was clarified by centrifugation at 18,000 × g for 8 min at 8 °C. Total protein concentration was determined using Bradford assay using BSA as a standard. Lysate was diluted to 1.5 mg/mL in lysis buffer and incubated with 50 μL bed volume of His60 nickel resin (pre-equilibrated with lysis buffer) for 1 h at 4 °C with end-over-end rotation. The resin was then washed (x3), each time for 5 min with 500 μL wash buffer containing in final concentrations 50 mM HEPES (pH 7.6), 100 mM NaCl, 0.5% Nonidet P-40, 20 mM imidazole and 5 mM βME. The bound protein was eluted sequentially with 30 μL of elution buffer 1 (50 mM HEPES, 100 mM NaCl, 60 mM imidazole, 5 mM βME), elution buffer 2 (50 mM HEPES, 100 mM NaCl, 100 mM Imidazole, 5 mM βME) and finally with elution buffer 3 (50 mM HEPES, 100 mM NaCl, 150 mM imidazole, 5 mM βME). The samples were subjected to SDS-PAGE and stained with colloidal blue (Coomassie G-250) stain.
In-gel trypsin digestion of SDS gel bands
The enriched Halo-Akt3 protein band from the SDS-PAGE gel above was cut and subjected to in-gel digestion with trypsin (Promega) followed by extraction of the tryptic peptide as reported previously32. The excised gel pieces were washed consecutively in 200 μL distilled water, 100 mM ammonium bicarbonate (Ambic, pH 7.8)/acetonitrile (1:1) and acetonitrile (ACN). The gel pieces were reduced with 70 μL of 5 mM TCEP in 50 mM Ambic solution (pH 7.8) for 45 min at room temperature and alkylated with 100 μL of 55 mM Iodoacetamide in 100 mM Ambic at room temperature in the dark for 60 min. After wash steps as described above, the gel slices were dried and rehydrated with 50 μL trypsin in 50 mM Ambic, 10% ACN (20 ng/μL) at 37 °C for 16 h. The digested peptides were extracted twice with 70 μl of 50% ACN, 5% formic acid (FA) and once with 70 μl of 90% ACN, 5% FA. Extracts from each sample were combined and lyophilized.
Protein Identification by nano LC/MS/MS Analysis
The in-gel tryptic digests were reconstituted in 20 μL of 0.5% FA for nanoLC-ESI-MS/MS analysis, which was carried out by an Orbitrap Elite mass spectrometer (Thermo-Fisher Scientific, San Jose, CA) equipped with a “CorConneX” nano ion source device (CorSolutions LLC, Ithaca, NY). The Orbitrap was interfaced with a Dionex UltiMate3000RSLCnano system (Thermo, Sunnyvale, CA). The gel extracted peptide samples (5 μL) were injected onto a PepMap C18 trap column-nano Viper (5 μm, 100 μm × 2 cm, Thermo) at 20 μL/min flow rate for on-line desalting and then separated on a PepMap C18 RP nano column (3 μm, 75 μm × 25 cm, Thermo) which was installed in the nano device with a 10-μm spray emitter (NewObjective, Woburn, MA). The Orbitrap calibration and nanoLC-MS/MS operation were as described previously33. Peptides were eluted with a 90-min gradient of 5% to 38% ACN in 0.1% FA at a flow rate of 300 nL/min, followed by a 5-min ramping to 95% ACN-0.1% FA and a 7-min hold at 95% ACN-0.1% FA. The Orbitrap Elite was operated in positive ion mode with nano spray voltage set at 1.5 kV and source temperature at 250 °C.
The instrument was operated in parallel data-dependent acquisition (DDA) under FT-IT mode using FT mass analyzer for one MS survey scan from m/z 375 to 1800 with a resolving power of 120,000 (fwhm at m/z 400) followed by MS/MS scans on top 15 most intensive peaks with multiple charged ions above a threshold ion count of 10,000 in FT mass analyzer. External calibration using Ultramark 1621 for both FT mass analyzer and IT mass analyzer is performed. Dynamic exclusion parameters and normalized collisional energy were set same as previously33,34. All data were acquired under Xcalibur 2.2 operation software (Thermo-Fisher Scientific).
LC-MS/MS data analysis
The DDA raw files for CID MS/MS only were subjected to database searches using Proteome Discoverer (PD) 1.4 software (Thermo Fisher Scientific, Bremen, Germany) with the Sequest HT algorithm. The database search was conducted against a human UniProt database containing 160,672 entries with two-missed trypsin cleavage sites allowed. The peptide precursor tolerance was set to 10 ppm and fragment ion tolerance was set to 0.6 Da. Variable modification of cysteine carboxymethylation, methionine oxidation, N-terminal acetylation and deamidation of asparagine/glutamine were set along with HNE alkyne (152.08 Da) and reduced HNE alkyne (154.10 Da) as well as their dehydrated HNE alkyne (134.07 Da) and dehydrated and reduced HNE alkyne (136.09 Da) on cysteine and all of these modifications also on histidine and lysine residues. Only high confidence peptides defined by Sequest HT with a 1% FDR by Percolator were considered for the peptide identification. All MS/MS spectra for identified Cam (carbamidomethylation) and HNE Cys modified peptides from initial database searching were manually inspected and validated using Xcalibur 2.2. Results are shown in Supplementary Table 2 and 3.
In vitro transcription
All genes were cloned into pCS2+8 vector using the primers in Supplementary Table 1. Prior to in-vitro transcription, the genes were PCR amplified using RNA fwd and Rev primers. In vitro transcription was performed using a mMessage mMachine SP6 transcription kit per manufacturer’s suggestion.
Fish injection and T-REX
All procedures conform to the National Institutes of Health guidelines regarding animal experimentation and were approved by Cornell University’s Institutional Animal Care and Use committees.
Fertilized eggs at the 1–2 cell stage from casper zebrafish were injected with mRNA (1.6 mg/ml) into the yolk sack. Immediately after injection, embryos were pooled, and separated into two petri dishes (10 cm) filled with 30 mL 10% Hank’s salt solution with methylene blue and penicillin (100 U/ml)/streptomycin (100 μg/ml). To one set was added the HaloTag-targetable photocaged precursor to HNE (Ht-preHNE, hereafter) (<15 μM) and the other DMSO in the dark. Fish were maintained at 28 °C in the dark for 28 h after which time fish were washed in 10% Hank’s solution with no methylene blue/antibiotic (3 times for 30 min each). Fish were moved to 6-well plates. Half of the embryos (Ht-preHNE-treated or -untreated) were irradiated with UV light for 5 min the other half of each set was not. Embryos were left for 8 h after which time they were euthanized, washed with cold 1X DPBS and dechorionated (and deyolked if protein analysis was to be undertaken) then either lysed using (for qRT-PCR) Trizol together with vortexing with glass beads; or (for protein analysis) resuspended in 50 mM Hepes, 1% triton X-100 and lysed by freeze-thawing followed by vortexing with zirconia beads (3 times).
FRET reporter assay in fish
Embryos at the 1-cell stage were injected with a mixture of mRNA (1.4 mg/ml) and reporter plasmid (30 μg/ml) into the single cell of fertilized eggs. Immediately after injection, embryos were pooled, and separated into two petri dishes (10 cm) filled with 30 ml 10% Hank’s salt solution with methylene blue and penicillin (100 U/ml)/streptomycin (100 μg/ml). To one set was added Ht-preHNE (at indicated concentrations) and the other DMSO in the dark. In cases where inhibition of Akt was analysed, another set of fish embryos were treated with the designated concentrations of the inhibitor. Fish were maintained at 28 °C in the dark for 28 h after which time fish were washed in 10% Hank’s solution with no methylene blue (3 times with 30 min in between each wash). After this time fish were moved to 6-well plates. The two sets of embryos for T-REX were exposed to UV light for 5 min. Embryos were left for 5 h after which time they were placed on ice. Embryos were then screened for expression of fluorescence and those expressing the fluorescence reporter were imaged using confocal microscopy on a Leica 710 microscope using a 10X water lens with 1.7-fold magnification. 5–6 embryos were imaged each set and around 9–15 z-stacks were taken each time. Fish were irradiated with 458 nm laser and YFP and CFP emission fluorescence was collected with band pass emission filters (525–620 nm and 463–498 nm, respectively). CFP and YFP fluorescence was quantified using Image-J taking the signals of the surrounding area as a local background in a procedure similar to the established ratio image generation method in zebrafish28. Around 250 separate cells were quantified for each condition.
Whole-mount IF
Fish were treated as described. Approximately 24 hpf, they were dechorionated and fixed in 4% PFA for 24–48 h with gentle rocking at 4°C. After this time, PFA was removed and replaced with methanol and stored at −20°C for 24 h. Fish were then washed 2 times with PBS-0.1%Tween-1%DMSO for 30 min each, then blocked in 10% FBS/2% BSA in PBS-0.1%Tween, then stained with the appropriate primary antibody overnight at 4°C in blocking buffer, then washed 2×(30 min) and stained with the appropriate fluorescent secondary antibodies for 1.5 h at rt. Fish were imaged on 2% agarose plates either on a Zeiss LSM700 confocal microscope or a Leica M205-FA equipped with a stereomicroscope.
Biotin azide pull down from fish
Around 250–300 zebrafish embryos injected with the designated mRNA and treated under T-REX condition (see METHODS in main manuscript) were manually dechorinated and deyolked immediately post UV irradiation at 4 °C. The embryos were washed 3X with 50 mM HEPES (pH 7.6) to remove residual yolk proteins. The embryos were lysed in 100 μL of lysis buffer containing in final concentrations 50 mM HEPES (pH 7.6), 150 mM NaCl, 1% Nonidet P-40, 0.3 mM TCEP and 2X Roche cOmplete, mini, EDTA-free protease inhibitor (Roche Life Sciences), 0.2 mg/mL soybean trypsin inhibitor by rapid freeze-thaw (x3) and vortexing with zirconia beads (Bio spec 0.7 mm beads; 11079107zx). Lysate was clarified by centrifugation at 18,000× g for 8 min at 4 °C. Total protein concentration was determined using Bradford assay using BSA as a standard. TEV protease at a final concentration of 0.2 mg/mL was added to the lysate and incubated at 37 °C for 45 min. The lysate was subsequently diluted to 2 mg/mL with a buffer made up of 50 mM HEPES (pH 7.6), 0.3 mM TCEP, and 2X Roche protease inhibitor and subjected to Click reaction [1% SDS, 5% t–BuOH, 200 μM Biotin azide, 2 mM TCEP, 0.9 mM CuSO4 and 0.1 mM Cu(TBTA)] for 30 min at 37 °C. Click reaction condition and subsequent pull down protocol is identical to that reporter above for mammalian cells.
qRT-PCR analyses in fish extracts
qRT-PCR analysis was performed as previously described10. Briefly, 7–10 fish embryos (24 hpf) were homogenized in 1 mL TRIzol by vortexing with glass beads for 2 min. Total RNA was extracted and purified using TRIzol® Plus RNA Purification kit (Life Technologies, 1218355) per manufacturer’s suggestion. Around 600 ng of the total isolated RNA was reverse transcribed using SuperScript® III Reverse Transcriptase (Life Technologies, 18080093). qRT-PCR analysis was performed with iQ™ SYBR® Green Supermix (Bio-Rad, 170-8880) on a MyiQ™ Single-Color Real-Time PCR Detection System (Bio-Rad, 170-9740). In a total volume of 20 μL the PCR reaction mix contained, in final concentrations, 1X iQ™ SYBR® Green Supermix, 0.35 μM each of the forward and reverse primers and 20 ng of template cDNA. The qPCR program was set for 3 min at 95 °C followed by 45-repeat cycles comprising heating at 95 °C for 10 s and at 55 °C for 30 s. The expected products were of ~100–150 bp in size. The primers used for each gene are specified in Supplementary Table 1. All primers were validated as specified previously10.
Immunofluorescence
Cells were grown to 70% confluence in 35 mm glass-bottomed dishes and transfected with HaloTagged Akt plasmids. T-REX was performed as mentioned above. 8–10 h post irradiation with UV light, cells were fixed by adding freshly prepared solution of 2.5% formaldehyde in 1X DPBS (or for FOXO translocation assays, methanol at −20 °C for 25 min) and incubating at 4 °C for 20 min (Fresh formaldehyde was prepared by cracking paraformaldehyde at 60 °C in 1X DPBS while swirling on a rotovap without vacuum). 12 M NaOH was added slowly till the paraformaldehyde completely dissolved. The solution was brought to pH 7.5 with HCl). The fixative was aspirated and the cells washed three times with 1X DPBS with 5-min incubation at room temperature. Blocking and permeabilization was performed in one-step by incubation at 37 °C for 1 h in 1X DPBS containing 3% BSA and 0.2% Triton X-100. Cells were subsequently incubated with anti-Halo antibody (1:300) in incubation buffer (1% BSA, 0.02% Triton X-100 in 1X DPBS) for 2 h at room temperature. Cells were rinsed 3 times with 1X DPBS with 5 min incubation for each wash and subsequently incubated in dark for 1 h at room temperature with anti-Rabbit IgG AlexaFluor® 647 (1:1000) in incubation buffer. Cells were rinsed 3 times with 1X DPBS with 5 min incubation for each wash. DAPI (Sigma) was freshly prepared in 1X DPBS from 2 mg/mL wt./v stock solution in water and added to the wells at the final concentration of 0.2 μg/mL. The samples were incubated in the dark for 1 min and washed once with 1X DPBS and stored in the dark till images were taken using a Zeiss LSM 710 meta confocal fluorescence microscope. Image analysis was performed using Image-J (NIH).
Live-cell Imaging
Cells were grown to 70% confluence in 35 mm glass-bottomed dishes and transfected with HaloTagged Akt plasmids. 24 h post-transfection, cells were incubated in dark at 37 °C incubator with 3 μM HaloTMR® ligand for 3 h in serum free media. Subsequently cells were washed 3 times with serum free media and incubated for 30 min with complete media containing, in final concentration, 1 μg/mL Hoechst 33258 dye (Thermo Scientific). Cells were rinsed 2 times with complete media and imaged using a Zeiss LSM 710 meta confocal fluorescence microscope. Image analysis was performed using Image-J (NIH).
Data analysis
Data were analysed using Graphpad Prism v-6.0f. Western blot and fluorescence gel quantitation were performed using BioRad Image Lab software (v-4.1). Data are presented as mean +/− s.d or s.e.m as indicated. A two-tailed unpaired t-test was used to determine differences between control and experimental samples. A p-value of <0.05 was considered significant. p-values are either explicitly stated on each bar or denoted with an asterisk (*). In all figures, n.s = non-significant, * p < 0.05, ** p < 0.01, *** p< 0.001 and **** p < 0.0001. No statistical tool was used to pre-determine sample size. The sample size “n” for each condition and the number of biological and technical repeats performed for each experiment are mentioned in the figure legends. No blinding was used for the animal experiments. No samples or animals were excluded from analysis.
Supplementary Material
Acknowledgments
We thank Professor Joe Fetcho and Brian Miller (Cornell University) for scientific and technical guidance on zebrafish studies, Professor Jin Zhang and JHU for providing AktAR reporter plasmid, and Mr. Jesse Poganik for his initial contributions to zebrafish studies, NIH-New-Innovator (1DP2GM114850), Beckman Young Investigator, NSF CAREER (CHE-1351400), Burroughs Wellcome CRTG, and Sloan Fellowship programs (to Y.A.) for research support, zebrafish husbandry and microinjection/imaging facility (NIH R01 NS026539, PI: J. Fetcho), Cornell NMR facility (NSF MRI: CHE-1531632, PI: Y. Aye), Cornell Imaging Center (NIH 1S10RR025502, PI: R. M. Williams), Cornell proteomics and MS facility (NIH SIG grant 1S10RR025449-01) for instrumentation, and HHMI predoctoral fellowship (59108350, to S.P.) and Hill undergraduate fellowship (to S.L.S.) for student support.
Footnotes
Additional information/Data availability statement
Any supplementary information, chemical compound information and source data are available in the online version of the paper.
Author Contributions
M.J.C.L., S.P. and Y.A. designed the experiments. M.J.C.L. performed in vivo experiments in fish embryos. S.P. and M.J.C.L. performed cell-based experiments and collected the biochemical data from fish samples. Y.Z. and Y.W. performed chemical synthesis. S.L.S. assisted M.J.C.L. and S.P. with gene cloning and protein purification. S. Z. assisted in LC-MS/MS data collection and analysis. M.J.C.L., S.P., and Y.A. analyzed and interpreted the data. Y. A. wrote the paper with editing contributions from M.J.C.L. and S.P.
Competing financial interests
The authors declare no competing financial interests.
Supplementary information. Supplementary Tables 1–4. Supplementary Figures 1–18.
References
- 1.Lanning BR, et al. A road map to evaluate the proteome-wide selectivity of covalent kinase inhibitors. Nat Chem Biol. 2014;10:760–7. doi: 10.1038/nchembio.1582. [DOI] [PMC free article] [PubMed] [Google Scholar]
- 2.Cohen P. Protein kinases-the major drug targets of the twenty-first century? Nat Rev: Drug Discov. 2002;1:309–315. doi: 10.1038/nrd773. [DOI] [PubMed] [Google Scholar]
- 3.Dar AC, Shokat KM. The evolution of protein kinase inhibitors from antagonists to agonists of cellular signaling. Annu Rev Biochem. 2011;80:769–95. doi: 10.1146/annurev-biochem-090308-173656. [DOI] [PubMed] [Google Scholar]
- 4.Gonzalez E, M T. The Akt kinases: isoform specificity in metabolism and cancer. Cell cycle. 2009;8:2502–2508. doi: 10.4161/cc.8.16.9335. [DOI] [PMC free article] [PubMed] [Google Scholar]
- 5.Mochly-Rosen D, Gordon AS. Anchoring proteins for protein kinase C: a means for isozyme selectivity. The FASEB Journal. 1998;12:35–42. [PubMed] [Google Scholar]
- 6.Tsai YH, Essig S, James JR, Lang K, Chin JW. Selective, rapid and optically switchable regulation of protein function in live mammalian cells. Nat Chem. 2015;7:554–61. doi: 10.1038/nchem.2253. [DOI] [PMC free article] [PubMed] [Google Scholar]
- 7.Long MJ, Poganik JR, Aye Y. On-Demand Targeting: Investigating Biology with Proximity-Directed Chemistry. J Am Chem Soc. 2016;138:3610–22. doi: 10.1021/jacs.5b12608. [DOI] [PMC free article] [PubMed] [Google Scholar]
- 8.Gunning P, Weinberger R, J P, Hardeman E. Isoform sorting and the creation of intracellular compartments. Annu Rev Cell Dev Biol. 1998;14:339–372. doi: 10.1146/annurev.cellbio.14.1.339. [DOI] [PubMed] [Google Scholar]
- 9.Mann M, Jensen ON. Proteomic analysis of post-translational modifications. Nat Biotechnol. 2003;21:255–261. doi: 10.1038/nbt0303-255. [DOI] [PubMed] [Google Scholar]
- 10.Parvez S, et al. Substoichiometric hydroxynonenylation of a single protein recapitulates whole-cell-stimulated antioxidant response. J Am Chem Soc. 2015;137:10–3. doi: 10.1021/ja5084249. [DOI] [PMC free article] [PubMed] [Google Scholar]
- 11.Lin HY, Haegele JA, Disare MT, Lin Q, Aye Y. A generalizable platform for interrogating target- and signal-specific consequences of electrophilic modifications in redox-dependent cell signaling. J Am Chem Soc. 2015;137:6232–44. doi: 10.1021/ja5132648. [DOI] [PMC free article] [PubMed] [Google Scholar]
- 12.Schopfer FJ, Cipollina C, Freeman BA. Formation and signaling actions of electrophilic lipids. Chem Rev. 2011;111:5997–6021. doi: 10.1021/cr200131e. [DOI] [PMC free article] [PubMed] [Google Scholar]
- 13.Wang C, Weerapana E, Blewett MM, Cravatt BF. A chemoproteomic platform to quantitatively map targets of lipid-derived electrophiles. Nat Methods. 2014;11:79–85. doi: 10.1038/nmeth.2759. [DOI] [PMC free article] [PubMed] [Google Scholar]
- 14.Jacobs AT, Marnett LJ. Systems Analysis of Protein Modification and Cellular Responses Induced by Electrophile Stress. Acc Chem Resh. 2010;43:673–683. doi: 10.1021/ar900286y. [DOI] [PMC free article] [PubMed] [Google Scholar]
- 15.Parvez S, et al. T-REX™ On-demand redox targeting: a toolset for functional discoveries and validations. Nat Protoc. 2016;11:2328–2356. doi: 10.1038/nprot.2016.114. [DOI] [PMC free article] [PubMed] [Google Scholar]
- 16.Fang X, et al. Temporally controlled targeting of 4-hydroxynonenal to specific proteins in living cells. J Am Chem Soc. 2013;135:14496–9. doi: 10.1021/ja405400k. [DOI] [PMC free article] [PubMed] [Google Scholar]
- 17.Manning BD, Cantley LC. AKT/PKB signaling: navigating downstream. Cell. 2007;129:1261–74. doi: 10.1016/j.cell.2007.06.009. [DOI] [PMC free article] [PubMed] [Google Scholar]
- 18.Dummler B, Hemmings BA. Physiological roles of PKB/Akt isoforms in development and disease. Biochem Soc Trans. 2007;35:231–235. doi: 10.1042/BST0350231. [DOI] [PubMed] [Google Scholar]
- 19.Wani R, et al. Isoform-specific regulation of Akt by PDGF-induced reactive oxygen species. Proc Natl Acad Sci USA. 2011;108:10550–10555. doi: 10.1073/pnas.1011665108. [DOI] [PMC free article] [PubMed] [Google Scholar]
- 20.Tschopp O, et al. Essential role of protein kinase B gamma (PKB gamma/Akt3) in postnatal brain development but not in glucose homeostasis. Development. 2005;132:2943–54. doi: 10.1242/dev.01864. [DOI] [PubMed] [Google Scholar]
- 21.Poduri A, et al. Somatic activation of AKT3 causes hemispheric developmental brain malformations. Neuron. 2012;74:41–8. doi: 10.1016/j.neuron.2012.03.010. [DOI] [PMC free article] [PubMed] [Google Scholar]
- 22.Chen CT, Green JT, Orr SK, Bazinet RP. Regulation of brain polyunsaturated fatty acid uptake and turnover. Prostaglandins Leukot Essent Fatty Acids. 2008;79:85–91. doi: 10.1016/j.plefa.2008.09.003. [DOI] [PubMed] [Google Scholar]
- 23.Akbar M, Calderon F, Wen Z, Kim H-Y. Docosahexaenoic acid: A positive modulator of Akt signaling in neuronal survival. Proc Natl Acad Sci USA. 2005;102:10858–10863. doi: 10.1073/pnas.0502903102. [DOI] [PMC free article] [PubMed] [Google Scholar]
- 24.Gao X, Zhang J. Spatiotemporal Analysis of Differential Akt Regulation in Plasma Membrane Microdomains. Mol Biol Cell. 2008;19:4366–4373. doi: 10.1091/mbc.E08-05-0449. [DOI] [PMC free article] [PubMed] [Google Scholar]
- 25.Zhou BP, et al. HER-2/neu blocks tumor necrosis factor-induced apoptosis via the Akt/NF-kappaB pathway. J Biol Chem. 2000;275:8027–31. doi: 10.1074/jbc.275.11.8027. [DOI] [PubMed] [Google Scholar]
- 26.Dudek H, et al. Regulation of neuronal survival by the serine-threonine protein kinase Akt. Science. 1997;275:661–5. doi: 10.1126/science.275.5300.661. [DOI] [PubMed] [Google Scholar]
- 27.Papa A, et al. Cancer-associated PTEN mutants act in a dominant-negative manner to suppress PTEN protein function. Cell. 2014;157:595–610. doi: 10.1016/j.cell.2014.03.027. [DOI] [PMC free article] [PubMed] [Google Scholar]
- 28.Kardash E, Bandemer J, Raz E. Imaging protein activity in live embryos using fluorescence resonance energy transfer biosensors. Nat Protoc. 2011;6:1835–46. doi: 10.1038/nprot.2011.395. [DOI] [PubMed] [Google Scholar]
- 29.Long MJC, Aye Y. The Die Is Cast: Precision Electrophilic Modifications Contribute to Cellular Decision Making. Chem Res Toxicol. 2016;29:1575–1582. doi: 10.1021/acs.chemrestox.6b00261. [DOI] [PMC free article] [PubMed] [Google Scholar]
- 30.Liew WC, Orbán L. Zebrafish sex: a complicated affair. Brief Funct Genomics. 2014;13:172–187. doi: 10.1093/bfgp/elt041. [DOI] [PMC free article] [PubMed] [Google Scholar]
- 31.Kolb HC, Finn MG, Sharpless KB. Click chemistry: diverse chemical function from a few good reactions. Angew Chem Int Ed Engl. 2001;40:2004–2021. doi: 10.1002/1521-3773(20010601)40:11<2004::AID-ANIE2004>3.0.CO;2-5. [DOI] [PubMed] [Google Scholar]
- 32.Yang Y, Thannhauser TW, Li L, Zhang S. Development of an integrated approach for evaluation of 2-D gel image analysis: impact of multiple proteins in single spots on comparative proteomics in conventional 2-D gel/MALDI workflow. Electrophoresis. 2007;28:2080–94. doi: 10.1002/elps.200600524. [DOI] [PubMed] [Google Scholar]
- 33.Yang Y, et al. Evaluation of different multidimensional LC-MS/MS pipelines for isobaric tags for relative and absolute quantitation (iTRAQ)-based proteomic analysis of potato tubers in response to cold storage. J Proteome Res. 2011;10:4647–60. doi: 10.1021/pr200455s. [DOI] [PubMed] [Google Scholar]
- 34.Hochrainer K, Racchumi G, Zhang S, Iadecola C, Anrather J. Monoubiquitination of nuclear RelA negatively regulates NF-kappaB activity independent of proteasomal degradation. Cell Mol Life Sci. 2012;69:2057–73. doi: 10.1007/s00018-011-0912-2. [DOI] [PMC free article] [PubMed] [Google Scholar]
Associated Data
This section collects any data citations, data availability statements, or supplementary materials included in this article.