Abstract
Purpose
Adaptive optics scanning light ophthalmoscopy (AOSLO) has enabled quantification of the photoreceptor mosaic in the living human eye using metrics such as cell density and average spacing. These rely on the identification of individual cells. Here, we demonstrate a novel approach for computer-aided identification of cone photoreceptors on nonconfocal split detection AOSLO images.
Methods
Algorithms for identification of cone photoreceptors were developed, based on multiscale circular voting (MSCV) in combination with a priori knowledge that split detection images resemble Nomarski differential interference contrast images, in which dark and bright regions are present on the two sides of each cell. The proposed algorithm locates dark and bright region pairs, iteratively refining the identification across multiple scales. Identification accuracy was assessed in data from 10 subjects by comparing automated identifications with manual labeling, followed by computation of density and spacing metrics for comparison to histology and published data.
Results
There was good agreement between manual and automated cone identifications with overall recall, precision, and F1 score of 92.9%, 90.8%, and 91.8%, respectively. On average, computed density and spacing values using automated identification were within 10.7% and 11.2% of the expected histology values across eccentricities ranging from 0.5 to 6.2 mm. There was no statistically significant difference between MSCV-based and histology-based density measurements (P = 0.96, Kolmogorov-Smirnov 2-sample test).
Conclusions
MSCV can accurately detect cone photoreceptors on split detection images across a range of eccentricities, enabling quick, objective estimation of photoreceptor mosaic metrics, which will be important for future clinical trials utilizing adaptive optics.
Keywords: adaptive optics, non-confocal split detection, cell detection, image analysis, multiscale circular voting
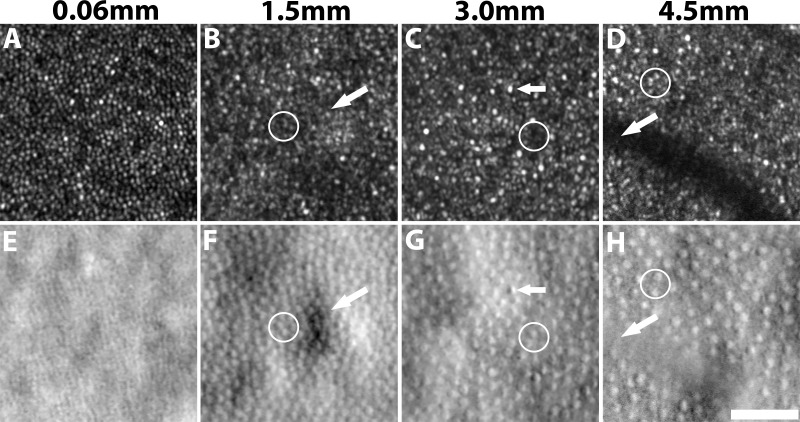
Adaptive optics scanning light ophthalmoscopy (AOSLO),1–6 a type of adaptive optics (AO) ophthalmoscopy,7–9 has enabled the visualization of individual retinal cells, such as cone photoreceptors, directly in the living human eye. Analyzing the state of the cone photoreceptor mosaic during disease onset and progression is important not only for understanding the cellular nature of retinal diseases, but also for more rapidly evaluating the efficacy of treatments.9,10 Thus far, the majority of cone photoreceptor imaging has been performed using confocal AOSLO1–6 or flood-illumination AO7,11,12 in which single scattered light is captured. To date, relatively few image analysis tools have been developed for AOSLO modalities that utilize multiple scattered light,13–15 such as nonconfocal split detection.16 In this paper, we will focus specifically on nonconfocal split detection,16 which is distinct from split detection that includes the confocal portion of the signal.17 Split detection is particularly valuable for cone analysis in eccentric locations because the corresponding confocal reflectance images (hereinafter referred to as “confocal”) often contain areas where the presence of cones is ambiguous (Fig. 1). This ambiguity arises from the possibility of not always having a one-to-one correspondence between reflections from cones in the confocal channel and their corresponding cones visible in the split detection channel (white circles, Figs. 1D, 1H), or from the presence of rod photoreceptors, which could be misidentified as cone photoreceptors (white circles, Figs. 1B, 1F). It is known that cone photoreceptors sometimes appear dark on the confocal modality,18–21 which can hinder their identification (white circles, Fig. 1C, 1G). Thus, split detection images are typically preferred over confocal images for eccentric cone identification. The limitation of current split detection imaging is that cone photoreceptors are difficult to distinguish at or near the fovea (Fig. 1E). This work aims to develop an approach for computer-aided analysis of cone photoreceptors on split detection AOSLO images.
Figure 1.
Confocal reflection (top) and split detection (bottom) AO images captured simultaneously at eccentricities of 0.06, 1.5, 3.0, and 4.5 mm from subject 7. Cone density decreases with increasing eccentricities (left to right). Cone photoreceptors are more easily identifiable on the confocal image near the fovea in (A) when compared to its corresponding split detection image (E). In contrast, cone photoreceptors are more reliably identifiable at eccentric locations in split detection images (white circles). Challenges for automated cone identification on split-detection images include irregular light illuminance (white arrow, F), opposite intensity extremes within a cone (white arrow, G), and vascular shadows (white arrow, H). Scale bar: 50 μm.
A prerequisite for quantifying cone photoreceptor mosaic metrics such as density and spacing is accurate cone identification, which is both tedious and time-consuming when performed manually. Existing approaches to automate this step have been mainly focused on image analysis on confocal and flood-illumination AO images, based on local maximum intensity value identification,22 graph theory, and dynamic programming,23 circle Hough transform,24 or automated detection of the radius of Yellott's ring.25 Unfortunately, differences in the appearance of split detection and confocal modalities prevent the direct application of these existing approaches to nonconfocal images. Individual cones tend to have an intensity pattern resembling a Gaussian profile in confocal AO images (Figs. 1A–D). However, in the case of split detection, the intensity pattern corresponding to a single cell is more similar to Nomarski differential interference contrast microscopy26 in which pairs of dark and bright regions are present in a consistent orientation across the entire image (Figs. 1E–H). In this paper, we demonstrate an automated algorithm to identify cone photoreceptors on split detection images. This identification algorithm is the first step toward automated computation of additional structural descriptive metrics27 for assessing the cone mosaic.
Cone photoreceptors visualized using split detection AOSLO images have several unique features that can hinder automated cone identification, including irregular light illuminance of the local surrounding tissue (arrow, Fig. 1F), opposing intensity extremes within a cone (arrow, Fig. 1G) and anisotropic contrast at cell boundaries. Moreover, image regions at vascular shadows (arrow, Fig. 1H) often contain unreliable image information. Finally, variations in the size and density of individual cones depending on the eccentricity can require an adaptive algorithm to handle these differences, which is known as the scale-selection problem in the field of computer vision.28 In our previous work utilizing AO images from multiple eccentricities, we showed that the optimal scale can be determined locally according to multiscale circular voting (MSCV).29 In this paper, we further extend upon this MSCV approach29 by: (1) introducing a new MSCV algorithm for identifying and connecting dark and bright region pairs within each cone photoreceptor; (2) refining cone positions by incorporating size estimations derived from a multiscale strategy for region size determination; and (3) extending the identification results to quantitative analysis of density and spacing across different retinal eccentricities with comparisons to histology26 and existing published data.27,30–33
Methods
Data Collection
Research procedures adhered to the tenets of the Declaration of Helsinki and were approved by the Institutional Review Board of the National Institutes of Health. Written informed consent was obtained after the nature of the research and possible consequences of the study were explained to the subjects.
A custom-assembled AOSLO with split detection capability2,16 was used to image 10 subjects with no history of systemic or ocular disease (three female, seven male; age range, 20–41 years; mean ± SD, 28.3 ± 6.8 years; additional information in Supplementary Table S1). Two wavelengths were used: 790 nm for retinal imaging and 850 nm for wavefront sensing. The powers measured at the cornea were less than 130 and 25 μW, respectively, which were less than the maximum permissible exposure set by the American National Standards Institute standard Z136.1 2014.34 Prior to imaging, both eyes were dilated with 2.5% phenylephrine hydrochloride and 1% tropicamide. The eye that subjectively yielded better image sharpness in the confocal imaging channel was selected at the start of each imaging session. A computer-controlled fixation system35 was used to assist with the video acquisition at various overlapping retinal locations from the fovea out to an eccentricity of approximately 6 mm in the temporal direction. Videos were acquired using multiple square fields of view (FOV) corresponding to approximately 0.23, 0.30, and 0.45 mm on the retina. The largest FOV was used to more efficiently connect all imaging areas with sufficiently overlapping areas, important for montaging the collected videos for determination of retinal eccentricity. Smaller FOVs, which were acquired at selected regions and registered to the larger FOVs, were utilized for cone identification because they contained higher sampling. We recruited 5 out of 10 subjects for a short acquisition protocol (less than 50 videos total, acquired near the fovea and at select eccentric retinal locations); the remaining five were recruited for an extended acquisition protocol (over 100 videos, acquired near the fovea and along a continuous strip of retinal eccentricities). In order to capture a more representative dataset containing varying levels of image quality, the first 10 subjects to successfully complete either the short or long imaging protocols were used for this study. Since the primary goal of this study was to demonstrate the capabilities of the MSCV algorithm, a sample size of 10 subjects was deemed sufficient and the power of this study was not calculated (to reach the desired sample size, 12 subjects were recruited, with two excluded due to unsuccessful imaging sessions: one due to excessive eye motion and the other due to an inability to sit still due to frequent coughing).
Raw videos were preprocessed by correcting for eye motion,36 and then averaged and assembled into montages that included both confocal and split detection images. For the purposes of measuring retinal eccentricity, the fovea was manually determined based on a subjective search for the retinal region with the highest cone density on the confocal images. The retinal scaling factor for conversion from degrees to millimeters was computed using a paraxial ray trace on a three surfaced simplified model eye37 using the subject's biometric information (axial length, corneal curvature, and anterior chamber depth) measured using a commercial device (IOLMaster; Carl Zeiss Meditec, Dublin, CA, USA).
Automated Cone Identification
An automated cone identification algorithm was developed, consisting of four main steps: multiscale circular voting, region size determination, point pair connection, and centering. Detailed descriptions of the algorithm are provided in the Appendix.
Step 1: Multiscale Circular Voting
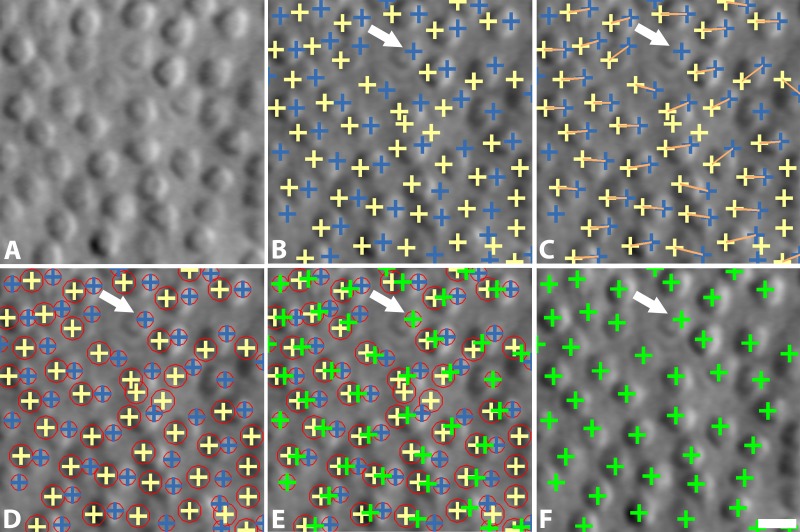
The goal of this step is to detect bright and dark regions within cone photoreceptors (blue and yellow crosses in Fig. 2B) by identifying circular objects using a combination of iterative circular voting38 and a multiscale strategy which permits variations in the sizes of cone photoreceptors (Fig. 1).
Figure 2.
Overview of cone photoreceptor identification algorithm on split detection AOSLO images. (A) Original image; (B) MSCV of dual intensity extreme regions in each individual cell (blue and yellow crosses); (C) point pair connections (orange lines); (D) region size determination, denoted by red circles; (E) identification centering; (F) final cone identifications (green crosses). The white arrow indicates a cone photoreceptor without a point pair connection. Scale bar: 10 μm.
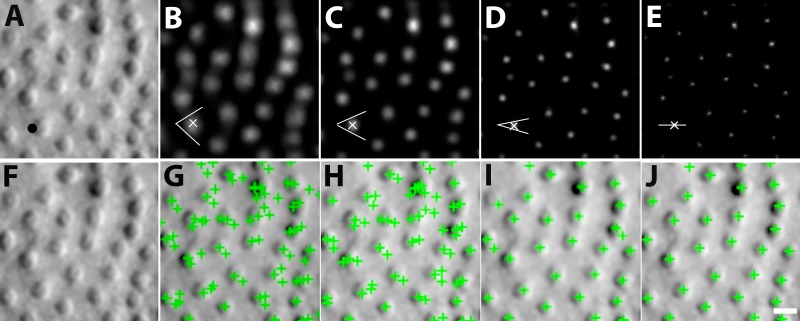
MSCV begins with an iterative, coarse-to-fine search process. First, for a given starting point with large image gradient magnitude (Fig. 3A), an angular search range of the voting area is cast (white lines in Figs. 3B–E). The actual voting area is a trapezoidal arc (Equation A.3, Fig. A1). The MSCV response is computed within the trapezoidal voting area by convolving image gradient magnitudes with a Gaussian function (Equation A4). Wherever there is radial symmetry (as in the case of circular cells), MSCV responses from different voting areas accumulate in the centers of concave objects (gray/white spots in Figure 3B–E; see also Fig. A2). Note that the MSCV responses correspond to centers of bright and dark regions within photoreceptor cells, which are different than the actual center of the photoreceptor cell, which will be addressed in Step 4. By iteratively shrinking the angular search range, the MSCV response gradually converges to the region centers (Fig. 3E).
Figure 3.
Process of MSCV. From left to right: original image, followed by MSCV response image of bright regions after each iteration (top row); their corresponding cone identifications (bottom row). Note that MSCV response gradually converges to the cell region center due to coarse-to-fine strategy controlled by decreasing the voting angle range at cell boundaries after each iteration. Meanwhile, the number of false positives gradually drop, and true identifications are eventually found. The black dot in (A) represents an example boundary point at which the algorithm begins, with white lines denoting the shrinking voting ranges at various steps within the iteration. White x's are image points with maximal MSCV responses in each iteration pertaining to the voting area that is marked with the white lines. Scale bar: 10 μm.
Next, this entire process is repeated across different scales (Equation A1). Here, it is important to determine what a reasonable radius is for the angular search range. If it is too small, the MSCV response at the region center cannot accumulate enough high image gradient magnitudes; if it is too large, image information from other cells will be improperly attributed to each cell's response calculations. To search for a reasonable radius, we determine the MSCV response across a sequence of search radii, and then search for the radii that result in the maximal MSCV response. Specifically, the sequence of search radii generates point clusters which are then converted into a connected image patch using the morphologic dilation shape operator.39 Maximal MSCV responses are then determined for each connected patch (generally each patch corresponds to a single cone photoreceptor). The radius that generated this maximal MSCV response is then selected and assumed to be reasonable.
Step 2: Point Pair Connection
This step connects the bright and dark regions within each of the cells, according to the following criteria: (1) dark region centers are always on the left of bright ones (yellow and blue crosses, respectively in Fig. 2C); and (2) their distance is less than the expected maximum cone radius (4.5 μm in our datasets which is consistent with what has been reported in histology40). If there are multiple possibilities for region pairs, the one with the smallest distance is selected. Some cells contained only a single detection (white arrow, Fig. 2C; approximately 20% of all cells in our validation datasets). The strategy for the identification of unpaired cells is described in Step 4.
Step 3: Region Size Determination
In addition to identifying the dual region centers, the multiscale strategy is also important for determining the sizes of each region, which are used in the subsequent step to determine the final positioning of each identification. This step utilizes the local image structure and a scale-invariant image operator to perform optimal scale selection (based on scale-space theory).28
Scale selection is initiated by constructing a one-parameter family of smoothed images based on a scale parameter (Equation A8). Within this multiscale representation of the original image, the scale parameter is treated as the additional continuous variable. According to the scale selection theory,28 the optimal scale is determined by searching for local extrema of a scale-invariant image operator such as the scale-normalized Laplacian operator41,42 (Equation A10). This step outputs circles representing the scale of each identified region which is approximately equivalent to its size (Fig. 2D).
Step 4: Centering
The final position of each identified cone photoreceptor is determined by taking the weighted average of their point pairs from Step 2, where weights are defined as their optimal scales from Step 3. By using a weighted average to determine cell centers (Equation A11) the final identification can be placed closer to the centers of each cell (Fig. 2F). For any unpaired cells (white arrows, Fig. 2), we only keep single identifications from bright regions. In this case, the scale-normalized Laplacian operator is used to locally adjust the locations of the single identifications by moving positions until Laplacian value achieves the local extrema in the multiscale image space, as demonstrated in our previous approach.29
Quantitative Analysis of Cone Photoreceptor Cell Identifications
Averaged split detection images were assembled into a montage of overlapping retinal regions. The montage was used only to guide the selection of regions of interest (ROI) for cone mosaic analysis at different eccentricities. In order to avoid distortion artifacts due to the use of overlapping images that were calculated from different reference frames,43 each ROI was fully contained within a single image of the montage. The sizes of ROIs were set to 55 × 55 μm for eccentricities less than 3 mm and 100 × 100 μm otherwise. Voronoi diagrams were constructed for each ROI using detected points except for those that generated Voronoi neighborhoods that exceeded the boundary of the ROI. Cone density was then computed by dividing the number of cones by the total area of the Voronoi neighborhoods.44 Cone spacing was estimated according to a previously developed implementation27 based on the density recovery profile.45,46
Validation of Identification Accuracy Across Different Eccentricities
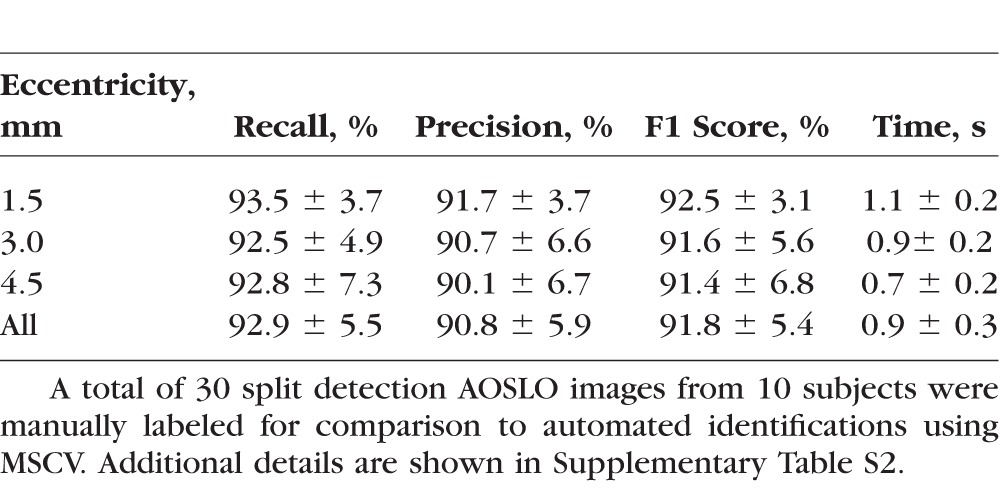
Thirty images were selected at the temporal eccentricities of 1.5, 3.0, and 4.5 mm from all 10 subjects (Supplementary Table S1). These eccentricities were selected to evaluate the robustness of MSCV, since cone density varies substantially across these three eccentricities (Fig. 1). For validation purposes, ROIs of 440 × 440 pixels were generated for all images. To generate ground truth, cone photoreceptors were manually labeled by the same grader in all selected images. In order to evaluate the accuracy of automated identifications in comparison to ground truth, recall, precision, and F1 score were computed (commonly used for the evaluation of cell identification accuracy47). These metrics range from 0 to 1, where low values indicate poor matching between automatic cone identifications compared to ground truth, and high values indicate good matching.
 |
Here, TP refers to the true positive of cone identification; FP, false positive; and FN, false negative.
Image quality plays an important role on the identification accuracy. However, there are currently no strategies for objectively evaluating the image quality of split detection images. Here, we propose the use of anisotropy to objectively evaluate image quality.48 In brief, this method assumes that high-quality images contain dominant directions of information content, and therefore applies a pseudo-Wigner distribution to measure a pixel-wise entropy along different directions. Anisotropy is defined as the standard deviation of entropy values (normalized from 0 to 1). Larger anisotropy values indicate the presence of dominant directions interpreted to mean higher-quality images. We used this approach to objectively assess split detection images for interpretation of our accuracy results, based on the assumption that high-quality split detection images have high contrast along the horizontal direction.
Validation of Spacing and Density Metrics Computed From Automated Identifications
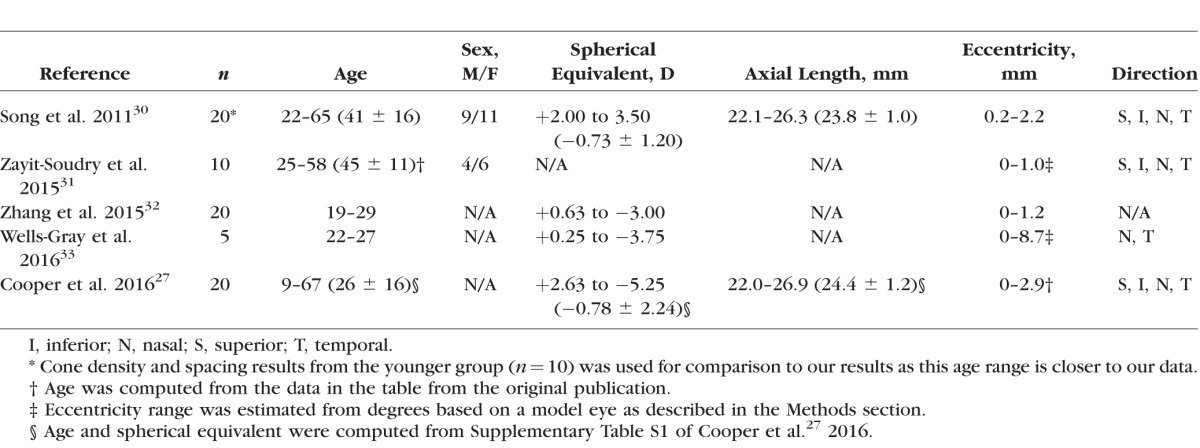
Cone photoreceptors were difficult to visualize near the fovea in split detection images (Fig. 1E). Thus, 146 ROIs were selected from 5 subjects undergoing the extended-period protocol at eccentricities ranging from approximately 0.4 to 6.0 mm along the temporal direction (Supplementary Table S1). ROIs were used to compute cone density and spacing based on MSCV-derived cone identifications for direct comparison to previously published adaptive-optics-based measurements in normal subjects (Table 1). In addition, the relative error between MSCV-derived measurements and histology was computed by first averaging both density and spacing measurements every 0.3 mm and then by computing the relative error,  .
.
 |
Here,  refers to the index of selected eccentricities,
  is the averaged MSCV-based cone density or spacing at eccentricity corresponding to the index
  , and
, and  is the corresponding histology value. The Kolmogorov-Smirnov 2-sample test was also used to evaluate whether there were any differences between MSCV-based density measurements and histology.
Table 1.
AO-Based Normal Databases for Cone Density and Spacing
Comparison Between Automated Cone Identification From Confocal and Split Detection Images
Five pairs of simultaneously acquired confocal and split detection images were selected from five subjects and independently analyzed using automated identification algorithms (Supplementary Table S1). For each subject, the largest ROI that contained an unambiguous cone mosaic and relatively constant cone density on both the confocal and the split detection channels was selected, which was empirically 400 × 400 pixels in size at an eccentricity of about 0.75 mm (average ± standard deviation: 0.73 ± 0.09 mm). At this location, confocal images contain relatively few rods and split detection images start to have clear cell boundaries (between the eccentricities shown in Figs. 1A, 1E and Figs. 1B, 1F). A previously developed automated cone identification algorithm was used to analyze the confocal images22 for direct comparison to MSCV-based analysis of the corresponding split detection image. Recall, precision, and F1 score were again used to evaluate consistency. We also compared cone spacing and density measurements from two image modalities.
Results
High Identification Accuracy Across Different Eccentricities
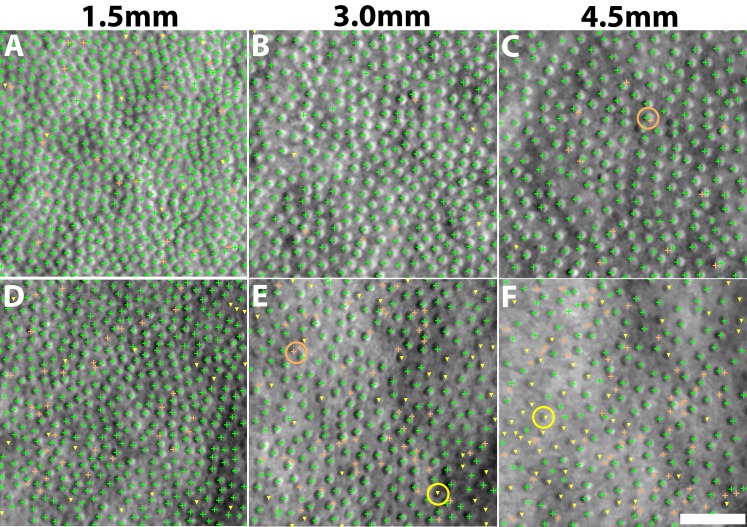
MSCV accurately detected cone photoreceptors in five subjects with average recall, precision, and F1 score of 92.9%, 90.8%, and 91.8% (Fig. 4; Table 2). The average computational time was 0.9 seconds on the image of 440 × 440 pixels (Supplementary Table S2; overall, it was faster with increasing eccentricities). On average, there was no clear difference in accuracy across the three eccentricities tested. Identification accuracy was higher in the case of better image quality (subject 2, Figs. 4A–C) but lower in the subject with the worst image quality, due to a higher rate of false negatives (subject 3, Figs. 4D–F). Image quality assessment based on anisotropy also confirmed that detection accuracy was more likely to be higher on images with larger assessment values (Supplementary Figs. 1, 2). False negatives were likely due to weak cell boundaries (yellow marks in Figs. 4E, 4F). False positives were mostly attributed to either areas of unusually high brightness leading to multiple identifications within one region (orange circle in Fig. 4C), and/or irregularities in the areas between cones, possibly caused by a weak rod photoreceptor signal (orange circle in Fig. 4E). Artificial boundaries created by multiple nearby photoreceptors in close proximity to each other also gave rise to both false negatives and positives (yellow marks in Figs. 4A, 4D).
Figure 4.
Identification results comparing automated MSCV identifications to manual labeling for subject 2 (A–C) and subject 3 (D–F) at eccentricities of 1.5 (A, D); 3.0 (B, E); and 4.5 mm (C, F). True identifications, green crosses; false positives, orange crosses; false negatives, yellow triangles. Examples of some typical false positives (multiple bright region detections within a single cell) and false negatives (cone photoreceptors with weak boundaries that are not identified) are highlighted with circles. Scale bar: 50 μm.
Table 2.
Evaluation of Identification Accuracy and Computational Time
Reliable Estimation of Quantitative Cone Photoreceptor Mosaic Metrics
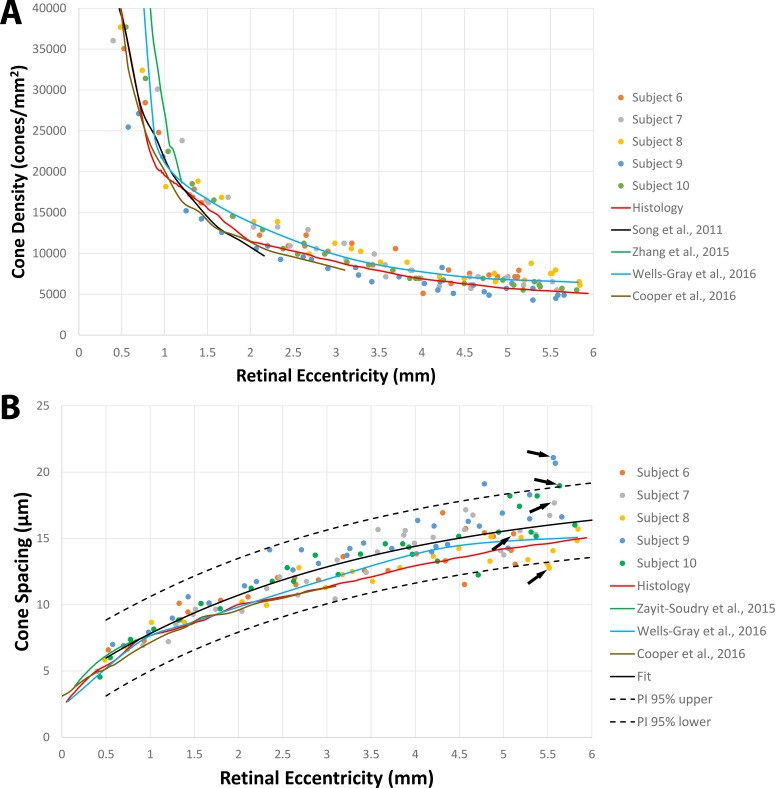
Results were in good agreement with both histology26 and published data27,30–33 in the eccentricity range tested here (0.4–6.0 mm, Fig. 5). There was no statistically significant difference between the histology and MSCV-based density measurements (P = 0.96, Kolmogorov-Smirnov 2-sample test49). The relative errors between MSCV-based cone density and spacing measurements in comparison to histology were 10.7% ± 6.4% and 11.2% ± 4.8%, respectively. These relative errors can be largely attributed to individual-to-individual variations, which would likely average out with larger sample numbers (Fig. 6). Exponential fitting was performed on the MSCV-based cone spacing results as has been previously described according to Equation 3:50,51
 |
where  and
and  are constants.
Figure 5.
Comparison of cone density and spacing results calculated from automated MSCV-based cone identifications in five subjects with histology and published data (see Table 1). The data corresponding to five points (black arrows), one from each subject, are shown in Figure 6.
Figure 6.
The retinal regions that were used to calculate cone spacing from five different subjects corresponding to the arrows in Figure 5B are shown. Images are ordered according to increasing cone spacing from (A) to (E) (i.e., listed in the order of arrows from bottom to top) with eccentricities of 5.52, 5.11, 5.58, 5.60, and 5.56 mm. Scale bar: 10 μm.
Both the histology and published data were within the range of the 95% prediction interval (PI) curves of the fit (Fig. 5B). Together these comparisons demonstrate that MSCV can be used to derive quick estimations of quantitative metrics such as cone density and spacing.
Consistent Identification Results Between Confocal and Split Detection Images
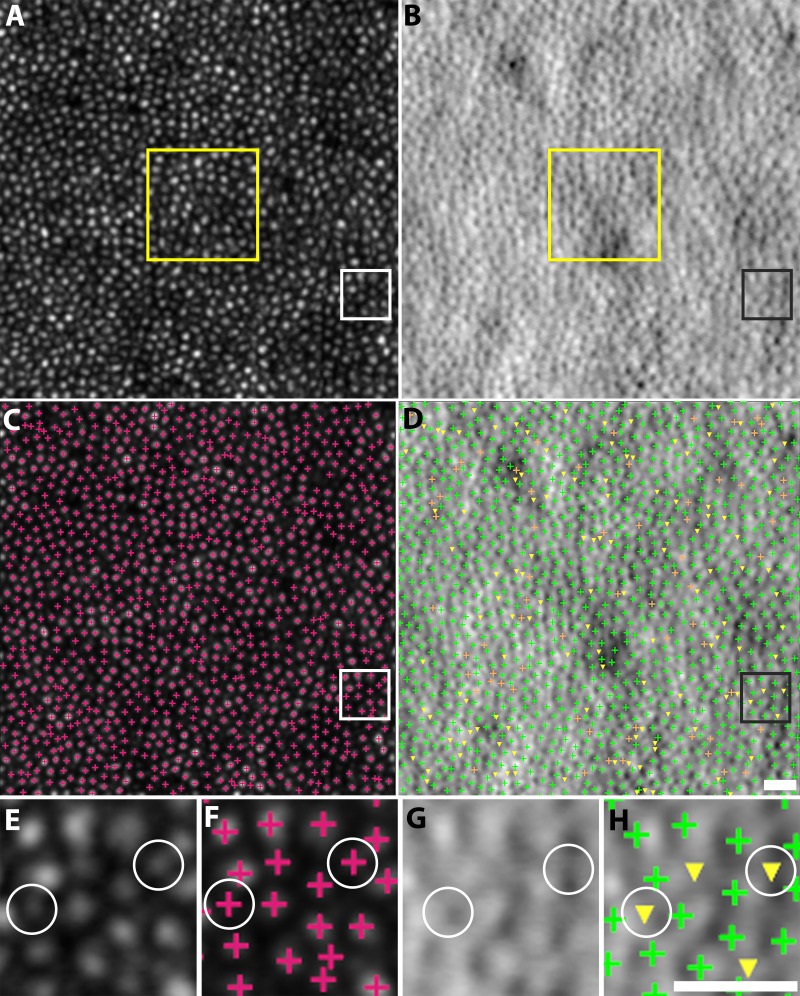
Automated cone detections on confocal and split detection images were consistent with each other in five subjects, with average recall, precision, and F1 score of 87.1%, 88.9%, and 87.9% (Table 3; Fig. 7). These values are slightly smaller than the values reported in the earlier validation, but can be explained through close examination of the original images: additional bright circular structures were detected in the confocal image that did not have a corresponding cone-like object in the split detection images. In addition, the close proximity of cone photoreceptor cells reduces the overall contrast in the split detection images.
Table 3.
Evaluation of Identification Consistency Between Confocal and Split Detection Images
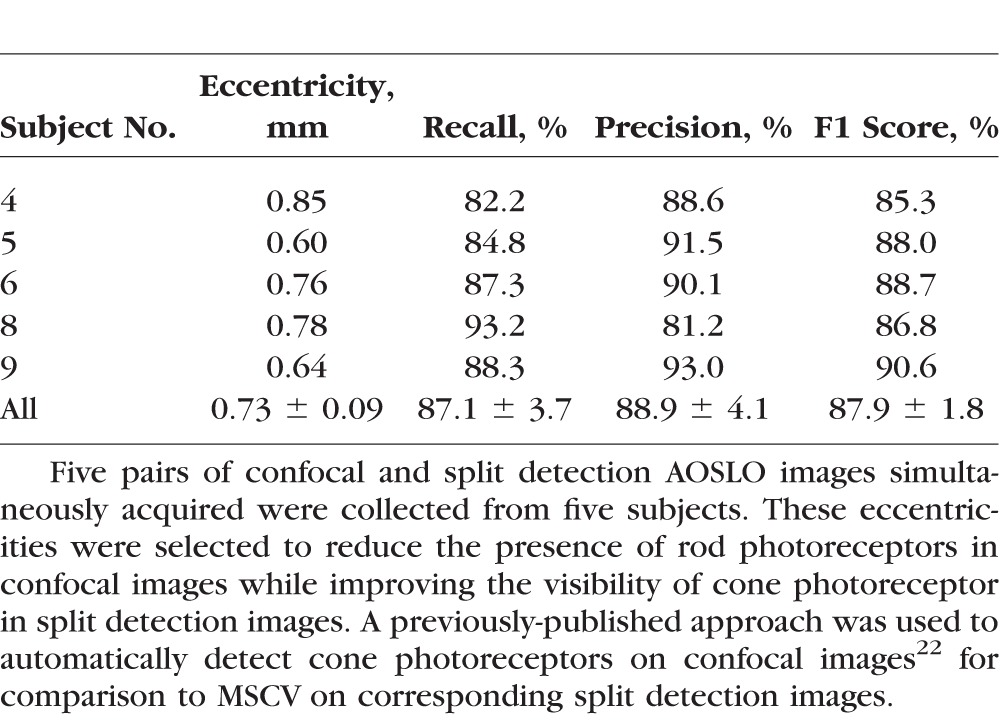
Figure 7.
Comparison of cone identifications on confocal (A, C) and split detection (B, D) images from subject 9 at the eccentricity of 0.64 mm. Zooms of the white and black squares are shown (E–H). True identifications, green crosses; false positives, orange crosses; false negatives, yellow triangles, assuming that the automated confocal cone identifications are ground truth. Some false negatives (white circles) were caused by bright, circular structures that were only present in the confocal images but not present in the split detection images. These additional bright structures are possibly from the multiple reflections of a single cone in confocal images, or from rod photoreceptors. The yellow box in (A, B) shows where spacing and density was computed. Scale bars: 15 μm.
Automated identifications were also used to compute quantitative metrics based on a 55 × 55 μm ROI selected from the centers of each confocal-split detection image pair (yellow square in Fig. 7). The average relative errors of cone spacing and density were 1.2% and 10.0%, respectively (Table 4).
Table 4.
Comparison of Cone Spacing and Density Between Five Pairs of Confocal and Split Detection AOSLO Images in Table 3

Discussion
MSCV allows automated identification of cone photoreceptors in split detection AOSLO images. Its multiscale search makes it robust to variations in cone size with good results shown across eccentricities ranging from approximately 0.4 to 6.0 mm. MSCV-derived measurements of cone density and spacing are consistent with both previously published AO ophthalmoscopy and histology (Fig. 5). The overall robustness of the MSCV algorithm demonstrated on a full spectrum of split detection AO images showing variability in image quality suggests that it will be useful for establishing a larger normal database as well as for upcoming clinical applications in patients with retinal diseases.
MSCV achieves high identification accuracy. As expected, image quality was the most important determining factor for identification accuracy. Poor image contrast caused MSCV to generate false positives and false negatives (Figs. 4D–F). We have suggested a new image quality assessment strategy based on anisotropy48 that could be useful for evaluating split detection images with potential applications for filtering out low-quality AO images to ensure automated identification robustness. We envision that MSCV will significantly reduce the amount of time needed to assemble a more extensive AO-based database for photoreceptor metrics that includes both larger numbers of subjects across different age groups as well as data from a larger range of eccentricities, which will be particularly important for upcoming clinical trials that utilize AO as an outcome. Current AO-based normal databases are either lacking in sample size or in the range of eccentricities represented (Table 1), ostensibly due to the meticulous and tedious task of cone counting as well as the difficulty in identifying cones reliably in eccentric locations without the aid of split detection. On average, the time required to identify cones in each ROI was about 0.9 seconds, an order of magnitude faster than the current alternative based on manual identification (all speed measurements performed using a personal computer [Windows 7 PC with Intel quad-core i7-3770 3.4 GHz CPU; CPU release date April 2012] and 16 GB of random access memory).
One other method for automated cone photoreceptor identification on split detection images has been proposed, based on the application of global smoothing to eliminate irregularities in illuminance, followed by local detection of image points containing intensity extremes.52 The main differences between this approach and ours is the scale-selection strategy in this paper to handle the issue that cone photoreceptors present with a substantial range of different sizes (Fig. 1), which requires variable levels of smoothing in different image regions, and the addition of a centering step which refines the positioning of the detection onto the actual cell center by automatically straddling bright and dark regions. Accurate centering of the identification is particularly important for spacing measurements.
To the best of our knowledge, we have compared for the first time automated cone photoreceptor identification on simultaneously-acquired confocal and split detection images (Fig. 7). Systematic examination of differences between confocal and split detection images of the photoreceptor mosaic in an automated manner could be valuable for interpreting the status of cone photoreceptors in which cones appear “dark” or dim in the confocal modality.20,21,53–56 Automated identification of cones in the two different modalities reveal a number of discrepancies (white circles, Fig. 7) which are unrelated to the ability of the algorithm to detect cone-like structures but, rather, arise from differences in the appearance of cones in one modality versus the other. Some of these discrepancies can be explained by the presence of rods near the fovea57 visible on the confocal images, which can mislead the cone identification algorithm.
There are some important areas for future improvements to the MSCV algorithm, including the reduction of false positives and the recovery of false negatives. For the former, the integration of cone identification with cone segmentation algorithms developed for split detection images58 could eliminate the problems of multiple identifications within a single-cone photoreceptor (orange circle in Fig. 4B). For the latter, machine learning could be employed to build cone photoreceptor classifiers to recover false negatives, as has been previously demonstrated for kidney cancer,59 prostate cancer,60 and lymph node identification.61
Conclusions
MSCV can quickly and automatically detect cone photoreceptors on split detection AOSLO images through multiscale image analysis. Validation results demonstrate that MSCV robustly identifies cone photoreceptors over a large range of eccentricities while still achieving high identification accuracy. There was good agreement in cone identifications between simultaneously acquired pairs of confocal and split detection images. Quantitative metrics derived from automated identifications were also comparable with histology and published data. These promising results can potentially accelerate the creation of larger AO-based normal databases for the rapid, noninvasive assessment of retinal pathology at the cellular level.
Supplementary Material
Acknowledgments
The authors thank Catherine Cukras, Henry Wiley, Wadih Zein, Angel Garced, Meg Gordon, John Rowan, Patrick Lopez, Sharon Yin, Christina Appleman, Gloria Babilonia-Ayukawa, and Denise Cunningham for assistance with clinical procedures; Robert Cooper, Pavan Tiruveedhula, and Austin Roorda for sharing cone photoreceptor analysis software; Yusufu Sulai and Ethan Rossi for technical assistance with adaptive optics instrumentation; and Howard Metger for custom machining for adaptive optics instrumentation.
Supported in part by the Intramural Research Program of the NIH, National Eye Institute, the Glaucoma Research Foundation Catalyst for a Cure Initiative, and NIH Grant U01 EY025477.
Disclosure: J. Liu, None; H. Jung, None; A. Dubra, P; J. Tam, None
Appendix
Multiscale Circular Voting
Let the intensity function of the split detection image after motion stabilization be defined as  . Its multiscale image representation,
  , is generated through convolution with the Gaussian function
 |
The scale parameter  is defined as
  , where
  , with
  denoting the index of scale level. One important property of the multiscale image representation is that
  has theoretically infinite derivatives.28 In particular, derivatives and convolutions are commutable, which allows one to express derivatives of
  as the convolution of derivatives of
  with
with  . Since
  is infinitely differentiable, so is
  . As suggested by Mikolajczyk,42 the incremental constant
  should be selected from
  . In this work, we use
  , which was selected as a tradeoff between having a smooth transition between two consecutive scale levels (large values may cause aliasing artifacts) and between computation time (smaller values result in additional computations of
  ). The scale parameters are set based on prior knowledge of all possible radii (in pixels) of dark and bright cell regions in split detection images across the range of eccentricities that will be analyzed and for all possible fields of views.
At each scale level  , we first compute the image gradient magnitude
  , and identify the points
  for which
  .
.
 |
We set  according to the original work of circular voting,38 which we empirically determined to be effective for our datasets. Future work will reveal whether further optimization of this value leads to better results. A recursive approach was used to numerically compute Gaussian image smoothing (Equation A1) and its derivatives (Equation A2).62 For each selected point,
  , a voting area, A, is created around each of these (Fig. A1).
 |
Figure A1.
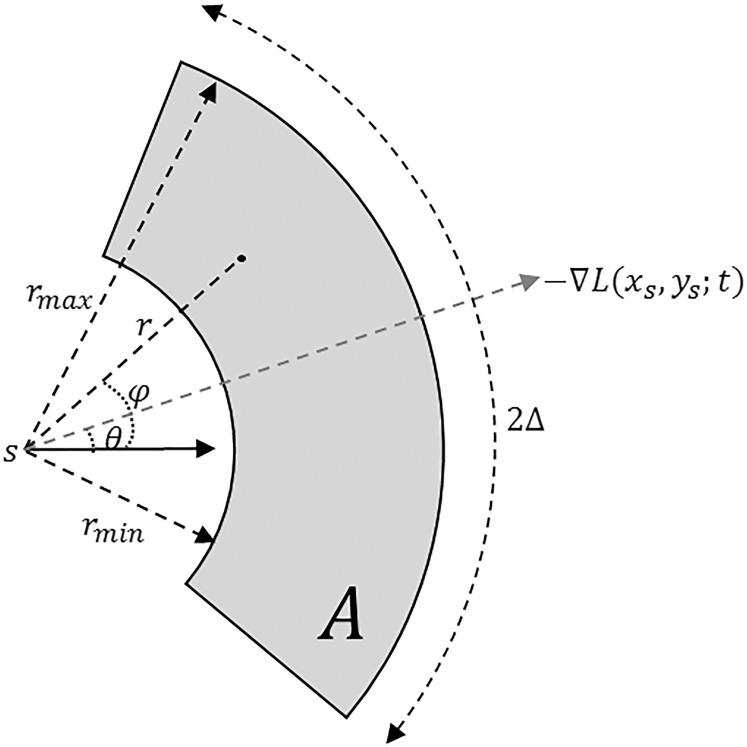
Circular voting area  , shown in gray, as defined by Equation A3.
Here, ± controls the detected region type: positive is used for bright cell regions, and negative for dark regions.  is the voting direction initialized with
  .
.  defines the angular search range of the voting area. The size of the voting area is constrained by
  and
and  pixels. Note that
  utilizes the scale parameter t defined above, and as such
  , includes all possible radii of cell regions. This definition of
  enables the MSCV algorithm to adapt to different AOSLO field of views without the need to specify separate parameter settings because it can automatically search for cone photoreceptors with varying sizes. This definition sets the upper bound of the voting area (
 ) such that the voting area is large enough to contain the cell boundary, but not so large that it contains too many points belonging to boundaries of neighboring cells (noting that bright and dark regions are approximately half the size of the cell and that distance is measured from the starting point toward the cell center as depicted in Figure 3A). The lower bound is the smallest possible region in pixel space (1 pixel).
Figure A2.
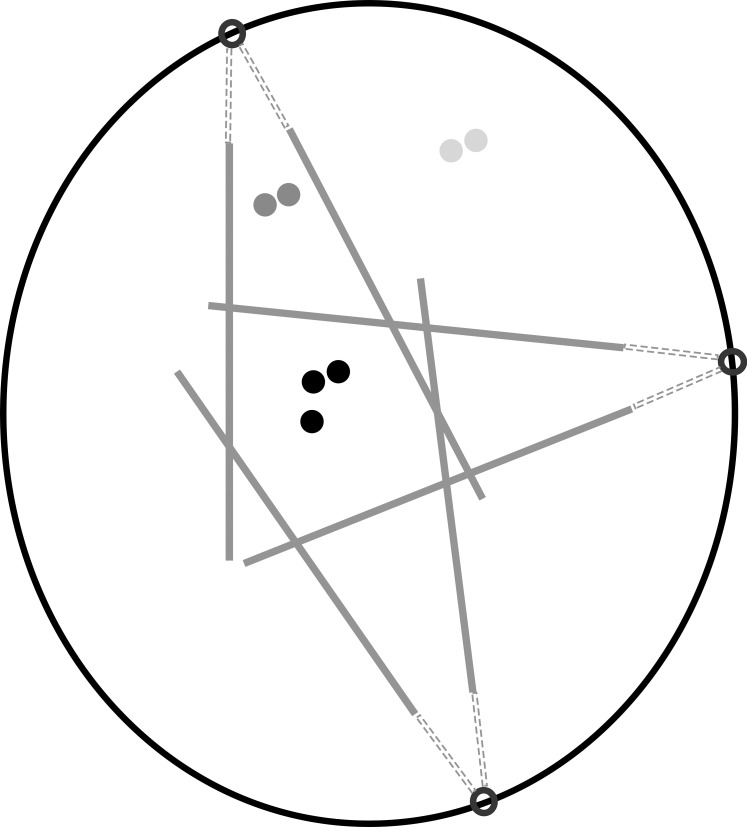
Radial symmetry leads to accumulation of MSCV responses in the center of circle-like regions. The small unfilled black circles represent image points with large gradient magnitudes defined in Equation A3 (e.g., cell region boundaries). Voting areas are cast toward the concave direction. Due to the radial symmetry, image points near the region center (black dots) are more likely to accumulate large MSCV response values, while the points near region boundary (gray dots) will yield less votes with smaller response values.
The MSCV response at an image point  contributed by a single selected point is computed as
 |
Here,  is a Gaussian function with variance
  , masked by the voting area
  , and oriented along the voting direction
  . Note that
  is an image point in the voting area
  , which is used to compute the MSCV response at the point
  .
.  is only valid on the voting area
  , which is different from the Gaussian function
  in Equation A1 that is defined over the entire image domain. The MSCV response value is essentially the convolution between image gradient magnitudes and the Gaussian function
  over the voting area
  . The radial geometry of cone photoreceptors enhances the MSCV response in the region centers as illustrated in Figure A2.
MSCV is an iterative searching process. The MSCV response image  is zeroed at each iteration, where
  is the iteration index and
  is the angular search range with
  . Combining all voting response from different selected points, the overall MSCV response at each image point in i-th iteration is defined as
 |
After each iteration, the point with the maximum MSCV response is found in each voting area (white x's, Fig. 3).
 |
The voting direction is next updated by the point  ,
,
 |
The MSCV response is computed using the current angular search range  , and is iteratively updated by reducing
  to zero.
Combining region identifications at different scale levels produce a cluster of points for each cone photoreceptor. The point that contains the highest MSCV response is selected as the final identification of region center from the point cluster.
Region Size Determination
The region size is determined through scale selection, using the scale-normalized Laplacian operator28:
 |
Its numerical computation can be simplified as the difference of multiscale image representations between two consecutive scales in terms of the heat equation, which can be derived as
 |
 |
Therefore,
 |
The optimal scale  of each region is determined by searching for the most salient extrema:
 |
Centering
Let the coordinates and optimal scales of dual (bright and dark) region centers be  and
and  . The location of the final cone identification, which is pushed closer to the region center with larger size, is calculated as
 |
References
- 1. . Roorda A, Romero-Borja F, Donnelly WJ III, Queener H, Hebert TJ, Campbell M.. Adaptive optics scanning laser ophthalmoscopy. Optics Express. 2002; 10: 405–412. [DOI] [PubMed] [Google Scholar]
- 2. . Dubra A,, Sulai Y. Reflective afocal broadband adaptive optics scanning ophthalmoscope. Biomed Opt Express. 2011; 2: 1757–1768. [DOI] [PMC free article] [PubMed] [Google Scholar]
- 3. . Merino D,, Duncan JL,, Tiruveedhula P,, Roorda A. Observation of cone and rod photoreceptors in normal subjects and patients using a new generation adaptive optics scanning laser ophthalmoscope. Biomed Opt Express. 2011; 2: 2189–2201. [DOI] [PMC free article] [PubMed] [Google Scholar]
- 4. . Zhang Y,, Poonja S,, Roorda A. MEMS-based adaptive optics scanning laser ophthalmoscopy. Optics Letters. 2006; 31: 1268–1270. [DOI] [PubMed] [Google Scholar]
- 5. . Hirose F,, Nozato K,, Saito K,, Numajiri Y. A compact adaptive optics scanning laser ophthalmoscope with high-efficiency wavefront correction using dual liquid crystal on silicon - spatial light modulator. Proc SPIE. 2011; 10: 788515–788517. [Google Scholar]
- 6. . Liang J,, Williams DR,, Miller DT. Supernormal vision and high-resolution retinal imaging through adaptive optics. J Opt Soc Am A Opt Image Sci Vis. 1997; 14: 2884–2892. [DOI] [PubMed] [Google Scholar]
- 7. . Miller DT,, Kocaoglu OP,, Wang Q,, Lee S. Adaptive optics and the eye (super resolution OCT). Eye (Lond). 2011; 25: 321–330. [DOI] [PMC free article] [PubMed] [Google Scholar]
- 8. . Roorda A,, Duncan JL. Adaptive optics ophthalmoscopy. Annu Rev Vis Sci. 2015; 1: 19–50. [DOI] [PMC free article] [PubMed] [Google Scholar]
- 9. . Talcott KE,, Ratnam K,, Sundquist SM,, et al. Longitudinal study of cone photoreceptors during retinal degeneration and in response to ciliary neurotrophic factor treatment. Invest Ophthalmol Vis Sci. 2011; 52: 2219–2226. [DOI] [PMC free article] [PubMed] [Google Scholar]
- 10. . Burns SA,, Tumbar R,, Elsner AE,, Ferguson D,, Hammer DX. Large-field-of-view, modular, stabilized, adaptive-optics-based scanning laser ophthalmoscope. J Opt Soc Am A Opt Image Sci Vis. 2007; 24: 1313–1326. [DOI] [PMC free article] [PubMed] [Google Scholar]
- 11. . Rha J,, Jonnal RS,, Thorn KE,, Qu J,, Zhang Y,, Miller DT. Adaptive optics flood-illumination camera for high speed retinal imaging. Opt Express. 2006; 14: 4552–4569. [DOI] [PubMed] [Google Scholar]
- 12. . Bedggood P,, Metha A. Optical imaging of human cone photoreceptors directly following the capture of light. PLoS One. 2013; 8: e79251. [DOI] [PMC free article] [PubMed] [Google Scholar]
- 13. . Chui TYP,, VanNasdale DA,, Burns SA. The use of forward scatter to improve retinal vascular imaging with an adaptive optics scanning laser ophthalmoscope. Biomed Opt Express. 2012; 3: 2537–2549. [DOI] [PMC free article] [PubMed] [Google Scholar]
- 14. . Sulai YN,, Scoles D,, Harvey Z,, Dubra A. Visualization of retinal vascular structure and perfusion with a nonconfocal adaptive optics scanning light ophthalmoscope. J Opt Soc Am A Opt Image Sci Vis. 2014; 31: 569–579. [DOI] [PMC free article] [PubMed] [Google Scholar]
- 15. . Scoles D,, Sulai YN,, Dubra A. In vivo dark-field imaging of the retinal pigment epithelium cell mosaic. Biomed Opt Express. 2013; 4: 1710–1723. [DOI] [PMC free article] [PubMed] [Google Scholar]
- 16. . Scoles D,, Sulai YN,, Langlo CS,, et al. In vivo imaging of human cone photoreceptor inner segments. Invest Ophthalmol Vis Sci. 2014; 55: 4244–4251. [DOI] [PMC free article] [PubMed] [Google Scholar]
- 17. . Guevara-Torres A,, Williams DR,, Schallek JB. Imaging translucent cell bodies in the living mouse retina without contrast agents. Biomed Opt Express. 2015; 6: 2106–2119. [DOI] [PMC free article] [PubMed] [Google Scholar]
- 18. . Bruce KS,, Harmening WM,, Langston BR,, Tuten WS,, Roorda A,, Sincich LC. Normal perceptual sensitivity arising from weakly reflective cone photoreceptors. Invest Ophthalmol Vis Sci. 2015; 56: 4431–4438. [DOI] [PMC free article] [PubMed] [Google Scholar]
- 19. . Wang Q,, Tuten WS,, Lujan BJ,, et al. Adaptive optics microperimetry and OCT images show preserved function and recovery of cone visibility in macular telangiectasia type 2 retinal lesions. Invest Ophthalmol Vis Sci. 2015; 56: 778–786. [DOI] [PMC free article] [PubMed] [Google Scholar]
- 20. . Horton JC,, Parker AB,, Botelho JV,, Duncan JL. Spontaneous regeneration of human photoreceptor outer segments. Sci Rep. 2015; 5: 12364. [DOI] [PMC free article] [PubMed] [Google Scholar]
- 21. . Tu JH,, Foote KG,, Lujan BJ,, et al. Dysflective cones: visual function and cone reflectivity in long-term follow-up of acute bilateral foveolitis. Am J Ophthalmol Case Rep. 2017; 7: 14–19. [DOI] [PMC free article] [PubMed] [Google Scholar]
- 22. . Li KY,, Roorda A. Automated identification of cone photoreceptors in adaptive optics retinal images. J Opt Soc Am A Opt Image Sci Vis. 2007; 24: 1358–1363. [DOI] [PubMed] [Google Scholar]
- 23. . Chiu SJ,, Lokhnygina Y,, Dubis AM,, et al. Automatic cone photoreceptor segmentation using graph theory and dynamic programming. Biomed Opt Express. 2013; 4: 924–937. [DOI] [PMC free article] [PubMed] [Google Scholar]
- 24. . Bukowska DM,, Chew AL,, Huynh E,, et al. Semi-automated identification of cones in the human retina using circle Hough transform. Biomed Opt Express. 2015; 6: 4676–4693. [DOI] [PMC free article] [PubMed] [Google Scholar]
- 25. . Cooper RF,, Langlo CS,, Dubra A,, Carroll J. Automatic detection of modal spacing (Yellott's ring) in adaptive optics scanning light ophthalmoscope images. Ophthalmic Physiol Opt. 2013; 33: 540–549. [DOI] [PMC free article] [PubMed] [Google Scholar]
- 26. . Curcio CA,, Sloan KR,, Kalina RE,, Hendrickson AE. Human photoreceptor topography. J Comp Neurol. 1990; 292: 497–523. [DOI] [PubMed] [Google Scholar]
- 27. . Cooper RF,, Wilk MA,, Tarima S,, Carroll J. Evaluating descriptive metrics of the human cone mosaic. Invest Ophthalmol Vis Sci. 2016; 57: 2992–3001. [DOI] [PMC free article] [PubMed] [Google Scholar]
- 28. . Lindeberg T. Scale-Space Theory in Computer Vision. New York, NY: Springer; 1994. [Google Scholar]
- 29. . Liu J,, Dubra A,, Tam J. Computer-aided detection of human cone photoreceptor inner segments using multi-scale circular voting. Proc SPIE Medical Imaging. 2016: 97851A-1–97851A-7.
- 30. . Song H,, Chui TYP,, Zhong Z,, Elsner AE,, Burns SA. Variation of cone photoreceptor packing density with retinal eccentricity and age. Invest Ophthalmol Vis Sci. 2011; 52: 7376–7384. [DOI] [PMC free article] [PubMed] [Google Scholar]
- 31. . Zayit-Soudry S,, Sippl-Swezey N,, Porco TC,, et al. Repeatability of cone spacing measures in eyes with inherited retinal degenerations. Invest Ophthalmol Vis Sci. 2015; 56: 6179–6189. [DOI] [PubMed] [Google Scholar]
- 32. . Zhang T,, Godara P,, Blanco ER,, et al. Variability in human cone topography assessed by adaptive optics scanning laser ophthalmoscopy. Am J Ophthalmol. 2015; 160: 290–300. [DOI] [PMC free article] [PubMed] [Google Scholar]
- 33. . Wells-Gray EM,, Choi SS,, Bries A,, Doble N. Variation in rod and cone density from the fovea to the mid-periphery in healthy human retinas using adaptive optics scanning laser ophthalmoscopy. Eye (Lond). 2016; 30: 1135–1143. [DOI] [PMC free article] [PubMed] [Google Scholar]
- 34. . Laser Institute of America. ANSI Z136.1—Safe Use of Lasers. Orlando, FL: Laser Institute of America; 2014. [Google Scholar]
- 35. . Rossi EA,, Rangel-Fonseca P,, Parkins K,, et al. In vivo imaging of retinal pigment epithelium cells in age related macular degeneration. Biomed Opt Express. 2013; 4: 2527–2539. [DOI] [PMC free article] [PubMed] [Google Scholar]
- 36. . Dubra A,, Harvey Z. Registration of 2D images from fast scanning ophthalmic instruments. : Fischer B,, Dawant BM,, Lorenz C, Biomedical Image Registration: Lecture Notes in Computer Science. Heidelberg: Springer Berlin Heidelberg; 2010: 60–71. [Google Scholar]
- 37. . Bennett AG,, Rabbetts RB. Proposals for new reduced and schematic eyes. Ophthalmic Physiol Opt. 1989; 9: 228–230. [DOI] [PubMed] [Google Scholar]
- 38. . Parvin B,, Yang Q,, Han J,, Chang H,, Rydberg B,, Barcellos-Hoff MH. Iterative voting for inference of structural saliency and characterization of subcellular events. IEEE Trans Image Proc. 2007; 16: 615–623. [DOI] [PubMed] [Google Scholar]
- 39. . Vincent L. Morphological transformations of binary images with arbitrary structuring elements. Signal Proc. 1991; 22: 3–23. [Google Scholar]
- 40. . Packer O,, Hendrickson AE,, Curcio CA. Photoreceptor topography of the retina in the adult pigtail macaque (Macaca nemestrina). J Comp Neurol. 1989; 288: 165–183. [DOI] [PubMed] [Google Scholar]
- 41. . Lindeberg T. Feature detection with automatic scale selection. Int J Comput Vis. 1998; 30: 79–116. [Google Scholar]
- 42. . Mikolajczyk K,, Schmid C. Scale & affine invariant interest point detectors. Int J Comput Vis. 2004: 60: 63–86. [Google Scholar]
- 43. . Cooper RF,, Sulai YN,, Dubis AM,, et al. Effects of intraframe distortion on measures of cone mosaic geometry from adaptive optics scanning light ophthalmoscopy. Trans Vis Sci Tech. 2016; 5 (1): 10. [DOI] [PMC free article] [PubMed] [Google Scholar]
- 44. . Baraas RC,, Carroll J,, Gunther KL,, et al. Adaptive optics retinal imaging reveals S-cone dystrophy in tritan color-vision deficiency. J Opt Soc Am A Opt Image Sci Vis. 2007; 24: 1438–1447. [DOI] [PMC free article] [PubMed] [Google Scholar]
- 45. . Duncan JL,, Zhang Y,, Gandhi J,, et al. High-resolution imaging with adaptive optics in patients with inherited retinal degeneration. Invest Ophthalmol Vis Sci. 2007; 48: 3283–3291. [DOI] [PubMed] [Google Scholar]
- 46. . Rodieck RW. The density recovery profile: a method for the analysis of points in the plane applicable to retinal studies. Vis Neurosci. 1991; 6: 95–111. [DOI] [PubMed] [Google Scholar]
- 47. . Arteta C,, Lempitsky V,, Noble JA,, Zisserman A. Detecting overlapping instances in microscopy images using extremal region trees. Med Image Anal. 2016; 27: 3–16. [DOI] [PubMed] [Google Scholar]
- 48. . Gabarda S,, Cristóbal G. Blind image quality assessment through anisotropy. J Opt Soc Am A Opt Image Sci Vis. 2007; 24: B42–B51. [DOI] [PubMed] [Google Scholar]
- 49. . Massey FJ. The Kolmogorov-Smirnov test for goodness of fit. J Am Stat Assoc. 1951; 46: 68–78. [Google Scholar]
- 50. . Zayit-Soudry S,, Duncan JL,, Syed R,, Menghini M,, Roorda AJ. Cone structure imaged with adaptive optics scanning laser ophthalmoscopy in eyes with nonneovascular age-related macular degeneration. Invest Ophthalmol Vis Sci. 2013; 54: 7498–7509. [DOI] [PMC free article] [PubMed] [Google Scholar]
- 51. . Tam J,, Dhamdhere KP,, Tiruveedhula P,, et al. Subclinical capillary changes in non-proliferative diabetic retinopathy. Optom Vis Sci. 2012; 89: E692–E703. [DOI] [PMC free article] [PubMed] [Google Scholar]
- 52. . Cunefare D,, Cooper RF,, Higgins B,, et al. Automatic detection of cone photoreceptors in split detector adaptive optics scanning light ophthalmoscope images. Biomed Opt Express. 2016; 7: 2036–2050. [DOI] [PMC free article] [PubMed] [Google Scholar]
- 53. . Abozaid MA,, Langlo CS,, Dubis AM,, Michaelides M,, Tarima S,, Reliability Carroll J. and repeatability of cone density measurements in patients with congenital achromatopsia. Adv Exp Med Biol. 2016; 854: 277–283. [DOI] [PMC free article] [PubMed] [Google Scholar]
- 54. . Song H,, Rossi EA,, Latchney L,, et al. Cone and rod loss in Stargardt disease revealed by adaptive optics scanning light ophthalmoscopy. JAMA Ophthalmol. 2015; 133: 1198–1203. [DOI] [PMC free article] [PubMed] [Google Scholar]
- 55. . Yoon MK,, Roorda A,, Zhang Y,, et al. Adaptive optics scanning laser ophthalmoscopy images in a family with the mitochondrial DNA T8993C mutation. Invest Ophthalmol Vis Sci. 2009; 50: 1838–1847. [DOI] [PMC free article] [PubMed] [Google Scholar]
- 56. . Cooper RF,, Dubis AM,, Pavaskar A,, Rha J,, Dubra A,, Spatial Carroll J. and temporal variation of rod photoreceptor reflectance in the human retina. Biomed Opt Express. 2011; 2: 2577–2589. [DOI] [PMC free article] [PubMed] [Google Scholar]
- 57. . Dubra A,, Sulai Y,, Norris JL,, et al. Noninvasive imaging of the human rod photoreceptor mosaic using a confocal adaptive optics scanning ophthalmoscope. Biomed Opt Express. 2011; 2: 1864–1876. [DOI] [PMC free article] [PubMed] [Google Scholar]
- 58. . Liu J,, Dubra A,, Tam J. A fully automatic framework for cell segmentation on non-confocal adaptive optics images. SPIE Med Imaging. 2016: 97852J–97852J.
- 59. . Liu J,, Wang S,, Linguraru MG,, Yao J,, Summers RM. Computer-aided detection of exophytic renal lesions on non-contrast CT images. Med Image Anal. 2015; 19: 15–29. [DOI] [PMC free article] [PubMed] [Google Scholar]
- 60. . Wang S,, Burtt K,, Turkbey B,, et al. Computer aided-diagnosis of prostate cancer on multiparametric MRI: a technical review of current research, computer aided-diagnosis of prostate cancer on multiparametric MRI: a technical review of current research. Biomed Res Int. 2014; 2014: e789561. [DOI] [PMC free article] [PubMed] [Google Scholar]
- 61. . Liu J,, Hoffman J,, Zhao J,, et al. Mediastinal lymph node detection and station mapping on chest CT using spatial priors and random forest. Med Phys. 2016; 43: 4362–4374. [DOI] [PMC free article] [PubMed] [Google Scholar]
- 62. . Deriche R. Recursively Implementating the Gaussian and its Derivatives. Rocquencourt: INRIA; 1993: 24 Available at: https://hal.inria.fr/inria-00074778/document. Accessed March 20, 2017. [Google Scholar]
Associated Data
This section collects any data citations, data availability statements, or supplementary materials included in this article.


