

Abstract
Background
Albuminuria is a marker of inflammation and an independent predictor of cardiovascular morbidity and mortality. The current study evaluated whether eicosapentaenoic acid (EPA) and docosahexaenoic acid (DHA) supplementation attenuates progression of albuminuria in subjects with coronary artery disease.
Methods and Results
Two‐hundred sixty‐two subjects with stable coronary artery disease were randomized to either Lovaza (1.86 g of EPA and 1.5 g of DHA daily) or no Lovaza (control) for 1 year. Percent change in urine albumin‐to‐creatinine ratio (ACR) was compared. Mean (SD) age was 63.3 (7.6) years; 17% were women and 30% had type 2 diabetes mellitus. In nondiabetic subjects, no change in urine ACR occurred in either the Lovaza or control groups. In contrast, ACR increased 72.3% (P<0.001) in diabetic subjects not receiving Lovaza, whereas those receiving Lovaza had no change. In diabetic subjects on an angiotensin‐converting enzyme‐inhibitor or angiotensin‐receptor blocker, those receiving Lovaza had no change in urine ACR, whereas those not receiving Lovaza had a 64.2% increase (P<0.001). Change in ACR was directly correlated with change in systolic blood pressure (r=0.394, P=0.01).
Conclusions
EPA and DHA supplementation attenuated progression of albuminuria in subjects with type 2 diabetes mellitus and coronary artery disease, most of whom were on an angiotensin‐converting enzyme‐inhibitor or angiotensin‐receptor blocker. Thus, EPA and DHA supplementation should be considered as additional therapy to an angiotensin‐converting enzyme‐inhibitor or angiotensin‐receptor blocker in subjects with type 2 diabetes mellitus and coronary artery disease.
Clinical Trial Registration
URL: http://www.clinicaltrials.gov. Unique identifier: NCT01624727.
Keywords: albuminuria, angiotensin‐converting enzyme inhibitor, coronary artery disease, omega‐3 fatty acids, type 2 diabetes mellitus
Subject Categories: Clinical Studies; Cardiovascular Disease; Diabetes, Type 2; Nephrology and Kidney; Diet and Nutrition
Introduction
Type 2 diabetes mellitus remains the leading cause of chronic kidney disease worldwide. The prevalence of diabetic nephropathy, a type of chronic kidney disease, has been increasing in patients with type 2 diabetes mellitus.1, 2 Albuminuria is common in patients with type 2 diabetes mellitus,3 hypertension,4 and the general population.5, 6 Prospective and epidemiologic studies have shown that albuminuria is an independent predictor of cardiovascular morbidity and mortality and all‐cause mortality in subjects with hypertension,7, 8 type 2 diabetes mellitus,9, 10, 11, 12 and the general population.13, 14, 15, 16, 17, 18, 19 Moreover, urine albumin‐to‐creatinine ratio (ACR) <30 μg/mg, which has generally been considered in the normal range, has been shown to predict incident hypertension and cardiovascular disease mortality at 11‐year follow‐up in subjects who were healthy and nondiabetic at baseline.20 Furthermore, albuminuria is a better predictor for long‐term mortality after acute myocardial infarction than C‐reactive protein (hazard ratio: 1.8; 95% CI, 1.1–3.1 for albuminuria versus 1.1; 95% CI, 0.7–1.8 for C‐reactive protein).21
Subclinical inflammation may link albuminuria to cardiovascular disease.22 Albuminuria is associated with inflammation; for every 1 mg/L increase in C‐reactive protein, there was a 2% increased odds of albuminuria.23 Albuminuria is also a marker of generalized endothelial dysfunction, a key step in the pathogenesis of coronary artery disease (CAD).24, 25, 26 Albuminuria is also associated with activation of the renin–angiotensin–aldosterone system.22 Previous intervention studies have shown that inhibition of the renin–angiotensin–aldosterone system with an angiotensin‐converting enzyme inhibitor (ACE‐I) or an angiotensin‐receptor blocker (ARB) reduced albuminuria and associated cardiovascular morbidity and mortality in diabetic subjects.27, 28, 29 Therefore, ACE‐I or ARB therapy is now considered standard of care for diabetic patients to reduce albuminuria and associated cardiovascular morbidity and mortality.30
Omega‐3 polyunsaturated fatty acids are a dietary component that can be obtained in fatty fish or as supplements. Results of prior studies examining the effect of omega‐3 fatty acids on albuminuria have had variable results in nondiabetic and diabetic subjects,31, 32, 33, 34, 35, 36 but no study has examined their effect on albuminuria in patients with CAD. The objective of the current study was to assess the effect of very long‐chain omega‐3 fatty acids—eicosapentaenoic acid (EPA) and docosahexaenoic acid (DHA) in the form of Lovaza—on albuminuria in patients with stable CAD both with and without type 2 diabetes mellitus.
Methods
Study Design
The study was an open‐label, prospective, single‐center, randomized, parallel study of subjects with CAD recruited from the cardiovascular clinic at Beth Israel Deaconess Medical Center. The protocol was approved by the Beth Israel Deaconess Medical Center Institutional Review Board, and all subjects signed informed consent. The primary end point of the trial is to examine the effect of Lovaza on progression of fatty, fibrous, and calcified plaque in the coronary arteries over a 30‐month period. A prespecified secondary outcome is change in albuminuria over a 12‐month period.
Participants
Eligible participants were aged 36 to 80 years at time of enrollment and had stable CAD defined as at least 1 of the following: ≥50% stenosis in at least 1 coronary artery at catheterization, previous myocardial infarction (≥6 months prior) or percutaneous coronary intervention (≥6 months prior), coronary bypass surgery (>12 months prior), abnormal exercise treadmill test (defined as at least 1 mm of horizontal or downsloping ST depression in at least 2 contiguous ECG leads) or an area of reversible ischemia on nuclear imaging, pharmacologic stress, or stress echocardiography with subsequent revascularization. Additional inclusion criteria included normal renal function as measured by estimated creatinine clearance using the Cockcroft‐Gault equation ≥60 mL/min.37 Our aim was to target inflammation with an omega‐3 fatty acid (Lovaza) to prevent progression of coronary plaque; therefore, we recruited subjects predicted to have a higher underlying inflammatory burden. Inflammation underlies overweight/obesity38; thus, additional inclusion criteria included a body mass index of ≥27 kg/m2 or a body mass index of 25 to 26.5 kg/m2 with an increased waist circumference (to reflect abdominal obesity) based on criteria of the International Diabetes Federation Task Force on Epidemiology and Prevention or at least 2 components of the metabolic syndrome, which include the following: triglyceride >150 mg/dL, high‐density lipoprotein cholesterol <40 mg/dL if male or <50 mg/dL if female, glucose >100 mg/dL or treated hypertension or blood pressure >135/85 mm Hg.39
Randomization and Study Intervention
Randomization was computer‐allocated in blocks of 4 and stratified by presence or absence of type 2 diabetes mellitus. Participants were randomly assigned to receive either open‐label, omega‐3 ethyl esters prepared from fish oil (Lovaza) in the form of 4 capsules daily or no omega‐3 supplementation (termed control). All subjects were taking a statin and aspirin. Subjects in the Lovaza group received 3.36 g of Lovaza as 4 soft gels, each 1000‐mg capsule containing predominantly EPA (465 mg) and DHA (375 mg) for a total daily dose of 1.86 g EPA and 1.5 g DHA for 12 months. Lovaza was provided by GlaxoSmithKline (Research Triangle Park, NC).
Data Collection and Laboratory Measurements
Data were collected at baseline and at 1 year of intervention in the Clinical Research Center at Beth Israel Deaconess Medical Center. A detailed history, physical examination, height, weight, waist circumference, and blood pressure measurements and ECG were obtained. Blood samples were obtained after a 12‐hour fast, and plasma and serum were prepared. Glucose, hemoglobin A1c (HbA1c), chemical profile, total white blood cell count, absolute neutrophil, lymphocyte, monocyte, and platelet counts and lipid panel were measured at Quest Diagnostics (Cambridge, MA).
A morning spot urine sample was collected before randomization and at 1 year. We did the following in our urine collection process to minimize variability in ACR. Circadian variation in albuminuria has been well documented, with lowest levels during sleep and early morning and highest during the day40, 41, 42; therefore, we collected samples at the same time—between 7:30 to 8:30 am—on both collection days. Diet and exercise also raise ACR43, 44, 45, 46; therefore, we collected samples in the fasting state and prior to exercise on the collection day. Because storage of samples prior to measurement can affect variability,47, 48 our samples were immediately stored at 1 to 4°C and measured within 24 hours on a single analyzer to minimize variability. Urine albumin was measured by immunoturbidimetric assay, and urine creatinine was measured by a colorimetric, kinetic assay at Quest Diagnostics. Urine albumin (micrograms per milliliter) to creatinine (milligrams per deciliter) ratio (ACR) was calculated as a measure of albuminuria. The Modification of Diet in Renal Disease formula was employed to calculate estimated glomerular filtration rate (mL/min per 1.73 m2).
Statistical Analysis
The analysis was performed following intention‐to‐treat principles to compare whether Lovaza attenuated worsening of albuminuria in diabetic and nondiabetic subjects over a 1‐year period. A similar analysis was done in a prespecified subgroup of diabetic subjects receiving an ACE‐I or an ARB. Normality tests were conducted using the Shapiro–Wilk test. Continuous variables were reported as the mean (SD) for normally distributed variables and as median (interquartile range) for ACR, which was not normally distributed. Continuous variables were compared using paired (within group) and unpaired (control versus Lovaza) t tests for normally distributed variables. Non‐normally distributed variables were compared using the signed‐rank test (within group comparisons) and Wilcoxon‐Mann–Whitney (control versus Lovaza). Pairwise comparisons for each of the study arms compared the percent change at 1 year compared to baseline and were stratified according to diabetes mellitus status. All analyses were conducted using SAS version 9.3 (SAS Institute Inc.) or SPSS version 20.0 (IBM Corp., Armonk, NY). All tests were 2‐sided and a P value of less than 0.05 was considered statistically significant.
Results
Participants
Of 336 subjects assessed for eligibility, 13 were excluded as they did not meet the inclusion criteria, and 32 declined to participate (Figure). The remaining 291 subjects were randomized with 147 allocated to Lovaza and 144 assigned to no Lovaza (control). Thirteen of those receiving Lovaza and 15 of those not receiving Lovaza discontinued the intervention and did not have 1‐year follow‐up. The intention‐to‐treat analysis included 262 subjects (134 receiving Lovaza and 128 in control) with measurements of ACR at baseline and 1‐year follow‐up. Four subjects did not tolerate Lovaza; 17 controls took fish oil.
Figure 1.
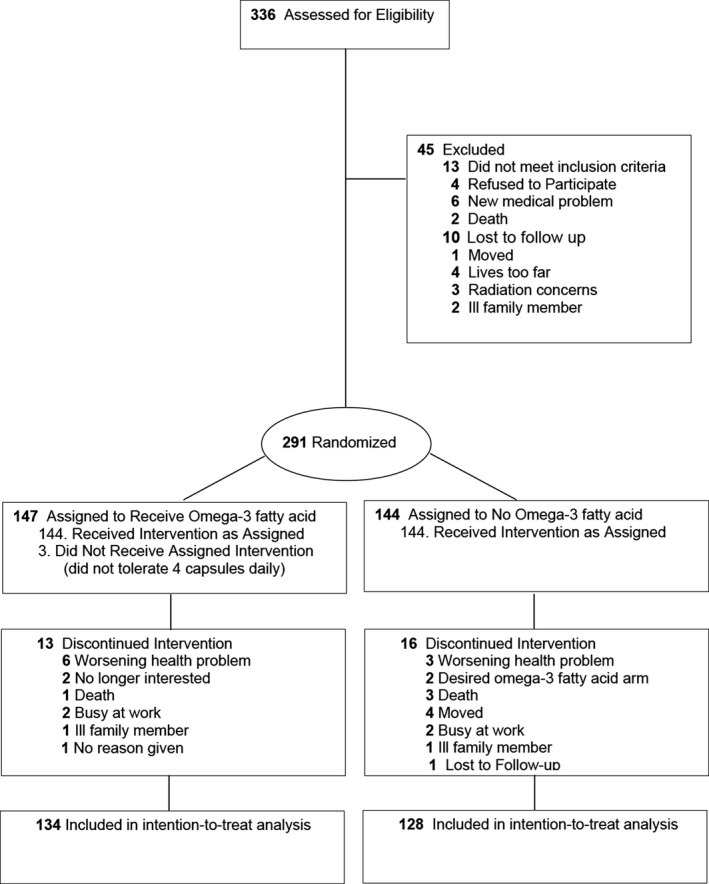
Participant flow through the trial.
For the total group, mean age (SD) was 63.3 (7.6) years, 17.2% (45) were women, and 30% (79) had type 2 diabetes mellitus; 85% of diabetic subjects were receiving an ACE‐I or ARB. The baseline characteristics stratified by diabetes mellitus status are shown in Table 1. Glucose, HbA1c, and ACR levels were significantly lower in the nondiabetic subjects compared to the diabetic subjects. There was no significant difference in any baseline characteristics in the control and Lovaza groups stratified by diabetes mellitus status (Table 2).
Table 1.
Baseline Characteristics Stratified by Diabetes Mellitus Statusa
| Characteristics | Non‐DM (n=183) | DM (n=79) | P Valueb |
|---|---|---|---|
| Age, y | 63.3±7.8 | 63.5±7.2 | 0.85 |
| BMI, kg/m2 | 30.1±3.4 | 31.7±3.8 | 0.001 |
| Waist circumference, cm | 105.2±9.7 | 110.4±11.9 | <0.001 |
| Weight, kg | 89.5±13.2 | 95.2±16.2 | 0.007 |
| HbA1c, % (mmol/mol) | 5.8±0.3 (40.0±3.0) | 7.2±1.1 (55.0±12.0) | <0.001 |
| Glucose, mg/dL (mmol/L) | 93.4±10.6 (5.2±0.6) | 138.1±43.9 (7.7±2.4) | <0.001 |
| Systolic BP, mm Hg | 124.6±14.5 | 125.3±15.5 | 0.72 |
| Diastolic BP, mm Hg | 73.7±9.2 | 70.6±9.8 | 0.01 |
| Met syndrome, n (%) | 77 (42.1%) | 69 (87.3%) | <0.001 |
| CrCl, mL/min | 99.0±23.1 | 103.8±34.1 | 0.21 |
| eGFR, mL/min per 1.73 m2 | 81.5±15.3 | 79.5±20.8 | 0.45 |
|
ACR, μg/mg (mg/mmol) |
3.9 [2.5, 6.9] (0.4 [0.3, 0.8]) |
7.3 [3.9, 27.6] (0.8 [0.4, 3.1]) |
<0.001 |
| Total cholesterol, mg/dL (mmol/L) | 152.4±34.9 (4.0±0.9) | 150.2±37.4 (3.9±1.0) | 0.66 |
| LDL‐C, mg/dL (mmol/L) | 78.4±26.8 (2.0±0.7) | 77.0±29.7 (2.0±0.8) | 0.72 |
| HDL‐C, mg/dL (mmol/L) | 47.8±14.9 (1.2±0.4) | 44.5±13.2 (1.2±0.3) | 0.09 |
| Triglycerides, mg/dL (mmol/L) | 134.5±87.1 (1.5±1.0) | 145.0±87.4 (1.6±1.0) | 0.37 |
| Ethanol, units/week | 4.9±6.2 | 2.3±3.9 | <0.001 |
| AST, IU/L | 24.2±8.0 | 22.9±8.2 | 0.26 |
| ALT, IU/L | 25.3±10.8 | 24.4±11.5 | 0.54 |
ACR indicates albumin‐to‐creatinine ratio; ALT, alanine aminotransferase; AST, aspartate aminotransferase; BMI, body mass index; BP, blood pressure; CrCl, creatinine clearance; eGFR, estimated glomerular filtration rate; DM, diabetes mellitus; HbA1c, hemoglobin A1c; HDL‐C, high‐density lipoprotein cholesterol; LDL‐C, low‐density lipoprotein cholesterol; Met, metabolic.
Data are expressed as mean±SD except for ACR, which is median [interquartile range].
P value was calculated using unpaired t test except for ACR, which used Wilcoxon‐Mann–Whitney.
Table 2.
Baseline Characteristics of Diabetics and Nondiabetics at Randomizationa
| Characteristics | Nondiabetics (n=183) | Diabetics (n=79) | ||||
|---|---|---|---|---|---|---|
| Control (n=88) | Lovaza (n=95) | P Valueb | Control (n=40) | Lovaza (n=39) | P Valueb | |
| Demographics | ||||||
| Age, y | 63.6 (7.6) | 63.1 (8.1) | 0.65 | 64.5 (6.9) | 62.2 (7.3) | 0.17 |
| Sex | ||||||
| Men, N (%) | 75 (85.2%) | 78 (82.1%) | 0.57 | 31 (77.5%) | 33 (84.6%) | 0.42 |
| Women, N (%) | 13 (14.8%) | 17 (17.9%) | 9 (22.5%) | 6 (15.4%) | ||
| Inclusion criteria (may have more than 1) | ||||||
| Previous myocardial infarction | 37 (42.0%) | 45 (47.4%) | 0.47 | 16 (40.0%) | 22 (56.4%) | 0.14 |
| Angioplasty/stent | 55 (62.5%) | 56 (58.9%) | 0.62 | 21 (52.5%) | 29 (74.4%) | 0.04 |
| Previous CABG | 25 (28.4%) | 19 (20.0%) | 0.18 | 12 (30.0%) | 8 (20.5%) | 0.33 |
| Anthropometrics and vital signs | ||||||
| BMI, kg/m2 | 30.0±3.4 | 30.3±3.4 | 0.54 | 31.8±3.9 | 31.6±3.7 | 0.86 |
| Waist, cm | 104.5±9.8 | 105.8±9.6 | 0.34 | 111.3±12.5 | 109.5±11.3 | 0.49 |
| Weight, kg | 89.1±14.7 | 89.9±11.8 | 0.69 | 94.3±16.0 | 96.1±16.4 | 0.62 |
| Systolic BP, mm Hg | 124.8±14.9 | 124.4±14.2 | 0.83 | 123.9±15.0 | 126.8±16.0 | 0.41 |
| Diastolic BP, mm Hg | 74.0±8.9 | 73.4±9.6 | 0.66 | 68.8±8.2 | 72.4±11.0 | 0.10 |
| Labs | ||||||
| HbA1c, % (mmol/mol) | 5.8±0.3 (40.0±3.0) | 5.8±0.4 (40.0±4.0) | 0.78 | 7.4±1.4 (57.0±16.0) | 7.0±0.8 (53.0±9.0) | 0.13 |
| Glucose, mg/dL (mmol/L) | 93.2±10.1 (5.2±0.6) | 93.6±11.0 (5.2±0.6) | 0.80 | 143.5±50.6 (8.0±2.8) | 132.5±35.5 (7.4±2.0) | 0.27 |
| CrCl, mL/min | 98.9±23.1 | 99.1±23.3 | 0.95 | 96.9±26.5 | 111.0±39.5 | 0.07 |
| eGFR, mL/min per 1.73 m2 | 81.9±13.1 | 81.1±17.2 | 0.72 | 76.5±19.5 | 82.6±21.8 | 0.19 |
|
ACR, μg/mg (mg/mmol) |
3.5 [2.5, 6.4] (0.4 [0.3, 0.7]) |
4.2 [2.6, 9.1] (0.5 [0.3, 1.0]) |
0.23 |
7.8 [4.1, 23.5] (0.9 [0.5.2.7]) |
5.7 [3.5, 32.8] (0.6 [0.4, 3.7]) |
0.72 |
| Total cholesterol, mg/dL (mmol/L) | 152.5±34.9 (3.9±0.9) | 152.2±35.1 (3.9±0.9) | 0.94 | 149.3±42.5 (3.9±1.1) | 151.2±31.9 (3.9±0.8) | 0.83 |
| LDL‐C, mg/dL (mmol/L) | 79.0±25.7 (2.0±0.7) | 77.8±27.8 (2.0±0.7) | 0.75 | 77.2±33.8 (2.0±0.9) | 76.8±25.2 (2.0±0.7) | 0.95 |
| HDL‐C, mg/dL (mmol/L) | 48.5±16.0 (1.3±0.4) | 47.1±13.8 (1.2±0.4) | 0.52 | 42.6±9.6 (1.1±0.3) | 46.5±16.0 (1.2±0.4) | 0.19 |
| Triglycerides, mg/dL (mmol/L) | 125.9±67.2 (1.4±0.8) | 142.6±102.0 (1.6±1.2) | 0.19 | 150.4±101.2 (1.7±1.1) | 139.5±71.4 (1.6±0.8) | 0.58 |
| Ethanol, units/week | 5.2±7.0 | 4.5±5.4 | 0.46 | 2.3±3.9 | 2.4±4.1 | 0.93 |
| AST, IU/L | 23.6±8.1 | 24.7±7.9 | 0.35 | 23.8±9.1 | 22±7.2 | 0.33 |
| ALT, IU/L | 24.6±9.4 | 26.0±11.9 | 0.40 | 22.7±6.6 | 26.2±14.8 | 0.19 |
ACR indicates albumin‐to‐creatinine ratio; ALT, alanine aminotransferase; AST, aspartate aminotransferase; BMI, body mass index; BP, blood pressure; CABG, coronary artery bypass graft; CrCl, creatinine clearance; eGFR, estimated glomerular filtration rate; HbA1c, hemoglobin A1c; HDL‐C, high‐density lipoprotein cholesterol; LDL‐C, low‐density lipoprotein cholesterol.
Data are expressed as mean±SD or N (%) except for ACR, which is median [interquartile range].
P values calculated using unpaired t test except for ACR, which used Wilcoxon‐Mann–Whitney test.
Outcomes
Table 3 shows the change at 1‐year follow‐up in the control versus Lovaza groups for the nondiabetic subjects. Those receiving Lovaza had a significant reduction in triglyceride level (P<0.001) and increase in high‐density lipoprotein cholesterol level (P=0.01). The triglyceride reduction in those receiving Lovaza was significantly different compared to those not receiving Lovaza (P<0.001), but high‐density lipoprotein cholesterol change was not (P=0.23). Of note, there was no significant change in glucose levels in either group.
Table 3.
Percent Change in Study Variables in Nondiabetic Subjects at 1‐Year Follow‐Up Compared to Baselinea
| Characteristics | Control (n=88) | Lovaza (n=95) | P Valuec | ||||||
|---|---|---|---|---|---|---|---|---|---|
| Baseline | 1‐Year | %Change | P Valueb | Baseline | 1‐Year | %Change | P Valueb | ||
| BMI, kg/m2 | 29.9±3.4 | 29.8±3.4 | −0.46 | 0.28 | 30.3±3.5 | 29.9±3.6 | −1.39 | 0.005 | 0.16 |
| Waist circumference, cm | 104.3±9.8 | 104.4±10.1 | 0.16 | 0.81 | 105.8±9.6 | 105.2±8.9 | −0.4 | 0.24 | 0.41 |
| HbA1c, % (mmol/mol) | 5.8±0.3 (40.0±3.0) | 5.7±0.3 (39.0±3.0) | −1.03 | 0.02 | 5.8±0.4 (40.0±4.0) | 5.7±0.4 (39.0±4.0) | −0.68 | 0.11 | 0.59 |
| Glucose, mg/dL (mmol/L) | 93.4±10.0 (5.2±0.6) | 91.5±9.2 (5.1±0.5) | −1.57 | 0.10 | 94.0±10.9 (5.2±0.6) | 92.9±12.3 (5.2±0.7) | −0.76 | 0.30 | 0.56 |
| Systolic BP, mm Hg | 124.8±15.1 | 123.7±13.5 | −0.30 | 0.40 | 124.5±14.2 | 122.8±19.8 | −1.1 | 0.34 | 0.67 |
| Diastolic BP, mm Hg | 74.0±8.9 | 73.7±8.1 | 0.23 | 0.72 | 73.5±9.6 | 73.6±13.3 | 1.33 | 0.91 | 0.69 |
| CrCl, mL/min | 98.8±23.2 | 95.3±25.1 | −3.53 | 0.003 | 99.3±23.3 | 96.9±24.7 | −2.01 | 0.06 | 0.37 |
| eGFR, mL/min per 1.73 m2 | 82.4±13.7 | 79.8±13.3 | −2.71 | 0.03 | 80.7±17.1 | 80.3±16.9 | 0.10 | 0.66 | 0.14 |
| WBC, ×109 cells/L | 6.6±1.9 | 6.1±1.9 | −7.30 | 0.01 | 6.7±2.6 | 6.0±1.5 | −11.3 | <0.001 | 0.02 |
| Neutrophils, cells/μL | 542.9±172.0 | 507.3±172.3 | −6.60 | 0.07 | 517.3±149.7 | 466.0±136.7 | −9.9 | <0.001 | 0.01 |
| Lymphocytes, cells/μL | 4236.6±1740.4 | 3922.8±1610.6 | −7.40 | 0.001 | 4138.2±1332.5 | 3632.9±1107.9 | −12.20 | 0.19 | 0.10 |
| Monocytes, cells/μL | 1600.0±541.5 | 1464.3±472.9 | −8.50 | 0.003 | 1849.0±2122.7 | 1670.7±973.2 | −9.60 | <0.001 | 0.06 |
| Total chol, mg/dL (mmol/L) | 152.0±35.1 (3.9±0.9) | 154.5±36.7 (4.0±1.0) | 2.81 | 0.40 | 152.2±36.3 (3.9±0.9) | 152.6±42.2 (4.0±1.1) | 1.17 | 0.90 | 0.56 |
| LDL‐C, mg/dL (mmol/L) | 78.5±25.8 (2.0±0.7) | 80.5±29.0 (2.1±0.8) | 5.20 | 0.44 | 77.6±28.0 (2.0±0.7) | 81.4±35.5 (2.1±0.9) | 7.07 | 0.15 | 0.71 |
| HDL‐C, mg/dL (mmol/L) | 48.3±15.9 (1.3±0.4) | 48.7±14.8 (1.3±0.4) | 2.49 | 0.70 | 47.1±13.9 (1.2±0.4) | 48.9±13.5 (1.3±0.4) | 5.80 | 0.06 | 0.23 |
| Triglycerides, mg/dL (mmol/L) | 126.7±67.7 (1.4±0.8) | 126.6±72.6 (1.4±0.8) | 4.31 | 0.99 | 143.7±102.8 (1.6±1.2) | 111.0±59.4 (1.3±0.7) | −16.88 | <0.001 | <0.001 |
ACR indicates albumin‐to‐creatinine ratio; BMI, body mass index; BP, blood pressure; chol, cholesterol; CrCl, creatinine clearance; eGFR, estimated glomerular filtration rate; HbA1c, hemoglobin A1c; HDL‐C, high‐density lipoprotein cholesterol; LDL‐C, low‐density lipoprotein cholesterol; WBC, white blood cells.
Data are expressed as mean±SD.
P values calculated using paired t test or signed‐rank test for percent change between baseline and 1 year within the same group.
P values calculated using unpaired t test for percent change between the 2 groups (Control vs Lovaza) except for ACR, for which we used the Wilcoxon‐Mann–Whitney test.
Table 4 shows the change at 1‐year follow‐up in the control versus Lovaza groups for the diabetic subjects. Those receiving Lovaza had a significant reduction in triglyceride level (P=0.005) without a change in high‐density lipoprotein cholesterol. Although glucose level significantly increased in the Lovaza group (P=0.04), there was no significant difference in percent change in levels of glucose or HbA1c between the Lovaza and control groups.
Table 4.
Percent Change in Study Variables in Diabetic Subjects at 1‐Year Follow‐Up Compared to Baselinea
| Characteristics | Control (n=40) | Lovaza (n=39) | P Valuec | ||||||
|---|---|---|---|---|---|---|---|---|---|
| Baseline | 1‐Year | %Change | P Valueb | Baseline | 1‐Year | %Change | P Valueb | ||
| BMI, kg/m2 | 31.8±3.9 | 30.9±6.6 | −2.79 | 0.30 | 31.6±3.7 | 31.4±3.7 | −0.71 | 0.33 | 0.46 |
| Waist circumference, cm | 111.6±12.6 | 112.2±13.5 | 0.56 | 0.46 | 109.5±11.3 | 110.2±12.0 | 0.74 | 0.55 | 0.89 |
| HbA1c, % (mmol/mol) | 7.4±1.4 (57.0±16.0) | 7.5±1.6 (58.0±18.0) | 2.1 | 0.36 | 7.0±0.8 (53.0±9.0) | 7.4±1.5 (57.0±17.0) | 5.46 | 0.13 | 0.40 |
| Glucose, mg/dL (mmol/L) | 142.3±50.8 (7.9±2.8) | 138.6±50.7 (7.7±2.8) | 2.85 | 0.68 | 132.5±35.5 (7.4±2.0) | 155.1±63.1 (8.6±3.5) | 21.57 | 0.04 | 0.08 |
| Systolic BP, mm Hg | 123.4±13.9 | 127.5±17.7 | 4.08 | 0.16 | 126.8±16.0 | 126.1±14.7 | 0.23 | 0.76 | 0.21 |
| Diastolic BP, mm Hg | 68.8±8.3 | 69.6±9.2 | 1.73 | 0.62 | 72.4±11.0 | 74.9±22.6 | 3.58 | 0.46 | 0.68 |
| CrCl, mL/min | 97.6±26.5 | 97.7±29.3 | 0.39 | 0.97 | 111.0±39.5 | 108.5±32.8 | −0.73 | 0.28 | 0.71 |
| eGFR, mL/min per 1.73 m2 | 73.3±18.1 | 72.7±18.2 | 1.03 | 0.79 | 81.8±22.6 | 80.7±15.7 | 0.97 | 0.63 | 0.99 |
| WBC, ×109 cells/L | 6.6±2.0 | 6.6±1.8 | −0.7 | 0.87 | 6.7±1.8 | 6.1±1.6 | −9.1 | 0.002 | 0.08 |
| Neutrophils, cells/μL | 539.4±166.9 | 521.4±179.6 | −3.3 | 0.72 | 512.5±210.1 | 454.9±185.2 | −11.2 | 0.008 | 0.05 |
| Lymphocytes, cells/μL | 4194.0±1736.9 | 4285.4±1468.8 | 2.2 | 0.17 | 4222.8±1281.9 | 3791.4±1204.4 | −10.2 | 0.028 | 0.68 |
| Monocytes, cells/μL | 1700.3±545.8 | 1592.1±579.8 | −6.4 | 0.43 | 1816.0±766.4 | 1696.3±827.1 | −6.6 | 0.003 | 0.25 |
| Total chol, mg/dL (mmol/L) | 148.8±43.5 (3.9±1.1) | 143.7±33.5 (3.7±0.9) | −1.04 | 0.31 | 149.5±30.5 (3.9±0.8) | 140.4±31.8 (3.6±0.8) | −5.63 | 0.008 | 0.21 |
| LDL‐C, mg/dL (mmol/L) | 76.7±34.6 (2.0±1.1) | 74.6±23.3 (1.9±0.6) | 4.63 | 0.65 | 75.7±24.5 (2.0±0.6) | 71.3±26.9 (1.8±0.7) | −4.57 | 0.17 | 0.18 |
| HDL‐C, mg/dL (mmol/L) | 41.8±9.2 (1.1±0.2) | 42.0±10.6 (1.1±0.3) | 0.94 | 0.82 | 45.9±15.8 (1.2±0.4) | 45.4±17.2 (1.2±0.4) | −0.68 | 0.66 | 0.63 |
| Triglycerides, mg/dL (mmol/L) | 154.4±102.3 (1.7±1.2) | 135.6±78.2 (1.5±0.9) | −5.86 | 0.20 | 139.5±72.4 (1.6±0.8) | 118.1±61.9 (1.3±0.7) | −9.77 | 0.005 | 0.59 |
| ACR ≥30 μg/mg | 8 (20%) | 14 (35%) | 75% | 0.012 | 10 (25.6%) | 11 (28.2%) | 10% | 0.711 | 0.167 |
ACR indicates albumin‐to‐creatinine ratio; BMI, body mass index; BP, blood pressure; chol, cholesterol; CrCl, creatinine clearance; eGFR, estimated glomerular filtration rate; HbA1c, hemoglobin A1c; HDL‐C, high‐density lipoprotein cholesterol; LDL‐C, low‐density lipoprotein cholesterol; WBC, white blood cells.
Data expressed as mean±SD.
P values calculated using paired t test or signed‐rank test for percent change between baseline and 1 year within the same group.
P values calculated using unpaired t test for percent change between the 2 groups (Control vs Lovaza) except ACR, which is Wilcoxon‐Mann–Whitney test.
ACR was not normally distributed; therefore, we calculated median change at 1 year compared to baseline in control versus Lovaza groups stratified by diabetes mellitus status. Table 5 shows that in nondiabetic subjects, there was no difference in percent change in ACR in those on Lovaza compared to those in the control group (−5.85% versus 4.29%, respectively, P=0.56). In contrast, in diabetic subjects, the controls had a significant 72.3% increase in ACR (P<0.001) compared to no significant change in those on Lovaza (4.63%) (P=0.04 for Lovaza versus control). Therefore, Lovaza attenuated the worsening of ACR in diabetic subjects. Of note, 61 of the 79 diabetic subjects had ACR <30 μg/mg, 15 had ACR of 30 to 300 μg/mg, and 3 had ACR >300 μg/mg. In the 7 diabetic controls with baseline ACR 30 to 300 μg/mg, none had improvement in their ACR to <30 μg/mg at 1‐year follow‐up. In contrast, among the 8 subjects who were on Lovaza, 3 had reversal of ACR from 30 to 300 μg/mg to ACR <30 μg/mg (between group P=0.20). We next examined the number who had any decrease in ACR. Five in the control group (12.5%) and 17 in the Lovaza group (43%) (P=0.002) had a decrease in ACR. This 3‐fold difference is very significant and demonstrates an important change in an early phase of albuminuria.
Table 5.
Median Change in ACR at 1‐Year Follow‐Up Compared to Baseline According to Diabetes Mellitus Status and ACE‐I or ARB Status
| Albumin‐to‐Creatinine Ratio (ACR) | |||||
|---|---|---|---|---|---|
| Baselinea, Median [IQR] | 1‐Yeara, Median [IQR] | Median of % Change | P Valueb | P Valuec | |
| Nondiabetic subjects | |||||
|
Control (n=88), μg/mg (mg/mmol) |
3.5 [2.5, 6.4] (0.4 [0.3, 0.7]) |
3.6 [2.4, 8.7] (0.4 [0.3, 1.0]) |
4.29 | 0.59 | 0.56 |
|
Lovaza (n=95), μg/mg (mg/mmol) |
4.2 [2.6, 9.1] (0.5 [0.3, 1.0]) |
3.9 [2.3, 9.9] (0.4 [0.3, 1.1]) |
−5.85 | 0.91 | |
| Diabetic subjects | |||||
|
Control (n=40), μg/mg (mg/mmol) |
7.8 [4.1, 23.5] (0.9 [0.5, 2.7]) |
14.6 [5.9, 32.9] (1.7 [0.7, 3.7]) |
72.31 | <0.001 | 0.04 |
|
Lovaza (n=39), μg/mg (mg/mmol) |
5.7 [3.5, 32.8] (0.6 [0.4, 3.7]) |
8.8 [3.1, 66.7] (1.0 [0.4, 7.5]) |
4.63 | 0.33 | |
| Diabetics on ACE‐I or ARB | |||||
|
Control (n=34), μg/mg (mg/mmol) |
8.3 [4.1, 28.2] (0.9 [0.5, 3.2]) |
18.5 [6.6, 32.9] (2.1 [0.8, 3.7]) |
64.18 | <0.001 | 0.02 |
|
Lovaza (n=33), μg/mg (mg/mmol) |
6.4 [3.5, 37.8] (0.7 [0.4, 4.3]) |
10.0 [3.1, 38.3] (1.1 [0.4, 4.3]) |
2.74 | 0.19 | |
ACE‐I indicates angiotensin‐converting enzyme inhibitor; ACR, albumin‐to‐creatinine ratio; ARB, angiotensin‐receptor blocker; IQR, interquartile range.
All values presented as median [interquartile range] in μg/mg (mg/mmol).
P values calculated using signed‐rank for within‐group difference at 1 year compared to baseline.
P values calculated using Wilcoxon‐Mann–Whitney for Control vs Lovaza.
Table 6 stratifies diabetic subjects by ACR <30, 30 to 300, and >300 μg/mg and shows the change in each group. In those with ACR <30 μg/mg, the controls had a significant increase in ACR (P<0.001), whereas those on Lovaza had a decrease that approached significance (P=0.096) as did the between‐group comparison (P=0.10). In those with ACR 30 to 300 μg/mg, the increase in ACR in controls approached significance (0.063), whereas those on Lovaza did not have a significant change. Those on Lovaza with ACR >300 μg/mg had a decrease in ACR with a small number of subjects. These results suggest that Lovaza prevents the progression of albuminuria at an early stage of disease in those with ACR <30 μg/mg.
Table 6.
Baseline and Follow‐Up ACR in Diabetic Subjects According to ACR Category
| ACR Category | Albumin‐to‐Creatinine Ratio (ACR) | ||||
|---|---|---|---|---|---|
| Baselinea, Median [IQR] | 1‐Yeara, Median [IQR] | Median of % Change [IQR] | P Valueb | P Valuec | |
| ACR <30 μg/mg | |||||
|
Control (n=32), μg/mg (mg/mmol) |
6.7 [3.8, 10.6] (0.8 [0.4, 1.2]) |
9.5 [5.2, 28.3] (1.1 [0.6, 3.2]) |
86.9 [21.7, 192.3] | <0.001 | 0.10 |
|
Lovaza (n=29), μg/mg (mg/mmol) |
4.9 [3.0, 7.4] (0.6 [0.3, 0.8]) |
4.7 [2.2, 12.6] (0.5 [0.3, 1.4]) |
21.9 [−21.0, 146.2] | 0.096 | |
| ACR 30 to 300 μg/mg | |||||
|
Control (n=7), μg/mg (mg/mmol) |
47.4 [36.0, 112.7] (5.4 [4.1, 12.7]) |
79.5 [41.1, 284.5] (9.0 [4.6, 32.2]) |
26.3 [−0.1, 105.8] | 0.063 | 0.20 |
|
Lovaza (n=8), μg/mg (mg/mmol) |
62.3 [38.2, 75.5] (7.0 [4.3, 8.5]) |
83.9 [24.5, 96.2] (9.5 [2.8, 10.9]) |
−19.4 [−44.2, 109.2] | 1.000 | |
| ACR >300 μg/mg | |||||
|
Control (n=1), μg/mg (mg/mmol) |
449.0 [449.0, 449.0] (50.7 [50.7, 50.7]) |
552.4 [552.4, 552.4] (62.4 [62.4, 62.4]) |
23.0 [23.0, 23.0] | NA | 0.70 |
|
Lovaza (n=2), μg/mg (mg/mmol) |
762.8 [436.0, 1089.6] (86.2 [49.3, 123.1]) |
567.4 [494.6, 640.2] (64.1 [55.9, 72.3]) |
−13.9 [−41.2, 13.4] | 0.66 | |
ACR indicates albumin‐to‐creatinine ratio; IQR, interquartile range.
All values presented as median [interquartile range] in μg/mg.
P values calculated using signed‐rank test for within‐group difference at 1 year compared to baseline.
P values calculated using Wilcoxon‐Mann–Whitney for Control vs Lovaza.
Subgroup Analysis in Diabetic Subjects
ACE‐I and ARB treatment have been shown to attenuate worsening of albuminuria in diabetic subjects27, 28, 29; therefore, we examined results in only the diabetic subjects receiving either an ACE‐I or ARB. There were no significant differences in creatinine clearance at baseline compared to 1 year within the control group (95.2±22.1 mL/min versus 95.3±26.3 mL/min, respectively, P=0.66) or within the Lovaza group (109.7±38.7 mL/min versus 109.3±33.7 mL/min, respectively, P=0.67) and no significant differences in estimated glomerular filtration rate within the control group (75.7±15.5 mL/min per 1.73 m2 versus 72.9±17.0 mL/min per 1.73 m2, respectively, P=0.94) or within the Lovaza group (82.0±17.4 mL/min per 1.73 m2 versus 81.3±14.4 mL/min per 1.73 m2, respectively, P=0.81). Table 5 shows that, in those diabetic subjects on an ACE‐I or ARB (which includes 85% of diabetic subjects), diabetic subjects not receiving Lovaza had a 64.2% increase in ACR at 1‐year follow‐up, which was significantly higher than the 2.7% increase in diabetic subjects receiving Lovaza (P=0.02 for Lovaza versus control). Therefore, Lovaza attenuated the increase in ACR in those on an ACE‐I or ARB.
In the diabetic subjects receiving Lovaza, there was a significant direct correlation between change in ACR and change in systolic blood pressure (r=0.394, P=0.01). Because those on Lovaza did not have a reduction in blood pressure, we examined this relationship further by comparing the median change in ACR in the total group of diabetic subjects stratified by whether they had a decrease or increase in systolic blood pressure. Table 7 shows that those with a reduction in systolic blood pressure in the total group of diabetic subjects have a significant decrease in ACR (P=0.005), a finding consistent with the known literature.49 This expected reduction in ACR with decrease in systolic blood pressure suggests that the ACRs in our study are likely to be pathological even though the majority had ACR in what has been considered a normal range. The point is that an ACR <30 μg/mg may not be normal for diabetic subjects, the majority of whom will eventually develop worsening ACR. We then stratified the group by treatment arm. Among controls, median ACR increased in both those with a decrease and increase in systolic blood pressure (P=0.81) (Table 7). On the other hand, among the Lovaza group, those with a reduction in systolic blood pressure had a median 19% reduction in ACR compared to a median 49.6% increase in those with an increase in systolic blood pressure (between‐group P<0.001), a finding suggesting that the effect of Lovaza on ACR is more pronounced in those with a decrease in blood pressure. When comparing the treatment arms among those with a reduction in blood pressure, those receiving Lovaza had a median 19% reduction in ACR whereas controls had a median increase of 84.3%, (P=0.002).
Table 7.
Median of Percent Change in ACR Stratified by Reduction or Increase in SBP in Diabetic Subjects
| ACR Median of % Change [IQR]a | P Valueb | |||
|---|---|---|---|---|
| Total (n=79) | Control (n=40) | Lovaza (n=39) | ||
| Reduction in SBP (n=51) | 9.9 [−35.6, 106.7] | 84.3 [9.9, 139.2] | −19.0 [−52.1, 23.8] | 0.002 |
| Increase in SBP (n=27) | 100.0 [21.9, 367.5] | 128.7 [36.8, 428.8] | 49.6 [15.1, 267.1] | 0.528 |
| P valuec | 0.005 | 0.81 | 0.001 | |
ACR indicates albumin‐to‐creatinine ratio; IQR, interquartile range; SBP, systolic blood pressure.
All values presented as median [interquartile range].
P values calculated using Wilcoxon‐Mann–Whitney for Control vs Lovaza.
P values calculated using Wilcoxon‐Mann–Whitney for those with reduction in SBP vs those with increase in SBP.
The correlations between change in ACR and change in triglyceride level, diastolic blood pressure, white blood cell count, monocytes, neutrophils, and lymphocytes were not significant (r=0.059, P=0.72; r=0.166, P=0.31; r=0.162, P=0.32; r=−0.18, P=0.91; r=0.205, P=0.21; and r=0.073, P=0.66, respectively).
Discussion
In this randomized clinical trial of subjects with CAD, daily supplementation with Lovaza for 1 year attenuated the worsening of albuminuria in diabetic subjects, the majority of whom had an ACR <30 μg/mg. Moreover, significantly more (3‐fold) subjects on Lovaza had a decrease in ACR compared to control, and 3 on Lovaza had a change in category from >30 to <30 μg/mg whereas no controls did. These results suggest that there is benefit and perhaps even reversal of ACR with Lovaza at an early stage of disease in those with ACR <30 μg/mg and those with microalbuminuria. Since ACE‐I or ARB therapy has been shown to reduce pathologic albuminuria and associated cardiovascular morbidity and mortality27, 28, 29 and is now considered standard of care for diabetic patients,30 we examined whether Lovaza added any benefit in diabetic subjects who were receiving ACE‐I or ARB treatment and had normal renal function. The current results show that Lovaza attenuated the increase in ACR in diabetic subjects on an ACE‐I or ARB. Thus, this is the first study to show that Lovaza may provide benefit in slowing progression of early‐stage albuminuria in diabetic subjects with CAD on an ACE‐I or ARB.
An ACR <30 μg/mg has generally been considered to be in the normal range; however, nondiabetic, healthy subjects with an ACR of 7.4 to 30 μg/mg at baseline were recently reported to have an increased incidence of hypertension and cardiovascular mortality compared to those with ACR <7.4 μg/mg in 11‐year follow‐up.20 Therefore, an ACR <30 μg/mg may be an early indicator of pathology. The majority of our subjects had an ACR <30 μg/mg, a finding which could partially be attributable to the fact that we minimized variability in ACR measurements by collecting urine samples in the fasting state at the same time in the early morning on both collection days, in the absence of exercise and with measurements on fresh samples within 24 hours. In this manner, we also minimized level of ACR since ACR levels are lowest during waking hours in the early morning and increase postprandially and with exercise.40, 41, 42 Under these conditions, any albumin excretion in the <30 μg/mg range may be indicative of early pathology. Changes in albuminuria, including ACR <30 μg/mg, are predictive of cardiovascular outcomes.20, 50 The majority of diabetic subjects will eventually develop albuminuria; therefore, strategies to lower progression of albuminuria in the earliest stages may be important and may prevent or delay atherosclerosis and cardiovascular disease.51 Our results suggest that if we start a preventive strategy early, significant disease might be preventable in some instances or mitigated in others. If one waits until significant disease is present, reduction in albuminuria because of structural renal change may not be possible in the majority of patients.
Prior trials of the effect of omega‐3 fatty acids on albuminuria have examined primarily nondiabetic subjects without known clinical CAD and with various causes of chronic kidney disease. In a meta‐analysis of 17 clinical trials in patients with albuminuria attributable to either diabetes mellitus, IgA nephropathy, or mixed causes of renal disease, omega‐3 fatty acids of various doses reduced urinary protein excretion 19% (95% CI, −34 to −4; P=0.01).32 Previous studies of the effect of omega 3 fatty acids on albuminuria in diabetic subjects have been limited. A 21% reduction was noted in 7 trials of subjects with both type 1 and type 2 diabetes mellitus, but it was not significant, possibly due to a small sample size (95% CI, −46 to 4, P=0.10).32 In 2 prior clinical trials limited to subjects with type 2 diabetes mellitus but without CAD (Table 8), pure EPA significantly reduced albuminuria over a 12‐month period; however, the number of patients was small, ranging from 21 to 45, and only 1 trial was randomized.33, 34 A third trial of 3.6 g/day of EPA and DHA in a crossover design of 6‐month duration showed no significant benefit.35 In a fourth trial of 6 weeks duration in type 2 diabetes mellitus, omega‐3 fatty acids had no benefit on albuminuria in the total group, but a significant reduction occurred when omega‐3 fatty acids were added to an ACE‐I or ARB (Table 8).36
Table 8.
Prior Clinical Trials of Effect of Eicosapentaenoic and Docosahexaenoic Acids on Albuminuria in Subjects With Type 2 Diabetes Mellitus
| Trial | Design | N | Mean ACR at Baseline, μg/mg | Omega‐3 Fatty Acid Dose | Duration | % Reduction in Albuminuria | P Value (95% CI) |
|---|---|---|---|---|---|---|---|
| Shimizu et al, 199533 | Randomized | 45 | 200 (control) 447 (EPA) | EPA 0.9 g/day | 12 months | −40.8 | <0.01 |
| Okuda et al, 199634 | Single arm trial | 21 | 24.4 | EPA 1.8 g/day | 48 weeks | −43.03 | <0.05 |
| Zeman et al, 200635 | Crossover (sequential) | 24 | 6.0 (placebo) 4.8 (omega‐3 fatty acid) excluded ACR >300 μg/mg | EPA & DHA 3.6 g/day | 6 months | −20 | 0.38 |
| Miller et al, 201336 | Crossover | 60 | 161 mg/day [115–414] | EPA & DHA 4 g/day | 6 weeks | −7.2 | 0.35 (−20.6 to 8.5) |
| Miller et al, 201336 | Subgroup analysis (Type 2 DM on ACE‐I or ARB) | 42 | EPA & DHA 4 g/day | 6 weeks | −17 | 0.04 0.83 (0.69–1.0) |
ACE‐I indicates angiotensin‐converting enzyme inhibitor; ACR, albumin‐to‐creatinine ratio; ARB, angiotensin‐receptor blocker; DHA, docosahexaenoic acid; DM, diabetes mellitus; EPA, eicosapentaenoic acid.
The differences in outcome in these previous trials may be attributable to dose, duration, and differences in study design and study subject characteristics, which can lead to weakness in generating conclusions. Compared to these prior studies, strengths of our clinical trial are that it is the first to examine CAD patients, included both diabetic and nondiabetic subjects, included a larger number (79) of diabetic subjects than previous trials, and randomization was stratified by diabetes mellitus status. Moreover, it is the first trial to use a high dose of EPA and DHA for 1 year. Thus, our study design strengthens confidence in our findings and the scientific premise that EPA and DHA may be beneficial.
Potential mechanisms for the beneficial effect of EPA and DHA include a beneficial effect on renal hemodynamics as shown in several prior studies.36, 52, 53 In subjects with diabetes mellitus receiving Lovaza in the current study, the change in ACR was significantly directly correlated with the change in systolic blood pressure; however, Lovaza itself was not associated with a reduction in systolic blood pressure. Rather, those with a reduction in blood pressure on Lovaza had a significant reduction in ACR, in contrast to controls who did not have benefit with blood pressure reduction, a finding suggesting that beneficial hemodynamic effects may be contributing to the attenuation of worsening of ACR in those receiving Lovaza.
A second postulated beneficial effect is through improvement of dyslipidemia. The development of chronic kidney disease and albuminuria are associated with elevated levels of serum triglyceride,54 and tissue accumulation of lipids in the kidney may underlie the development of diabetic nephropathy.55, 56 In the current study, diabetic subjects receiving Lovaza had a significant reduction in triglyceride level; however, there was no correlation between reduction in plasma triglyceride and attenuation of worsening of albuminuria, a finding suggesting that plasma triglyceride reduction is not responsible for attenuation of worsening of albuminuria, although we cannot exclude changes in tissue accumulation of triglyceride.
In the current study, diabetic subjects receiving Lovaza had a significant increase in glucose level over 12 months (P=0.022); however, the between‐group change (Lovaza versus control) in glucose was not significant. This increase in glucose level could be linked to the triglyceride‐lowering effect of Lovaza which, by impairing hepatic triglyceride synthesis, may divert substrates from lipogenesis to gluconeogenesis in the fasting state. In support of this, Basu et al57 reported that gluconeogenesis was higher in diabetic compared to obese nondiabetic subjects (P<0.05) with omega‐3 fatty acid supplementation. Moreover, Glauber et al58 reported a significant increase in fasting glucose from 13.1 to 15.3 mmol/L (P=0.03) with omega‐3 fatty acid supplementation for 1 month in 6 men with type 2, non‐insulin‐dependent diabetes mellitus. They also demonstrated increased basal hepatic glucose output (from 97 to 122 mg/m2; P=0.004). On the other hand, in the nonfasting period, hepatic glucose production is suppressed by the availability of glucose in the blood. HbA1c reflects the average glucose level within the prior 3 months in which subjects are nonfasting and therefore, hepatic gluconeogenesis is suppressed. This may account for the observation of no significant change in HbA1c levels in the diabetic subjects receiving Lovaza in the current study.
Limitations of the study include the open‐label study design. Although the trial was randomized, our report of ACR is a secondary outcome, which may be subject to unmeasured bias. The number of diabetic subjects in the 30 to 300 μg/mg ACR category is small and may account for the borderline statistical significance for worsening of ACR in the control group. Finally, the number of diabetic subjects on ACE‐I or ARB is small; therefore, the results are exploratory and hypothesis‐generating.
Conclusion
In conclusion, we have shown that Lovaza attenuates progression of albuminuria in subjects with type 2 diabetes mellitus and CAD, most of whom were on an ACE‐I or ARB. Dietary modalities that can prevent albuminuria progression would be cost‐effective on a population basis; their relative lack of side effects and easy availability make them attractive interventions. Based on our results, the potential benefit of Lovaza added to ACE‐I or ARB therapy should be investigated in a larger clinical trial of patients with diabetes mellitus and with albuminuria as the primary end point. If confirmed in a larger clinical trial of longer duration with albuminuria as the primary end point, Lovaza may be of benefit to subjects with type 2 diabetes mellitus.
Sources of Funding
This work was supported by a grant from the National Institutes of Health (P50HL083813) (Welty). Glaxo SmithKline provided Lovaza.
Disclosures
None.
Acknowledgments
We thank the study participants for contributing their time and participating in the trial and the external data safety monitoring board members for their assistance in the successful completion of this trial. We gratefully acknowledge Dr Bruce Bistrian for providing advice.
(J Am Heart Assoc. 2017;6:e004740 DOI: 10.1161/JAHA.116.004740.)28710178
The data have been presented at the American Heart Association Scientific Sessions, November 7–11, 2015, in Orlando, FL.
References
- 1. Montero RM, Covic A, Gnudi L, Goldsmith D. Diabetic nephropathy: what does the future hold? Int Urol Nephrol. 2016;48:99–113. [DOI] [PMC free article] [PubMed] [Google Scholar]
- 2. National Kidney Foundation . KDOQI clinical practice guideline for diabetes and CKD: 2012 update. Am J Kidney Dis. 2012;60:850–886. [DOI] [PubMed] [Google Scholar]
- 3. Keen H, Chlouverakis C, Fuller J, Jarrett RJ. The concomitants of raised blood sugar: studies in newly‐detected hyperglycemics II. Urinary albumin excretion, blood pressure and their relation to blood sugar levels. Guys Hosp Rep. 1969;118:247–254. [PubMed] [Google Scholar]
- 4. Parving HH, Mogensen CE, Jensen HA, Evrin PE. Increase urinary albumin‐excretion rate in benign essential hypertension. Lancet. 1974;1:1190–1192. [DOI] [PubMed] [Google Scholar]
- 5. Hillege HL, Janssen WM, Bak AA, Diercks GF, Grobbee DE, Crijns HJ, Van Gilst WH, De Zeeuw D, De Jong PE; Prevend Study Group . Microalbuminuria is common, also in a nondiabetic, nonhypertensive population, and an independent indicator of cardiovascular risk factors and cardiovascular morbidity. J Intern Med. 2001;249:519–526. [DOI] [PubMed] [Google Scholar]
- 6. Jones CA, Francis ME, Eberbardt MS, Chavers B, Coresh J, Engelgau M, Kusek JW, Byrd‐Holt D, Naravan KM, Herman WH, Jones CP, Salive M, Agodoa LY. Microalbuminuria in the US population: third National Health and Nutrition Examination Survey. Am J Kidney Dis. 2002;39:445–459. [DOI] [PubMed] [Google Scholar]
- 7. Jager A, Kostense PJ, Ruhé HG, Heine RJ, Nijpels G, Dekker JM, Bouter LM, Stehouwer CD. Microalbuminuria and peripheral arterial disease are independent predictors of cardiovascular and all‐cause mortality, especially among hypertensive subjects: five‐year follow‐up of the Hoorn Study. Arterioscler Thromb Vasc Biol. 1999;19:617–624. [DOI] [PubMed] [Google Scholar]
- 8. Bigazzi R, Bianchi S, Baldari D, Campese VM. Microalbuminuria predicts cardiovascular events and renal insufficiency in patients with essential hypertension. J Hypertens. 1998;16:1325–1333. [DOI] [PubMed] [Google Scholar]
- 9. Messent JW, Elliott TG, Hill RD, Jarrett RJ, Keen H, Viberti GC. Prognostic significance of microalbuminuria in insulin‐dependent diabetes mellitus: a twenty‐three year follow‐up study. Kidney Int. 1992;41:836–839. [DOI] [PubMed] [Google Scholar]
- 10. Rossing P, Hougaard P, Borch‐Johnsen K, Parving HH. Predictors of mortality in insulin dependent diabetes: 10‐year observational follow‐up study. BMJ. 1996;313:779–784. [DOI] [PMC free article] [PubMed] [Google Scholar]
- 11. Gerstein HC, Mann JF, Yi Q, Zinman B, Dinneen SF, Hoogwerf B, Hallé JP, Young J, Rashkow A, Joyce C, Nawaz S, Yusuf S; HOPE Study Investigators . Albuminuria and risk of cardiovascular events, death, and heart failure in diabetic and non‐diabetic individuals. JAMA. 2001;286:421–426. [DOI] [PubMed] [Google Scholar]
- 12. Dinneen SF, Gerstein HC. The association of microalbuminuria and mortality in non‐insulin‐dependent diabetes mellitus. A systematic overview of the literature. Arch Intern Med. 1997;157:1413–1418. [PubMed] [Google Scholar]
- 13. Yudkin JS, Forrest RD, Jackson CA. Microalbuminuria as predictor of vascular disease in non‐diabetic subjects. Islington Diabetes Survey. Lancet. 1998;2:530–533. [DOI] [PubMed] [Google Scholar]
- 14. Borch‐Johnsen K, Feldt‐Rasmussen B, Strandgaard S, Schroll M, Jensen JS. Urinary albumin excretion: an independent predictor of ischemic heart disease. Arterioscler Thromb Vasc Biol. 1999;19:1992–1997. [DOI] [PubMed] [Google Scholar]
- 15. Hillege HL, Fidler V, Diercks GF, van Gilst WH, de Zeeuw D, van Veldhuisen DJ, Gans RO, Janssen WM, Grobbee DE, de Jong PE; Prevention of Renal and Vascular End Stage Disease (PREVEND) Study Group . Urinary albumin excretion predicts cardiovascular and noncardiovascular mortality in general population. Circulation. 2002;106:1777–1782. [DOI] [PubMed] [Google Scholar]
- 16. Yuyun MF, Khaw KT, Luben R, Welch A, Bingham S, Day NE, Wareham NJ; European Prospective Investigation into Cancer in Norfolk (EPIC‐Norfolk) population study . Microalbuminuria independently predicts all‐cause and cardiovascular mortality in a British population: the European Prospective Investigation into Cancer in Norfolk (EPIC‐Norfolk) population study. Int J Epidemiol. 2004;33:189–198. [DOI] [PubMed] [Google Scholar]
- 17. Arnlov J, Evans JC, Meigs JB, Wang TJ, Fox CS, Levy D, Benjamin EJ, D'Agostino RB, Vasan RS. Low‐grade albuminuria and incidence of cardiovascular disease events in nonhypertensive and nondiabetic individuals: the Framingham Heart Study. Circulation. 2005;112:969–975. [DOI] [PubMed] [Google Scholar]
- 18. Wang Y, Yuan A, Yu C. Correlation between microalbuminuria and cardiovascular events. Int J Clin Exp Med. 2013;6:973–978. [PMC free article] [PubMed] [Google Scholar]
- 19. Romundstad S, Holmen J, Kvenild K, Hallan H, Ellekjaer H. Microalbuminuria and all‐cause mortality in 2,089 apparently healthy individuals: a 4.4‐year follow‐up study. The Nord‐Trondelag Health Study (HUNT), Norway. Am J Kidney Dis. 2003;42:466–473. [DOI] [PubMed] [Google Scholar]
- 20. Sung KC, Ryu S, Lee JY, Lee SH, Cheong E, Hyun YY, Lee KB, Kim H, Byrne CD. Urine albumin/creatinine ratio below 30 mg/g is a predictor of incident hypertension and cardiovascular mortality. J Am Heart Assoc. 2016;5:e003245 DOI: 10.1161/JAHA.116.003245. [DOI] [PMC free article] [PubMed] [Google Scholar]
- 21. Berton G, Cordiano R, Palmieri R, Cavuto F, Buttazzi P, Palatini P. Comparison of C‐reactive protein and albumin excretion as prognostic markers for 10‐year mortality after myocardial infarction. Clin Cardiol. 2010;33:508–515. [DOI] [PMC free article] [PubMed] [Google Scholar]
- 22. Stehouwer CD, Smulders YM. Microalbuminuria and risk for cardiovascular disease: analysis of potential mechanisms. J Am Soc Nephrol. 2006;17:2106–2111. [DOI] [PubMed] [Google Scholar]
- 23. Kshirsagar AV, Bomback AS, Bang H, Gerber LM, Vupputuri S, Shoham DA, Mazmudar M, Ballantyne CM, Paparello JJ, Klemmer PJ. Association of C‐reactive protein and microalbuminuria (from the National Health and Nutrition Examination Surveys, 1999 to 2004). Am J Cardiol. 2008;101:401–406. [DOI] [PMC free article] [PubMed] [Google Scholar]
- 24. Ross R. The pathogenesis of atherosclerosis: a perspective for the 1990s. Nature. 1993;362:801–809. [DOI] [PubMed] [Google Scholar]
- 25. Choi BJ, Prasad A, Gulati R, Best PJ, Lennon RJ, Barsness GW, Lerman LO, Lerman A. Coronary endothelial dysfunction in patients with early coronary artery disease is associated with the increase in intravascular lipid core plaque. Eur Heart J. 2013;34:2047–2054. [DOI] [PMC free article] [PubMed] [Google Scholar]
- 26. Deckert T, Feldt‐Rasmussen B, Borch‐Johnsen K, Jensen T, Kofoed‐Enevoldsen A. Albuminuria reflects widespread vascular damage. The Steno hypothesis. Diabetologia. 1989;32:219–226. [DOI] [PubMed] [Google Scholar]
- 27. HOPE Study Investigators . Effects of ramipril on cardiovascular and microvascular outcomes in people with diabetes mellitus: results of the HOPE study and MICRO‐HOPE substudy. Heart Outcomes Prevention Evaluation Study Investigators. Lancet. 2000;355:253–259. [PubMed] [Google Scholar]
- 28. Ibsen H, Olsen MH, Wachtell K, Borch‐Johnsen K, Lindholm LH, Mogensen CE, Dahlof B, Devereux RB, de Faire U, Fyhrquist F, Julius S, Kjeldsen SE, Lederballe‐Pedersen O, Nieminen MS, Omvik P, Oparil S, Wan Y. Reduction in albuminuria translates to reduction in cardiovascular events in hypertensive patients: losartan intervention for endpoint reduction in hypertension study. Hypertension. 2005;45:198–202. [DOI] [PubMed] [Google Scholar]
- 29. Ibsen H, Wachtell K, Olsen MH, Borch‐Johnsen K, Lindholm LH, Mogensen CE, Dahlof B, Devereux RB, de Faire U, Fyhrquist F, Julius S, Kjeldsen SE, Lederballe‐Pedersen O, Nieminen MS, Omvik P, Oparil S, Wan Y; LIFE substudy . Does albuminuria predict cardiovascular outcome on treatment with losartan versus atenolol in hypertension with left ventricular hypertrophy? A LIFE substudy. J Hypertens. 2004;22:1805–1811. [DOI] [PubMed] [Google Scholar]
- 30. Microvascular complications and foot care. Diabetes Care. 2016;39(suppl 1):S72–S80. [DOI] [PubMed] [Google Scholar]
- 31. Lee CC, Adler AI. Recent findings on the effects of marine‐derived n‐3 polyunsaturated fatty acids on urinary albumin excretion and renal function. Curr Atheroscler Rep. 2012;14:535–554. [DOI] [PubMed] [Google Scholar]
- 32. Miller ER III, Juraschek ST, Appel LJ, Mandala M, Anderson CA, Bleys J, Guallar E. The effect of n‐3 long chain polyunsaturated fatty acid supplementation on urine protein excretion and kidney function: meta‐analysis of clinical trials. Am J Clin Nutr. 2009;89:1937–1945. [DOI] [PMC free article] [PubMed] [Google Scholar]
- 33. Shimizu H, Ohtani K, Tanaka Y, Sato N, Mori M, Shimomura Y. Long‐term effect of eicosapentaenoic acid ethyl (EPA‐E) on albuminuria of non‐insulin dependent diabetic patients. Diabetes Res Clin Pract. 1995;28:35–40. [DOI] [PubMed] [Google Scholar]
- 34. Okuda Y, Mizutani M, Ogawa M, Sone H, Asano M, Asakura Y, Isaka M, Suzuki S, Kawakami Y, Field JB, Yamashita K. Long‐term effects of eicosapentaenoic acid on diabetic peripheral neuropathy and serum lipids in patients with type II diabetes mellitus. J Diabetes Complications. 1996;10:280–287. [DOI] [PubMed] [Google Scholar]
- 35. Zeman M, Zak A, Vecka M, Tvrzická E, Písaríková A, Stanková B. N‐3 fatty acid supplementation decreases plasma homocysteine in diabetic dyslipidemia treated with statin‐fibrate combination. J Nutr Biochem. 2006;17:379–384. [DOI] [PubMed] [Google Scholar]
- 36. Miller ER III, Juraschek SP, Anderson CA, Guallar E, Henoch‐Ryugo K, Charleston J, Turban S, Bennett MR, Appel LJ. The effects of n‐3 long‐chain polyunsaturated fatty acid supplementation on biomarkers of kidney injury in adults with diabetes: results of the GO‐FISH trial. Diabetes Care. 2013;36:1462–1469. [DOI] [PMC free article] [PubMed] [Google Scholar]
- 37. Poggio ED, Wang X, Greene T, Van Lente F, Hall PM. Performance of the modification of diet in renal disease and Cockcroft‐Gault equations in the estimation of GFR in health and in chronic kidney disease. J Am Soc Nephrol. 2005;16:459–466. [DOI] [PubMed] [Google Scholar]
- 38. Welty FK, Alfaddagh A, Elajami TK. Targeting inflammation in metabolic syndrome. Transl Res. 2016;167:257–280. [DOI] [PMC free article] [PubMed] [Google Scholar]
- 39. Alberti KG, Eckel RH, Grundy SM, Zimmet PZ, Cleeman JI, Donato KA, Fruchart JC, James WP, Loria CM, Smith SC Jr; International Diabetes Federation Task Force on Epidemiology and Prevention; National Heart, Lung, and Blood Institute; American Heart Association; World Heart Federation; International Atherosclerosis Society; International Association for the Study of Obesity . Harmonizing the metabolic syndrome: a joint interim statement of the International Diabetes Federation Task Force on Epidemiology and Prevention; National Heart, Lung, and Blood Institute; American Heart Association; World Heart Federation; International Atherosclerosis Society; and International Association for the Study of Obesity. Circulation. 2009;120:1640–1645. [DOI] [PubMed] [Google Scholar]
- 40. Chachati A, von Frenckell R, Foidart‐Willems J, Godon JP, Lefebvre PJ. Variability of albumin excretion in insulin‐dependent diabetics. Diabet Med. 1987;4:441–445. [DOI] [PubMed] [Google Scholar]
- 41. Gomes MB, Goncalves MF. Is there a physiological variability for albumin excretion rate? Study in patients with diabetes type 1 and non‐diabetic individuals. Clin Chim Acta. 2001;304:117–123. [DOI] [PubMed] [Google Scholar]
- 42. Hansen HP, Hovind P, Jensen BR, Parving HH. Diurnal variations of glomerular filtration rate and albuminuria in diabetic nephropathy. Kidney Int. 2002;61:163–168. [DOI] [PubMed] [Google Scholar]
- 43. Naresh CN, Hayen A, Craig JC, Chadban SJ. Day‐to‐day variability in spot urine protein‐creatinine ratio measurements. Am J Kidney Dis. 2012;60:561–566. [DOI] [PubMed] [Google Scholar]
- 44. Witte EC, Lambers Heerspink HJ, de Zeeuw D, Bakker SJ, de Jong PE, Gansevoort R. First morning voids are more reliable than spot urine samples to assess microalbuminuria. J Am Soc Nephrol. 2009;20:436–443. [DOI] [PMC free article] [PubMed] [Google Scholar]
- 45. Miller WG, Bruns DE, Hortin GL, Sandberg S, Aakre KM, McQueen MJ, Itoh Y, Lieske JC, Seccombe DW, Jones G, Bunk DM, Curhan GC, Narva AS; National Kidney Disease Education Program IWGoSoAiU . Current issues in measurement and reporting of urinary albumin excretion. Clin Chem. 2009;55:24–38. [DOI] [PubMed] [Google Scholar]
- 46. Mogensen CE, Vestbo E, Poulsen PL, Christiansen C, Damsgaard EM, Eiskjaer H, Froland A, Hansen KW, Nielsen S, Pedersen MM. Microalbuminuria and potential confounders. A review and some observations on variability of urinary albumin excretion. Diabetes Care. 1995;18:572–581. [DOI] [PubMed] [Google Scholar]
- 47. Brinkman JW, de Zeeuw D, Duker JJ, Gansevoort RT, Kema IP, Hillege HL, de Jong PE, Bakker SJ. Falsely low urinary albumin concentrations after prolonged frozen storage of urine samples. Clin Chem. 2005;51:2181–2183. [DOI] [PubMed] [Google Scholar]
- 48. Brinkman JW, de Zeeuw D, Gansevoort RT, Duker JJ, Kema IP, de Jong PE, Bakker SJ. Prolonged frozen storage of urine reduces the value of albuminuria for mortality prediction. Clin Chem. 2007;53:153–154. [DOI] [PubMed] [Google Scholar]
- 49. Xie X, Atkins E, Lv J, Bennett A, Neal B, Ninomiya T, Woodward M, MacMahon S, Turnbull F, Hillis GS, Chalmers J, Mant J, Salam A, Rahimi K, Perkovic V, Rodgers A. Effects of intensive blood pressure lowering on cardiovascular and renal outcomes: updated systematic review and meta‐analysis. Lancet. 2016;387:435–443. [DOI] [PubMed] [Google Scholar]
- 50. Schmieder RE, Mann JF, Schumacher H, Gao P, Mancia G, Weber MA, McQueen M, Koon T, Yusuf S; ONTARGET Investigators . Changes in albuminuria predict mortality and morbidity in patients with vascular disease. J Am Soc Nephrol. 2011;22:1353–1364. [DOI] [PMC free article] [PubMed] [Google Scholar]
- 51. de Zeeuw D, Hillege HL, de Jong PE. The kidney, a cardiovascular risk marker and a new target for therapy. Kidney Int. 2005;98:S25–S29. [DOI] [PubMed] [Google Scholar]
- 52. Shapiro H, Theilla M, Attal‐Singer J, Singer P. Effects of polyunsaturated fatty acid consumption in diabetic nephropathy. Nat Rev Nephrol. 2011;7:110–121. [DOI] [PubMed] [Google Scholar]
- 53. Stirban A, Nandrean S, Götting C, Tamler R, Pop A, Negrean M, Gawlowski T, Stratmann B, Tschoepe D. Effects of n‐3 fatty acids on macro‐ and microvascular function in subjects with type 2 diabetes mellitus. Am J Clin Nutr. 2010;91:808–813. [DOI] [PubMed] [Google Scholar]
- 54. Thomas G, Sehgal AR, Kashyap SR, Srinivas TR, Kirwan JP, Navaneethan SD. Metabolic syndrome and kidney disease: a systematic review and meta‐analysis. Clin J Am Soc Nephrol. 2011;6:2364–2373. [DOI] [PMC free article] [PubMed] [Google Scholar]
- 55. Keane WF. The role of lipids in renal disease: future challenges. Kidney Int Suppl. 2000;75:S27–S31. [PubMed] [Google Scholar]
- 56. Oda H, Keane WF. Lipids in progression of renal disease. Kidney Int Suppl. 1997;62:S36–S38. [PubMed] [Google Scholar]
- 57. Basu R, Chandramouli V, Dicke B, Landau B, Rizza R. Obesity and type 2 diabetes impair insulin‐induced suppression of glycogenolysis as well as gluconeogenesis. Diabetes. 2005;54:1942–1948. [DOI] [PubMed] [Google Scholar]
- 58. Glauber H, Wallace P, Griver K, Brechtel G. Adverse metabolic effect of omega‐3 fatty acids in non‐insulin‐dependent diabetes mellitus. Ann Intern Med. 1988;108:663–668. [DOI] [PubMed] [Google Scholar]