

Abstract
Background
Human induced pluripotent stem cell–derived cardiomyocytes (hiPSC‐CMs) can recapitulate features of ion channel mutations causing inherited rhythm disease. However, the lack of maturity of these cells is considered a significant limitation of the model. Prolonged culture of hiPSC‐CMs promotes maturation of these cells. We studied the electrophysiological effects of the I230T mutation in the sodium channel gene SCN5A in hiPSC‐CMs generated from a homozygous (I230Thomo) and a heterozygous (I230Thet) individual from a family with recessive cardiac conduction disease. Since the I230T mutation occurs in the developmentally regulated “adult” isoform of SCN5A, we investigated the relationship between the expression fraction of the adult SCN5A isoform and the electrophysiological phenotype at different time points in culture.
Methods and Results
After a culture period of 20 days, sodium current (IN a) was mildly reduced in I230Thomo hiPSC‐CMs compared with control hiPSC‐CMs, while I230Thet hiPSC‐CMs displayed no reduction in IN a. This coincided with a relatively high expression fraction of the “fetal” SCN5A isoform compared with the adult isoform as measured by quantitative polymerase chain reaction. Following prolonged culture to 66 days, the fraction of adult SCN5A isoform increased; this was paralleled by a marked decrease in IN a in I230Thomo hiPSC‐CMs, in line with the severe clinical phenotype in homozygous patients. At this time in culture, I230Thet hiPSC‐CMs displayed an intermediate loss of IN a, compatible with a gene dosage effect.
Conclusions
Prolonged culture of hiPSC‐CMs leads to an increased expression fraction of the adult sodium channel isoform. This new aspect of electrophysiological immaturity should be taken into account in studies that focus on the effects of SCN5A mutations in hiPSC‐CMs.
Keywords: arrhythmia (heart rhythm disorders), sodium channels, stem cell
Subject Categories: Ion Channels/Membrane Transport, Stem Cells, Basic Science Research
Clinical Perspectives
What is New?
In human induced pluripotent stem cell‐derived cardiomyocytes (hiPSC‐CMs), a relatively high expression fraction of the developmentally regulated “fetal” isoform of the sodium channel gene SCN5A is present, in line with the immature phenotype of hiPSC‐CMs.
Consequently, the observed electrophysiological effects of SCN5A mutations in hiPSC‐CMs, in particular those that are present in the isoform‐specific exon 6, may not represent the true effects that occur in vivo.
Extending the time in culture of hiPSC‐CMS increases the relative expression of the “adult” SCN5A isoform and uncovers the complete electrophysiological phenotype of a mutation that occurs in exon 6 of SCN5A.
What are the Clinical Implications?
When the hiPSC model is applied to study cellular electrophysiological mechanisms of disease‐causing SCN5A mutations, the SCN5A isoform expression should be taken into account.
Introduction
The cardiac sodium channel Nav1.5, encoded by SCN5A, mediates the cardiac sodium current (I Na) and is crucial for the rapid depolarization of cardiomyocytes (CMs) and impulse propagation in the heart.1 Mutations in SCN5A have been associated with a broad spectrum of inherited cardiac rhythm disorders,2 and electrophysiological studies on these mutations in heterologous expression systems such as human embryonic kidney (HEK) cells have provided insights into the underlying mechanisms. Yet, limitations inherent to these cellular models, such as their non‐CM nature and the fact that the mutant channel is overexpressed, have hindered the faithful recapitulation of sodium channel defects underlying these disorders. The ability to derive human CMs from induced pluripotent stem cells (hiPSC‐CMs)3, 4 from patients with these disorders now allows us to study the consequences of SCN5A mutations in the CM setting, promising a refined understanding of the associated mechanisms and faithful models for the discovery of new therapies. Notwithstanding, while a number of studies have demonstrated that hiPSC‐CMs can recapitulate the predicted cellular electrophysiological phenotype caused by SCN5A mutations,5, 6 it is widely recognized that hiPSC‐CMs are relatively immature.7 This aspect needs to be considered in the interpretation of data obtained from these cells.
Here, we revisited the pathophysiology of the I230T (c.689T>C) mutation in SCN5A by studying patient‐derived hiPSC‐CMs.8 In contrast to the majority of mutations in SCN5A that display an autosomal dominant inheritance pattern, the I230T mutation displayed recessive inheritance with homozygous carriers being severely affected by sinus node dysfunction, conduction disease, and severe ventricular arrhythmias at young age, whereas heterozygous carriers displayed mild or no symptoms.8 Functional data on this mutation in HEK cells overexpressing the mutant channel revealed decreased I Na and shifts in voltage dependence of activation and inactivation. In an effort to refine our understanding of the defects associated with this mutation, we compared sodium channel function in hiPSC‐CMs from a heterozygous and a homozygous carrier of the I230T mutation and 2 unrelated control individuals. hiPSC‐CMs from the homozygous and heterozygous carriers displayed a drastic and a moderate reduction in I Na, respectively, attesting to a mutant allele dosage effect. Interestingly, we observed that the severity of I Na loss and the associated biophysical defects varied with the duration of hiPSC‐CM culture, with prolonged culture leading to a more pronounced biophysical defect. Importantly, this effect paralleled the increased expression of the so‐called adult SCN5A isoform that is most abundant in the adult human heart. This “adult” isoform differs from the “fetal” SCN5A isoform in the alternate usage of exon 6. Splicing of exon 6 occurs in a mutually exclusive manner, with inclusion of either the adult exon 6 (in which the I230T mutation is present) or the fetal exon 6a.9, 10 The relatively high expression of fetal SCN5A isoform is a new feature of immaturity that fits with the fetal phenotype of hiPSC‐CMs. Our study underscores the importance of taking into account this aspect in studies aimed at elucidating the genotype‐phenotype relationship in hiPSC‐CMs.
Methods
Generation and Characterization of hiPSC
Skin punch biopsies were performed from a heterozygous and a homozygous carrier of the I230T mutation following written informed consent and approval by the medical ethics committee of the University of Münster. Fibroblasts obtained from these biopsies were reprogrammed following Melton's protocol.11 Retroviruses were produced in HEK293T cells using Fugene 6 transfection with Addgene plasmids 8454 (VSV‐G envelope), 8449 (packaging plasmid), 17217 (OCT4), 17218 (SOX2), 17219 (KLF4), and 17220 (MYC).12 Cell lines displaying typical human embryonic stem cell morphology were further characterized according to standard assays.13 In brief, mutations were confirmed using Sanger DNA sequencing. Transgene silencing in clonal hiPSC lines was monitored using primers given in Table S1. Karyotypes were determined based on chromosome counting using standard procedures. Human embryonic stem cell marker gene expression was assessed using standard real‐time quantitative polymerase chain reaction (qPCR) analysis (Table S1). Pluripotency was assessed by spontaneous in vitro differentiation as embryoid bodies, followed by cell aggregate plating and maturation in serum‐containing media. Test differentiation along the cardiac lineage was performed as described.14 Immunocytochemistry was performed according to standard procedures using antibodies α‐SMA (Dako #M0851, 1:100), α‐AFP (Dako #A0008, 1:300), α‐β‐III Tubulin (Sigma #T8660, 1:1000), and α‐Actinin (Sigma #A7811, 1:800). One heterozygous and one homozygous hiPSC line showing near‐complete transgene silencing and overall human embryonic stem cell–like characteristics according to these assays were used for further studies. The control hiPSC lines (Ctrl1 and Ctrl2), originating from unrelated individuals, were generated using a lentiviral vector carrying the same transcription factors as the retroviruses used for the patient cell lines. The generation and characterization of these hiPSC lines has been previously described.15, 16
Differentiation of hiPSCs Into CMs and Dissociation Into Single Cells
All hiPSC lines were expanded and cultured in feeder‐free conditions on Matrigel‐coated dishes in the presence of chemically defined medium (E8 Essential Medium, Life Technologies). Differentiation of hiPSC to CMs was performed during the indicated time periods, as previously described.17 Briefly, undifferentiated hiPSCs were treated with CHIR99021 (12 μmol/L, Selleckchem) for 24 hours, followed by treatment with the Wnt inhibitor IWP4 (5 μmol/L, Stemgent) on days 4 and 5. At the stipulated time points (Figure S1), enrichment for CMs was achieved by substituting the culture medium to DMEM supplemented with lactic acid (4 mmol/L) in the absence of glucose for 4 to 6 days, as previously described.18 For electrophysiological measurements, hiPSC‐CMs were enzymatically dissociated into single cells using Elastase (Serva) and Liberase (Roche Chemicals),19 plated at a low density on Matrigel‐coated coverslips and measured 8 to 11 days after dissociation. For gene expression analysis, cells were lysed directly upon the 4 to 6 days of lactate treatment. Samples for electrophysiological measurements and RNA expression analysis were matched for their duration in culture (Figure S1).
RNA Isolation and SCN5A Isoform Expression Assay
RNA was isolated according to the manufacturer's protocol from at least 3 independent hiPSC‐CM differentiations of each of the 3 hiPSC lines using the NucleoSpin RNA isolation kit (Machery‐Nagel) (Figure S1). The adult heart RNA was obtained from 3 samples of nondiseased ventricular tissue obtained from an adult donor whose heart was explanted for heart transplantation but was not used because of logistical reasons.20 For these samples, Trizol (Invitrogen) was used according to the manufacturer's instructions. cDNA was generated from 500 ng of RNA by reverse transcriptase (Superscript II, Life Technologies) using oligo(dT) primers. To determine transcript abundance, qPCR was conducted with SYBR green on a Roche LightCycler 480 real‐time polymerase chain reaction (RT‐PCR) system. All measurements were conducted in triplicate. Gene expression levels were analyzed using the LinReg PCR program.21 To distinguish transcripts corresponding to the fetal and adult SCN5A isoforms, we used isoform‐specific forward primers that selectively anneal to the fetal or adult exon 6 together with a reverse primer in exon 7. For calibration purposes, we included in the same plate samples with predetermined template ratios of 1:8, 1:4, 1:2, 1:1, 2:1, 4:1, and 8:1 of adult:fetal SCN5A. For this purpose, we first cloned the PCR products corresponding to the specific isoforms into the PCR2.1 TOPO vector and subsequently quantified the concentration of the generated plasmid using the Quant‐iT PicoGreen dsDNA assay kit (Thermo Fisher Scientific) in 3 independent experiments. The primers, which were intron‐spanning, are depicted in Table S1. CT values >35 were considered to be indicative of transcripts below the detection limit. Specificity of the primers for all amplicons was confirmed by Sanger sequencing of the amplicons.
Minigene Assay
For the minigene assay, a genomic region from nucleotide 38 654 626 to nucleotide 38 656 642 of chromosome 3 (numbering according to human genome assembly hg19; extending from 1091 bp upstream of exon 6a to 614 bp downstream of exon 6) was amplified using genomic DNA from the hiPSC Ctrl1 line as template and subsequently cloned into the plasmid RHCglo.22 The SCN5A c.689T>C (I230T) mutation was introduced by means of the QuikChange mutagenesis kit according to the manufacturer's instructions, after which the sequence of the whole plasmid was verified by Sanger sequencing. The construct was transfected into the cardiac cell line H1023 using Lipofectamine 2000. RNA was isolated 2 days after transfection by means of the NucleoSpin RNA isolation kit (Machery‐Nagel). After generating cDNA by reverse transcriptase (Superscript II, Life Technologies) using 500 ng of RNA, exon usage was evaluated by RT‐PCR with primers A and D that annealed to the plasmid exons located at 5′ and 3′ of exon 6a and 6, respectively, and by qPCR using primer sets A–B and C–D that were exon specific for exons 6a or 6, respectively.
Cellular Electrophysiology
Data acquisition and analysis
Action potentials (APs) and I Na were recorded using an Axopatch 200B amplifier (Molecular Devices). Voltage control, data acquisition, and analysis were realized with custom software. The liquid junction potentials were 15 and 2.5 mV for AP and I Na measurements, respectively, and potentials were corrected accordingly. Signals were low‐pass filtered with a cutoff of 5 kHz and digitized at 40 and 20 kHz for APs and I Na, respectively. Cell membrane capacitance (C m) was determined at a −5 mV voltage step from −40 mV by dividing the time constant of the decay of the capacitive transient by the series resistance. For all cell lines and experiments, data were collected from at least 3 independent differentiations.
Action potentials
APs were recorded at 36±0.2°C from single hiPSC‐CMs using the amphotericin B–perforated patch clamp technique. Spontaneously beating hiPSC‐CMs demonstrating regular and synchronous contractions at 3 to 10 seconds were selected. Patch pipettes (borosilicate glass; resistance ≈2.0 MΩ) contained (in mmol/L): 125 potassium gluconate, 20 KCl, 5 NaCl, 0.44 amphotericin‐B, 10 HEPES; pH 7.2 (potassium hydroxide). Bath solution was composed of (in mmol/L): 140 NaCl, 5.4 KCl, 1.8 CaCl2, 1.0 MgCl2, 5.5 glucose, 5.0 HEPES, and pH 7.4 (NaOH). To overcome the lack of the inward rectifier potassium current, I K1, which is a typical feature of hiPSC‐CMs that limits the functional availability of I Na and transient outward potassium current I To 24, 25, we injected an in silico I K1 with kinetics of Kir2.1 channels through dynamic clamp, as previously described.19 An amount of 2 pA/pF peak outward current was applied, resulting in quiescent hiPSC‐CMs with a resting membrane potential (RMP) of −80 mV or more negative. APs were elicited at 1 Hz by 3 ms, ≈1.2× threshold current pulses through the patch pipette. AP parameters that were characterized were RMP; maximum AP amplitude; AP duration at 20%, 50%, and 80% of repolarization; maximal upstroke velocity; and plateau amplitude (measured 20 ms after the AP upstroke). Averages were taken from 10 consecutive APs.
Sodium currents
I Na was recorded in the whole‐cell configuration of the patch clamp technique using voltage clamp protocols as depicted in the figures. I Na was defined as the difference between peak and steady‐state current. In all protocols, a holding potential of −100 mV and a cycle length of 5 seconds was used. For I Na density and voltage dependence of activation, depolarizing pulses were applied ranging from −100 to 30 mV (see the inset of figures 2A and 5A). For voltage dependence of inactivation, currents were determined at −20 mV preceded by a conditional step ranging from −120 to −20 mV. Recovery of inactivation was measured using a 2‐step pulse protocol to −20 mV, by which the interpulse interval varied between 1 and 1000 ms. Currents at the second pulse were normalized to currents at the first pulse and plotted against the interval between the 2 pulses (see the inset of Figure S2D). To ensure proper voltage control, I Na was measured at room temperature with a low extracellular Na+ concentration and series resistances were compensated for ≥85% (see Table S2 for average cell capacitance and series resistances). The pipette solution contained (in mmol/L): 3.0 NaCl, 133 CsCl, 2.0 MgCl2, 2.0 Na2ATP, 2.0 TEACl, 10 EGTA, 5.0 HEPES, and pH 7.2 (CsOH). Bath solution contained (in mmol/L): 20 NaCl, 120 CsCl, 1.8 CaCl2, 1.2 MgCl2, 11.0 glucose, 5.0 HEPES, nifedipine 0.01, and pH 7.4 (CsOH). I Na density was calculated by dividing current by C m. Cells that lacked I Na completely (in <5% of the cells) were excluded from analysis. Steady‐state activation and inactivation curves were fitted by using a Boltzmann equation: I/I max=A/{1.0+exp[(V 1/2−V)/k]}, in which V 1/2 was half‐maximum (in)activation potential and k was the slope factor. Recovery from inactivation and the speed of current inactivation were fitted with a biexponential function: y=y 0+A f{1−exp[−t/τf]}+A s{1−exp[−t/τs]}), where A f and A s represent the amplitudes of the fast and slow components and τf and τs indicate the time constants of fast and slow components, respectively.
Statistical Analysis
Statistical analysis was conducted using SPSS statistical software version 22 (IBM Corp). Normality was tested by visual inspection of histograms of the data and by Shapiro–Wilk tests, and equality of variance was assessed by Levene's test. For normally distributed parameters, groups were compared by 2‐sided t tests for 2 groups or 1‐way ANOVA for multiple groups followed by Bonforroni post hoc tests. Mann–Whitney U tests and Kruskal–Wallis tests were applied for non‐normally distributed parameters. Data are presented as mean± SEM. Statistical significance is defined by P<0.05.
Results
Patient Characteristics and Generation of hiPSCs
Skin biopsies were performed in 2 family members of a previously reported consanguineous family that included individuals carrying the c.689T>C (I230T) mutation in SCN5A in the heterozygous or homozygous state.8 The first donor was a 16‐year‐old female homozygous mutation carrier, in whom sick sinus syndrome was first diagnosed at the age of 4 without any clinical symptoms. The initial Holter ECG showed sinus bradycardia (minimal heart rate of 35 beats per minute) with AV block II or III°, marked QRS prolongation, and episodes of tachycardia caused by atrial fibrillation with heart rates of 144 to 202 beats per minute. She was treated with sotalol and received a pacemaker at the age of 5. A follow‐up ECG showed normal sinus rhythm, and sotalol treatment was stopped. Her baseline ECG is depicted in Figure 1A. The second donor was the 43‐year‐old mother of the patient described above who was a heterozygous carrier of the same SCN5A mutation. She showed no signs of sinus conduction disease and never displayed symptomatic arrhythmia or syncope in the past. Also, presence of latent Brugada syndrome was excluded by ajmaline challenge. Skin fibroblasts of these 2 patients were reprogrammed into hiPSCs (annotated as I230Thet and I230Thomo for the heterozygous and homozygous patient, respectively). We confirmed the karyotype (Figure 1B) and verified that expression of the transgenes MYC, OCT4, SOX2, and KLF4 were silenced in the selected clones (Figure 1C). Pluripotency was confirmed by immunostainings in spontaneously differentiated cultures, demonstrating expression of protein markers from the 3 germ layers, endoderm, ectoderm, and mesoderm (Figure 1D). Moreover, robust expression of pluripotency genes was confirmed by qPCRs in the hiPSC lines, in which expression levels were similar to the expression levels in the established human embryonic stem cell line NCL3 (Figure 1E). The ability of the hiPSCs to differentiate into CMs was confirmed by α‐actinin stainings after directed differentiation (Figure 1F). The presence of the c.689T>C mutation was confirmed by Sanger sequencing. For the control hiPSC lines (Ctrl1 and Ctrl2), the generation and complete characterization have been previously described.15
Figure 1.

Clinical characteristics and characterization of human induced pluripotent stem cells (hiPSCs) generated from the heterozygous I230T mutation carrier (I230Thet) and the homozygous I230T mutation carrier (I230Thomo). A, Baseline ECG of the I230Thomo mutation carrier, showing a bradycardia, first‐degree AV block and marked QRS prolongation. The scale bar indicates 1 mV (vertical) and 200 ms (horizontal). B, I230Thet and I230Thomo exhibited normal karyotypes. C, Expression of the transgenes OCT4, SOX2, KLF4, and MYC was silenced in the selected clones. D, Immunostainings of α‐fetoprotein (AFP), smooth muscle actin (SMA), and β‐III tubulin in spontaneously differentiated hiPSCs demonstrating presence of cells from the 3 germ layers endoderm, mesoderm, and ectoderm, respectively. E, Quantification of pluripotency gene expression relative to their expression in the human embryonic stem cell (hESC) line NCL3, demonstrating similar expression levels. F, Immunostaining of α‐actinin after directed differentiation of the hiPSCs into cardiomyocytes.
Mild Electrophysiological Defects in I230Thet and I230Thomo hiPSC‐CMs After Short‐Term Culture
hiPSC were differentiated into CMs for 8 days, treated with lactate for 4 to 5 days, and dissociated into single cells. Electrophysiological parameters were measured 8 to 11 days after dissociation. Figure 2A shows typical I Na recordings, and the average current densities, activation, and inactivation characteristics are summarized in Figure 2B through 2D. In contrast to the severe conduction disease phenotype in the homozygous mutation carrier from which they were derived, I230Thomo hiPSC‐CMs displayed only mild I Na and AP abnormalities. At potentials of −55 to −35 mV, I Na density was slightly reduced compared with Ctrl1 and Ctrl2 (P<0.05), and maximal peak current density was reduced by ≈30%, although this difference did not reach statistical significance (Figure 2B). Voltage dependence of activation of I230Thomo hiPSC‐CMs was shifted by 5 mV towards more depolarized potentials, while voltage dependence of inactivation was unchanged (Figure 2C and 2D). All these I Na parameters did not differ between I230Thet hiPSC‐CMs and the 2 Ctrls (Figure 2B through 2D). Figure 2E shows typical APs, and average AP characteristics are summarized in Figure 2F through 2H. APs were measured with in silico injection of I K1 by dynamic clamp. Consequently, APs had RMP negative to −80 mV and upstroke velocities of >100 V/s, indicating an I Na‐driven AP upstroke, as previously reported.19, 26 Although a trend towards a difference in maximal upstroke velocity was observed (P=0.056, ANOVA), none of the AP parameters differed significantly between Ctrl1, Ctrl2, I230Thet, and I230Thomo hiPSC‐CMs (Figure 2F through 2H). In summary, the mild electrophysiological abnormalities of I230Thomo hiPSC‐CMs contradicted with the severe conduction disturbances observed in the homozygous patient. They also contrasted with the previously reported electrophysiological data obtained in HEK293 cells overexpressing the mutated channel, in which a severe loss of function in I Na (a reduction of 70% in current density and a depolarizing shift of +15 mV in V 1/2 of activation) was demonstrated.8 We reasoned that the immaturity of the hiPSC‐CMs used in this experiment might have played a role.
Figure 2.

Initial assessment of sodium currents (IN a) (A through D) and action potentials (APs) (E through H) in human induced pluripotent stem cell–derived cardiomyocytes (hiPSC‐CMs) harboring the homozygous and heterozygous SCN5A mutation I230T (I230Thomo and I230Thet, respectively) as compared with hiPSC‐CMs from the 2 control cell lines (Ctrl1 and Ctrl2). A, Typical traces of IN a in hiPSC‐CMs from the Ctrl1 (n=28), Ctrl2 (n=23), I230Thet (n=31), and I230Thomo (n=30) groups as determined with the voltage clamp protocol depicted in the left panel (with cycle length of 5 seconds). B, Average current‐voltage relationships of I Na. # and * indicate P<0.05 vs Ctrl1 and Ctrl2, respectively (Kruskal–Wallis test followed by Bonferroni‐corrected pairwise comparisons). C, Voltage dependence of activation demonstrates a depolarizing shift in half‐maximum voltage of activation (V 1/2) of 5 mV in I230Thomo compared with the other groups (P<0.05; ANOVA, Bonferroni post hoc test). D, Voltage dependence of inactivation (Ctrl1, n=17; Ctrl2, n=20; I230Thet, n=21; I230Thomo, n=15). E, Representative APs measured at 1 Hz in the Ctrl1 (n=16), Ctrl2 (n=15), I230Thet (n=13), and I230Thomo (n=13) groups. The inset shows the first derivative of the initial phase of the AP. F through H, Average action potential characteristics. Action potential duration (APD; F), maximal upstroke velocity (V max; G), resting membrane potential (RMP), and action potential amplitude (APA) (H) were not statistically different between all groups.
The Fraction of Adult to Fetal SCN5A Isoform in hiPSC‐CMs Increases With Prolonged Culture
We noted that the SCN5A mutation I230T is located in exon 6, an alternatively spliced exon of the SCN5A pre‐mRNA in the human heart. The developmentally timed alternative splicing of exon 6 generates 2 splice isoforms of SCN5A: 1 containing the canonical exon 6 (the adult isoform) and 1 containing exon 6a (the fetal isoform), which differ by 7 amino acid residues within the S3 and S4 (voltage sensor) transmembrane segments of the first domain (D1/S3–S4) (Figure 3A).9, 10 As the I230T mutation is located in the canonical exon 6, we hypothesized that the mild electrophysiological phenotype we observed in the mutant hiPSC‐CMs was related to this splice event. Since hiPSC‐CMs are relatively immature, we posited that the hiPSC‐CMs we measured primarily expressed the fetal isoform of SCN5A, which does not contain the mutation. Accordingly, we next determined the fractions of fetal and adult SCN5A isoforms in Ctrl1, Ctrl2, I230Thet, and I230Thomo hiPSC‐CMs, and compared them with isoform fractions in adult human heart samples (Figure 3B). All groups had a significantly lower percentage of adult isoform expression compared with adult human heart samples, in which expression of the fetal isoform was virtually absent. The relatively low expression of the adult isoform in these hiPSC‐CMs could mask the full effects of the I230T mutation, which could underlie the mild electrophysiological phenotype we observed in the studies described above. Interestingly, both I230Thet and I230Thomo exhibited higher fractions of adult SCN5A isoform compared with Ctrl1 and Ctrl2, with I230Thomo demonstrating the highest fraction.
Figure 3.

Expression fractions of adult and fetal SCN5A isoform in human induced pluripotent stem cell–derived cardiomyocytes (hiPSC‐CMs). A, Alternative splicing of exon 6 in SCN5A. Positions of the isoform‐specific primers are depicted. B, Average adult and fetal SCN5A fractions in hiPSC‐CMs cultured for 20 days from control 1 (Ctr1l; n=6), control 2 (Ctrl2; n=3), heterozygous I230T (I230Thet; n=3), homozygous I230T (I230Thomo; n=4), and adult human heart samples (n=3). The sum of the total fetal and adult transcripts detected is set to 1. Adult SCN5A fractions of all groups of hiPSC‐CMs are lower than the fractions in adult hearts, in which expression of the fetal isoform is virtually absent. C, SCN5A isoform fractions in Ctrl1 hiPSC‐CMs after 20 days (20d; n=6), 36 days (36d; n=6), 51 days (51d; n=4), and 66 days (66d; n=7), demonstrating a gradual increase in adult isoform expression. D, Comparison of SCN5A fractions at 20 days and 66 days in culture in hiPSC‐CMs from Ctrl1 (n=6, 7), Ctrl2 (n=3, 3) I230Thet (n=3, 6), and I230Thomo (n=4, 4). An increase in adult isoform expression is observed in all groups upon extended time in culture. *P<0.05 (ANOVA, post hoc Bonferroni tests).
Since a number of reports have documented the stimulating effect of extended time in culture in promoting the maturation state of hiPSC‐CMs,27, 28, 29 we next evaluated mRNA fractions of fetal and adult SCN5A isoforms after prolonged culture. In Ctrl1 hiPSC‐CMs, we observed a gradual increase in the adult SCN5A isoform fraction with extended time in culture, eventually reaching a percentage of ≈50% after 66 days (Figure 3C). An increase in adult SCN5A fraction was also observed in Ctrl2, I230Thet, and I230Thomo hiPSC‐CMs, reaching 57%, 76%, and 87%, respectively, at day 66 (Figure 3D).
The c.689T>C (I230T) SCN5A Mutation Enhances Usage of Adult Exon 6
We observed increased fractions of adult SCN5A isoform expression in the 2 mutant cell lines, as compared with the 2 controls. This difference could either relate to line‐to‐line variability or to the effect of the c.689T>C mutation on alternate usage of exon 6 over exon 6a. In support of the latter, using in silico prediction tools,30 we noted that the c.689T>C mutation introduces a splice enhancer motif (CTATATC‐>CTACATC), which could favor the usage of exon 6. We therefore tested this possibility by means of a minigene splice assay. For this, wildtype and mutant minigene constructs were generated encompassing exon 6a, exon 6, and flanking regions (Figure 4A, top panel). These were subsequently expressed in the cardiac cell line H10 followed by RT‐PCR to assess splicing. We detected RT‐RNA fragments of 2 different sizes for both wildtype and c.689T>C. Sequencing of these 2 RT‐PCR products revealed that 1 included only the fetal exon 6a (190 bp), while the other included both the fetal as well as the adult exon 6 (exon 6a plus exon 6, 270 bp) (Figure 4A, lower panel). Compared with wildtype, c.689T>C samples displayed markedly greater levels of the RT‐PCR fragment containing both exons and lower levels of the RT‐PCR product containing only exon 6a, supporting a role for the c.689T>C mutation in promoting the inclusion of adult exon 6. This was confirmed by means of exon‐specific qPCRs, which demonstrated increased expression fractions of the adult exon in cells expressing the c.689T>C construct as compared with wildtype (Figure 4B). This supports the notion that the increased adult SCN5A isoform fractions that we observed in I230Thet and I230Thomo hiPSC‐CMs were related to effects of the c.689T>C mutation on splicing.
Figure 4.

Minigene assay demonstrating increased inclusion of the “adult” exon 6 in constructs carrying the c.689T>C mutation. A, The construct that was overexpressed in H10 cells to evaluate exon usage. The area in grey depicts the genomic fragment from the SCN5A gene that was cloned in the RHCglo vector. Real‐time polymerase chain reaction (PCR) on cDNA that was derived from the overexpressed samples using primers A and D at the depicted areas yielded 2 products (lower panel), which consisted of either inclusion of only exon 6a or inclusion of both exons 6a and 6. B, Expression fractions of exon 6 and exon 6a in samples overexpressed with wildtype (WT) and c.689T>C mutant (n=3–4, two independent experiments), as determined with exon‐specific quantitative PCRs using primer sets A–C for exon 6a and primer sets B–D for exon 6. The c.689T>C mutation significantly increases usage of exon 6 (*indicates P<0.05, t test).
Changes in I Na Properties Upon Extended Time in Culture
The adult isoform of the SCN5A‐encoded channel Nav1.5 exhibits different biophysical properties compared with the fetal isoform. In heterologous expression systems, a hyperpolarizing shift in V 1/2 of activation and faster rates of current inactivation are consistently found in channels translated from the adult SCN5A isoform compared with the fetal isoform, while some report a decreased current density and a faster recovery rate from inactivation as well.10, 31, 32 To evaluate whether these changes in I Na parameters occur in hiPSC‐CMs expressing increased fractions of adult SCN5A, we determined properties of I Na in both Ctrl1 and Ctrl2 hiPSC‐CMs at a “late” stage (66–69 days) and compared them with those measured in the same lines at an “early” stage (20–23 days). All parameters are summarized in Table 1 and Figures S2 and S3. A marked increase in I Na density was observed in both control lines upon extended time in culture (P<0.01), while voltage dependence of activation remained unchanged. In Ctrl2 hiPSC‐CMs, voltage dependence of inactivation displayed a positive shift of +3 mV upon extended time in culture, but remained unchanged in Ctrl1 hiPSC‐CMs. Also, the slow component of recovery from inactivation was faster in the late‐stage hiPSC‐CMs compared with the early‐stage hiPSC‐CMs in Ctrl1 (P=0.037), while in Ctrl2 the recovery from inactivation was similar at both stages. In both groups, the inactivation rate of I Na measured at −30 mV was increased in the late‐stage versus the early‐stage hiPSC‐CMs (P<0.001 in both groups).
Table 1.
Sodium Current Properties in “Early”‐ and “Late”‐Stage hiPSC‐CMs From the Control Cell Lines
| Ctrl1 | Ctrl2 | |||
|---|---|---|---|---|
| Early‐Stage | Late‐Stage | Early‐Stage | Late‐Stage | |
| Peak current density, median±IQR | −93±78 (n=28) | −207±275a (n=31) | −109±96 (n=23) | −184±164a (n=27) |
| Voltage dependence of activation | ||||
| k, mean±SEM | 7.5±0.1 (n=28) | 6.9±0.2 (n=31) | 6.9±0.2 (n=22) | 7.1±0.2 (n=27) |
| V 1/2, mean±SEM | −35.0±0.7 | −34.4±0.7 | −34.8±0.8 | −33.5±0.7 |
| Voltage dependence of inactivation | ||||
| k, mean±SEM | −6.9±0.2 (n=17) | −6.3±0.2 (n=14) | −6.9±0.2 (n=20) | −6.6±0.1 (n=23) |
| V 1/2, mean±SEM | −85.4±0.9 | −86.0±0.8 | −84.3±0.9 | −81.1±1.1b |
| Recovery from inactivation | ||||
| τfast, mean±SEM | 54.4±7.7 (n=7) | 40.0±10.9 (n=6) | 98.0±10.1 (n=13) | 83.2±8.6 (n=12) |
| τslow, mean±SEM | 408±19.6 | 297±37.1b | 837±122 | 773±49 |
| Time rate of inactivation | ||||
| τfast, median±IQR | 1.6±0.6 (n=28) | 1.1±0.4a (n=31) | 1.6±0.6 (n=23) | 1.4±0.6 (n=27) |
| τslow, median±IQR | 5.8±7.25 | 4.1±5.0a | 6.3±7.0 | 4.3±4.5a |
Data are presented as mean±SEM or median±interquartile range (IQR) as indicated. Ctrl1 indicates control 1; Ctrl2, control 2; k, slope factor; τfast, time constants of the fast component of recovery from inactivation or time rate of inactivation; τslow, time constants of the slow component of recovery from inactivation or time rate of inactivation; V 1/2, half‐maximum voltage of (in)activation.
P<0.05 Mann–Whitney U test compared with early‐stage human induced pluripotent stem cell–derived cardiomyocytes (hiPSC‐CMs).
P<0.05 Student t test compared with early‐stage hiPSC‐CMs.
Prolongation of the Time in Culture Unmasks the Phenotype of I230Thet and I230Thomo hiPSC‐CMs
Having found an increased fraction of adult SCN5A isoform expression in hiPSC‐CMs upon extended time in culture and considering the fact that the I230T mutation is located in the canonical exon 6, which is incorporated into the adult isoform, we expected a more pronounced electrophysiological phenotype in the mutant cell lines after culturing for a period of 66 days. Indeed, after prolonged culture, I Na density was markedly reduced by 85% in I230Thomo hiPSC‐CMs compared with Ctrl1 and Ctrl2 hiPSC‐CMs, which were cultured for a similar period of time (P<0.01), with I230Thet hiPSC‐CMs displaying an intermediate reduction (Figure 5A and 5B). Moreover, V 1/2 of activation was shifted in the positive direction by +10 to 11 mV in I230Thomo hiPSC‐CMs compared with Ctrl1 and Ctrl2 (P<0.05), while I230Thet hiPSC‐CMs exhibited a significant shift in V 1/2 of activation of +2.4 mV compared with Ctrl1 (P<0.05) (Figure 5C). Finally, voltage dependence of inactivation in I230Thomo hiPSC‐CMs was different as compared with I230Thet and Ctrl1 hiPSC‐CMs (P<0.05), while Ctrl2 hiPSC‐CMs demonstrated similar values as I230Thomo hiPSC‐CMs (P<0.05) (Figure 5D). The average I Na parameters of all lines at the 2 different stages are summarized in Table 2. AP measurements showed a significant decrease in maximal upstroke velocity in I230Thomo hiPSC‐CMs compared with Ctrl1, Ctrl2, and I230Thet hiPSC‐CMs, in line with the loss of function in I Na (P<0.05 I230Thomo versus all groups; Figure 5E and 5G). Again, I230Thet hiPSC‐CMs showed intermediate values (P<0.05; Figure 5G).
Figure 5.
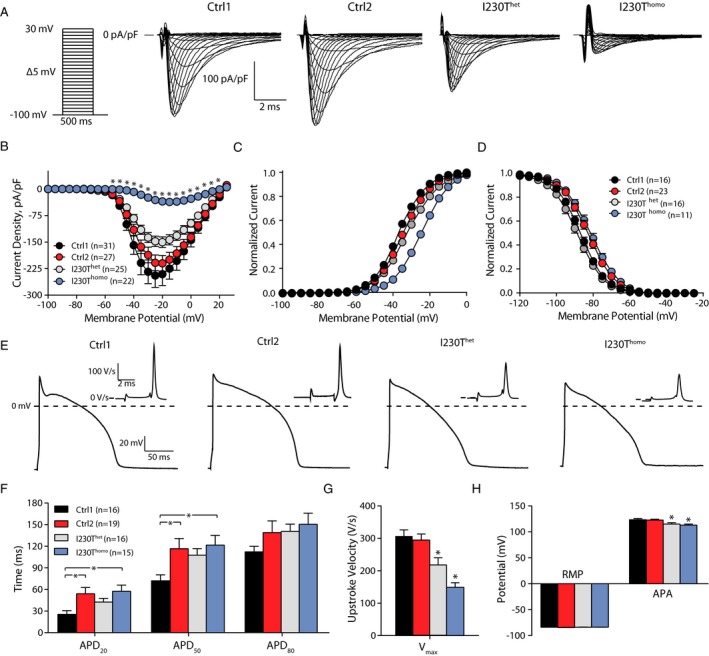
Extended time in culture unmasks the electrophysiological phenotype in heterozygous I230T (I230Thet) and homozygous I230T (I230Thomo) human induced pluripotent stem cell–derived cardiomyocytes (hiPSC‐CMs). A, Representative sodium current (IN a) traces in hiPSC‐CMs from control 1 (Ctrl1; n=31), control 2 (Ctrl2; n=28), I230Thet (n=26), and I230Thomo (n=22) groups. B, Average current‐voltage relations of IN a. *P<0.01 vs Ctrl1, Ctrl2, and I230Thet (Kruskal–Wallis test followed by Bonferroni corrected pairwise comparisons). C and D, Voltage dependence of activation and inactivation, respectively. E, Typical examples of action potentials (APs) measured at 1 Hz (Ctrl1, n=16; Ctrl2, n=19; I230Thet, n=13; I230Thomo, n=13). F through H, Average AP characteristics, including AP duration (F), maximal upstroke velocity (V max; G), resting membrane potential (RMP), and AP amplitude (APA) (H). In G * indicates P<0.05 vs. all other groups (ANOVA, posthoc Bonferroni test). In H * indicates P<0.05 vs Ctrl1 and Ctrl2 (ANOVA, posthoc Bonferroni test).
Table 2.
Sodium Current Parameters of All hiPSC Lines Measured at Day 22 to 25 (“Early” Stage) and at Day 66 to 69 (“Late” Stage)
| Early‐Stage hiPSC‐CMs | Late‐Stage hiPSC‐CMs | |||||||
|---|---|---|---|---|---|---|---|---|
| Ctrl1 | Ctrl2 | I230Thet | I230Thomo | Ctrl1 | Ctrl2 | I230Thet | I230Thomo | |
| Peak current density, median±IQR | −93±78 (n=28) | −109±96 (n=23) | −98±88 (n=31) | −65±35 (n=30) | −207±275 (n=31) | −184±164 (n=27) | −151±115 (n=25) | −33±1a (n=22) |
| Voltage dependence of activation | ||||||||
| k, mean±SEM | 7.5±0.1 (n=28) | 6.9±0.2 (n=23) | 7.6±0.2 (n=31) | 7.6±0.1 (n=30) | 6.9±0.2 (n=31) | 7.1±0.2 (n=27) | 7.7±0.2 (n=25) | 7.4±0.3 (n=22) |
| V 1/2, mean±SEM | −35.0±0.7 | −34.8±0.8 | −33.5±0.7 | −29.9±0.4b | −34.4±0.7 | −33.5±0.7 | −32.0±0.7c | −23.8±0.8b |
| Voltage dependence of inactivation | ||||||||
| k, mean±SEM | −6.9±0.2 (n=17) | −6.9±0.2 (n=20) | −7.3±0.2 (n=21) | −7.2±0.2 (n=15) | −6.3±0.2 (n=14) | −6.6±0.1 (n=23) | −6.5±0.2 (n=16) | −6.9±0.3 (n=11) |
| V 1/2, mean±SEM | −85.4±0.9 | −84.3±0.9 | −84.4±1.3 | −85.0±0.6 | −86.0±0.8 | −81.1±1.1d | −88.3±1.2 | −80.5±1.2d |
Data are presented as mean±SEM or median±interquartile range (IQR) as indicated. CM indicates cardiomyocytes; Ctrl, control 2; hiPSC, human induced pluripotent stem cell; V 1/2, half‐maximum voltage of (in)activation; k, slope factor.
P<0.05 compared with all other groups, Kruskal–Wallis test, followed by Bonferroni‐corrected pairwise comparisons.
P<0.05 compared with all other groups, 1‐way ANOVA, followed by post hoc Bonferroni tests.
P<0.05 compared with control 1 (Ctrl1).
P<0.05 compared with Ctrl1 and I230Thet.
Discussion
Immaturity of hiPSC‐CMs has been widely acknowledged as one of the main limitations of this model in the field of cardiac research. Different aspects of immaturity have been described, which include the electrophysiological, structural, and the contractile properties of hiPSC‐CMs.7 With respect to electrophysiology, lack of expression of the inward rectifier potassium current I K1 is considered an important drawback,33 but differences in other currents compared with adult CMs have also been described.33, 34 We highlight another aspect of electrophysiological immaturity in hiPSC‐CMs stemming from the expression of the fetal splice isoform of the main cardiac sodium channel gene SCN5A that contains the alternatively spliced exon 6a instead of the exon 6 contained in the adult isoform. Moreover, we show that extended culture of hiPSC‐CMs leads to a relative increase in the adult isoform over the fetal isoform. We illustrate the relevance of this phenomenon through electrophysiological studies of hiPSC‐CMs harboring the SCN5A mutation I230T in exon 6, where we observed mild biophysical defects after short‐term culture and uncovered the expected pronounced biophysical defects with extended culture.
The fetal isoform of SCN5A differs from the adult isoform in 7 amino acids within the S3 and S4 transmembrane segment of the first domain.10 Previous studies conducted in HEK cells or Xenopus oocytes expressing cDNA encoding either fetal or adult Nav1.5 have consistently reported a hyperpolarizing shift in voltage dependence of activation and a faster rate of inactivation for the adult isoform compared with the fetal isoform.10, 31, 32 In our study, the increased fraction of adult isoform in hiPSC‐CMs upon prolonged culture was paralleled by a faster rate of inactivation, consistent with these previous comparisons of the fetal and adult isoform. However, we did not observe a hyperpolarizing shift in voltage dependence of activation upon prolonged culture. Furthermore, we observed a marked increase in I Na density with prolonged culture, a feature that was observed for the adult versus the fetal isoform in one of the heterologous expression studies.32 Discrepancies between our observations and previous observations in heterologous systems could be related to fundamental differences between the studied cell types, ie, HEK cells or oocytes versus hiPSC‐CMs. The former cells lack the complete profile of Nav1.5‐interacting proteins, such as β subunits, which could result in different biophysical effects in hiPSC‐CMs compared with HEK cells. Moreover, in hiPSC‐CMs, a mix of the adult and fetal isoforms is still present upon prolonged culture, therefore the observed properties result from both isoforms, as opposed to heterologous cells, in which only fetal or adult Nav1.5 is expressed. Alternatively, in hiPSC‐CMs, expression of modifiers of Nav1.5 could change in parallel with the increased expression fraction of the adult SCN5A isoform during prolonged culture periods. Further studies are required to elucidate the cause of these discrepancies.
As the I230T mutation is located in exon 6, the implications of alternate exon 6/6a usage for disease modeling are intuitive. Because the expression fraction of adult SCN5A is low, the effects of the mutation are masked by the presence of fetal SCN5A in which the mutation is not present. However, for mutations located in other regions of the gene, the isoform usage can be of critical importance. For example, it was previously demonstrated that the L409P SCN5A mutation, located in exon 10, evoked different effects when present in the fetal SCN5A isoform compared with the adult isoform, explaining the severe phenotype that was found in utero in that particular patient.31 This underscores the fact that the consequence of isoform usage on mutation severity cannot be easily predicted, and should therefore always be taken into consideration in studies aimed to elucidate the phenotypic effects of mutations related to the cardiac sodium channel function. Apart from affecting the interpretation of the biophysical channel defect associated with a given mutation and its relation to the patient phenotype, high expression fractions of the fetal SCN5A isoform in hiPSC‐CMs could affect the channel sensitivity to Nav1.5‐blocking drugs. This has been demonstrated for SCN1A, which encodes a sodium channel that is mainly present in neuronal tissue. SCN1A is alternatively spliced similarly as SCN5A, ie, in a fetal and adult isoform that differ in the usage of a mutually exclusive spliced exon, and it was demonstrated that sensitivity to antiepileptic drugs depends on the isoform that is expressed.35
All hiPSC‐CM cell lines we studied showed a relative increase in usage of the adult isoform with prolonged culture, in line with the time‐dependent maturation of the cells. Nevertheless, the fraction of adult SCN5A that is present in adult CMs, in which expression of fetal SCN5A is negligible, was not reached in any of the analyzed lines. This observation highlights the fact that in hiPSC‐CMs, the maturation state that is reached after prolonged culture is still incomplete. Extending the culture time to even longer periods might further stimulate the expression of the adult SCN5A isoform. However, previous studies have demonstrated that the phenotype of hiPSC‐CMs was still relatively immature compared with adult CMs even after a culture period for up to 1 year.28 It remains to be determined whether other strategies that are aimed at improving the maturation state of hiPSC‐CMs (eg, electrical stimulation or mechanical stretch), perhaps even used in combination, may result in higher fractions of the adult SCN5A isoform.
At short‐term culture, the 2 hiPSC‐CMs lines harboring the I230T mutation (I230Thet and I230Thomo) contained a higher “starting” fraction of adult SCN5A isoform compared with the 2 control lines (Ctrl1 and Ctrl2), with the I230Thomo line having the highest fraction. Although these differences could relate to line‐to‐line variability, we postulated that since the mutation occurred within a splice enhancer motif, these differences may also, at least in part, be caused by the effect of the mutation on splicing efficiency of exon 6. This hypothesis is supported by the minigene assay we conducted, which clearly demonstrated that the nucleotide change associated with the mutation promoted the inclusion of adult exon 6. In the minigene assay, the usage of the adult exon did not occur at the expense of the fetal one, as opposed to the hiPSC‐CM system, in which the splicing of exon 6 and exon 6a is mutually exclusive. This likely indicates that the system used for the assay lacked certain splice factors that are required for splicing in a mutually exclusive manner, or that genomic information was missing from the minigene construct.
The present study was originally initiated to refine our understanding of the pathophysiological mechanism of a recessive form of SCN5A‐related conduction disorder by generating and analyzing hiPSC‐CMs from a heterozygous and homozygous I230T mutation carrier. Our electrophysiological data obtained in the late‐stage hiPSC‐CMs demonstrate loss of sodium channel function effects in line with the clinical presentation among carriers and suggests an intermediate loss of I Na in the heterozygous state compared with the homozygous state. The predicted severe loss of I Na in homozygous carriers is in line with the severe and early clinical phenotype in these patients. Yet, in spite of the predicted loss of sodium channel function, heterozygous patients did not experience arrhythmia and had normal ECG findings. This refractoriness suggests protective mechanisms such as conduction reserve. Indeed, other such cases in which even a predicted 50% reduction in I Na is tolerated (eg, the mutation W156X36) have been described. Conversely, the fact that mutations with effects on I Na of similar severity are found in heterozygous carriers who are symptomatic,37, 38 suggests that other factors, extrinsic from I Na, may also contribute to the disease.
In the human heart, the fetal splice isoform of SCN5A is predominantly expressed before birth and is gradually replaced by the adult isoform.31 As a result, mutations that are present in adult exon 6 may be tolerated up to the stage where the adult isoform predominates. This may explain why patients with the homozygous I230T mutation survive, whereas one would perhaps expect a highly severe, if not lethal, phenotype taking into account the degree of sodium channel loss of function that is predicted by our findings. In this respect, it is interesting to note that among the homozygous or compound heterozygous SCN5A mutations that have been published,36, 39, 40, 41, 42 there appears to be a preponderance of mutations (4 of 8) in exon 6 (R225W,36 T220I,41 A226V42 and the I230T mutation presented here), supporting the idea that mutations in this exon are better tolerated as compared with others in the homozygous or compound heterozygous state. As for the I230T mutation, it could be speculated that by virtue of its effects on adult exon 6 usage, along with its effects on sodium channel function, patients with this mutation may have symptoms at a younger age than patients with mutations in exon 6 that do not affect splicing. Considering the rarity of disease‐causing mutations in this exon and the fact that the disease phenotype could be affected by more than sodium channel function alone, these hypotheses are difficult to investigate.
Study Limitations
In our study, we derived cell lines from 4 individuals, each with a different genetic background. We therefore cannot exclude that differences we observed between the control and mutant lines may also arise from other genetic variation. Another limitation of our study is that we studied only 1 individual per genotype (ie, no biological replicates were studied for the homozygous and heterozygous states) and that only 2 control individuals were studied. Yet, a number of factors support the notion that the differences we observed in I Na and AP characteristics are largely the result of the mutation rather than genetic background differences. One of these is the fact that we studied 2 different control lines derived from unrelated individuals who had electrophysiological characteristics that were similarly different from the 2 mutant lines. Furthermore, the 2 mutant lines were derived from first‐degree relatives who shared 50% of their genome, thereby reducing genetic background effects. Finally, the intermediate effects that we observed in the heterozygous line compared with the homozygous line are concordant with the expected dosage effect of the mutation across the 2 lines.
Conclusions
Our study demonstrates that expression fractions of the adult and fetal isoforms of SCN5A in hiPSC‐CMs depend on the time in culture and affect the phenotypic assessment of mutations in these cells. This new aspect of electrophysiological immaturity should be taken into account in studies focusing on the effects of SCN5A mutations in hiPSC‐CMs.
Sources of Funding
This project was funded by a Rembrandt grant from the Academic Medical Center and the Leiden University Medical Center (to Wilde), the Dutch Heart Foundation (project PREDICT, CVON2012‐10 to Wilde and Bezzina), the IZKF Münster (to Schulze‐Bahr), and The Netherlands Organisation for Scientific Research (VICI project 016.150.610 to Bezzina).
Disclosures
None.
Supporting information
Table S1. List of the Applied Primers Used for PCR Per Gene
Table S2. Average Cell Capacitance and Series Resistance in All Experimental Groups. Values are Depicted as Mean±SEM
Figure S1. Scheme of experimental approach depicting the different time points during differentiation at which the different steps, ie, addition of lactate, enzymatic dissociation, collection of RNA, and electrophysiological measurements, were performed.
Figure S2. Comparison of sodium current (I Na) properties in control 1 (Ctrl1) human induced pluripotent stem cell–derived cardiomyocytes (hiPSC‐CMs) measured after a short and extended culture period (early‐ and late‐stage, respectively). Current–voltage relationships (A), voltage dependence of activation (B), voltage dependence of inactivation (C), recovery from inactivation (D), and time dependence of inactivation (E) are shown. Inset in (D) depicts the voltage clamp protocol to determine P2/P1 values. In (E), the left and right panels indicate time constants of the slow and fast components (τslow and τfast), respectively. Upon extended time in culture, I Na density, recovery rate, and inactivation rate increase. *P<0.05 (Mann–Whitney U test).
Figure S3. Comparison of sodium current (I Na) properties in control 2 (Ctrl2) human induced pluripotent stem cell–derived cardiomyocytes (hiPSC‐CMs) measured after a short and extended culture period (early‐ and late‐stage, respectively). Current‐voltage relationships (A), voltage dependence of activation (B), voltage dependence of inactivation (C), recovery from inactivation (D), and time dependence of inactivation (E) are shown. Inset in (D) depicts the voltage clamp protocol to determine P2/P1 values. In (E), the left and right panels indicate time constants of the slow and fast components (τslow and τfast), respectively. Upon extended time in culture, I Na density and the slow component of inactivation rate increase, while voltage dependence of inactivation displays a positive shift of 3 mV. *P<0.05 (Mann–Whitney U test).
Acknowledgments
We thank Jan Ruijter for his valuable insights and advice related to the qPCR experiments. We acknowledge Jolanda van der Velden and Cristobal Guillermo Dos Remedios from the Sydney Human Heart Tissue Bank for providing the human heart samples. The RHCglo vector was kindly provided by dr. T.A. Cooper, Baylor College of Medicine.
(J Am Heart Assoc. 2017;6:e005135 DOI: 10.1161/JAHA.116.005135.)28739862
Contributor Information
Connie R. Bezzina, Email: c.r.bezzina@amc.uva.nl.
Arie O. Verkerk, Email: a.o.verkerk@amc.nl.
References
- 1. Gellens ME, George AL Jr, Chen LQ, Chahine M, Horn R, Barchi RL, Kallen RG. Primary structure and functional expression of the human cardiac tetrodotoxin‐insensitive voltage‐dependent sodium channel. Proc Natl Acad Sci USA. 1992;89:554–558. [DOI] [PMC free article] [PubMed] [Google Scholar]
- 2. Veerman CC, Wilde AA, Lodder EM. The cardiac sodium channel gene SCN5A and its gene product Nav1.5: role in physiology and pathophysiology. Gene. 2015;573:177–187. [DOI] [PMC free article] [PubMed] [Google Scholar]
- 3. Itzhaki I, Maizels L, Huber I, Zwi‐Dantsis L, Caspi O, Winterstern A, Feldman O, Gepstein A, Arbel G, Hammerman H, Boulos M, Gepstein L. Modelling the long QT syndrome with induced pluripotent stem cells. Nature. 2011;471:225–229. [DOI] [PubMed] [Google Scholar]
- 4. Moretti A, Bellin M, Welling A, Jung CB, Lam JT, Bott‐Flügel L, Dorn T, Goedel A, Höhnke C, Hofmann F, Seyfarth M, Sinnecker D, Schömig A, Laugwitz KL. Patient‐specific induced pluripotent stem‐cell models for long QT syndrome. N Engl J Med. 2010;363:1397–1409. [DOI] [PubMed] [Google Scholar]
- 5. Davis RP, Casini S, van den Berg CW, Hoekstra M, Remme CA, Dambrot C, Salvatori D, Oostwaard DW, Wilde AA, Bezzina CR, Verkerk AO, Freund C, Mummery CL. Cardiomyocytes derived from pluripotent stem cells recapitulate electrophysiological characteristics of an overlap syndrome of cardiac sodium channel disease. Circulation. 2012;125:3079–3091. [DOI] [PubMed] [Google Scholar]
- 6. Malan D, Zhang M, Stallmeyer B, Muller J, Fleischmann BK, Schulze‐Bahr E, Sasse P, Greber B. Human iPS cell model of type 3 long QT syndrome recapitulates drug‐based phenotype correction. Basic Res Cardiol. 2016;111:14. [DOI] [PMC free article] [PubMed] [Google Scholar]
- 7. Veerman CC, Kosmidis G, Mummery CL, Casini S, Verkerk AO, Bellin M. Immaturity of human stem‐cell‐derived cardiomyocytes in culture: fatal flaw or soluble problem? Stem Cells Dev. 2015;24:1035–1052. [DOI] [PubMed] [Google Scholar]
- 8. Neu A, Eiselt M, Paul M, Sauter K, Stallmeyer B, Isbrandt D, Schulze‐Bahr E. A homozygous SCN5A mutation in a severe, recessive type of cardiac conduction disease. Hum Mutat. 2010;31:E1609–E1621. [DOI] [PubMed] [Google Scholar]
- 9. Ou SW, Kameyama A, Hao LY, Horiuchi M, Minobe E, Wang WY, Makita N, Kameyama M. Tetrodotoxin‐resistant Na+ channels in human neuroblastoma cells are encoded by new variants of Nav1.5/SCN5A . Eur J Neurosci. 2005;22:793–801. [DOI] [PubMed] [Google Scholar]
- 10. Onkal R, Mattis JH, Fraser SP, Diss JK, Shao D, Okuse K, Djamgoz MB. Alternative splicing of Nav1.5: an electrophysiological comparison of ‘neonatal’ and ‘adult’ isoforms and critical involvement of a lysine residue. J Cell Physiol. 2008;216:716–726. [DOI] [PubMed] [Google Scholar]
- 11. Huangfu D, Maehr R, Guo W, Eijkelenboom A, Snitow M, Chen AE, Melton DA. Induction of pluripotent stem cells by defined factors is greatly improved by small‐molecule compounds. Nat Biotechnol. 2008;26:795–797. [DOI] [PMC free article] [PubMed] [Google Scholar]
- 12. Takahashi K, Yamanaka S. Induction of pluripotent stem cells from mouse embryonic and adult fibroblast cultures by defined factors. Cell. 2006;126:663–676. [DOI] [PubMed] [Google Scholar]
- 13. Greber B, Coulon P, Zhang M, Moritz S, Frank S, Muller‐Molina AJ, Araúzo‐Bravo MJ, Han DW, Pape HC, Schöler HR. FGF signalling inhibits neural induction in human embryonic stem cells. EMBO J. 2011;30:4874–4884. [DOI] [PMC free article] [PubMed] [Google Scholar]
- 14. Zhang M, Schulte JS, Heinick A, Piccini I, Rao J, Quaranta R, Zeuschner D, Malan D, Kim KP, Ropke A, Sasse P, Araúzo‐Bravo M, Seebohm G, Schöler H, Fabritz L, Kirchhof P, Müller FU, Greber B. Universal cardiac induction of human pluripotent stem cells in two and three‐dimensional formats: implications for in vitro maturation. Stem Cells. 2015;33:1456–1469. [DOI] [PubMed] [Google Scholar]
- 15. Streckfuss‐Bömeke K, Wolf F, Azizian A, Stauske M, Tiburcy M, Wagner S, Hübscher D, Dressel R, Chen S, Jende J, Wulf G, Lorenz V, Schön MP, Maier LS, Zimmermann WH, Hasenfuss G, Guan K. Comparative study of human‐induced pluripotent stem cells derived from bone marrow cells, hair keratinocytes, and skin fibroblasts. Eur Heart J. 2013;34:2618–2629. [DOI] [PubMed] [Google Scholar]
- 16. Dudek J, Cheng IF, Balleininger M, Vaz FM, Streckfuss‐Bomeke K, Hubscher D, Vukotic M, Wanders RJ, Rehling P, Guan K. Cardiolipin deficiency affects respiratory chain function and organization in an induced pluripotent stem cell model of Barth syndrome. Stem Cell Res. 2013;11:806–819. [DOI] [PubMed] [Google Scholar]
- 17. Lian X, Zhang J, Azarin SM, Zhu K, Hazeltine LB, Bao X, Hsiao C, Kamp TJ, Palecek SP. Directed cardiomyocyte differentiation from human pluripotent stem cells by modulating Wnt/beta‐catenin signaling under fully defined conditions. Nat Protoc. 2013;8:162–175. [DOI] [PMC free article] [PubMed] [Google Scholar]
- 18. Tohyama S, Hattori F, Sano M, Hishiki T, Nagahata Y, Matsuura T, Hashimoto H, Suzuki T, Yamashita H, Satoh Y, Egashira T, Seki T, Muraoka N, Yamakawa H, Ohgino Y, Tanaka T, Yoichi M, Yuasa S, Murata M, Suematsu M, Fukuda K. Distinct metabolic flow enables large‐scale purification of mouse and human pluripotent stem cell‐derived cardiomyocytes. Cell Stem Cell. 2013;12:127–137. [DOI] [PubMed] [Google Scholar]
- 19. Meijer van Putten RM, Mengarelli I, Guan K, Zegers JG, van Ginneken AC, Verkerk AO, Wilders R. Ion channelopathies in human induced pluripotent stem cell derived cardiomyocytes: a dynamic clamp study with virtual IK1 . Front Physiol. 2015;6:7. [DOI] [PMC free article] [PubMed] [Google Scholar]
- 20. Koopmann TT, Adriaens ME, Moerland PD, Marsman RF, Westerveld ML, Lal S, Zhang T, Simmons CQ, Baczko I, dos Remedios C, Bishopric NH, Varro A, George AL Jr, Lodder EM, Bezzina CR. Genome‐wide identification of expression quantitative trait loci (eQTLs) in human heart. PLoS One. 2014;9:e97380. [DOI] [PMC free article] [PubMed] [Google Scholar]
- 21. Ramakers C, Ruijter JM, Deprez RH, Moorman AF. Assumption‐free analysis of quantitative real‐time polymerase chain reaction (PCR) data. Neurosci Lett. 2003;339:62–66. [DOI] [PubMed] [Google Scholar]
- 22. Singh G, Cooper TA. Minigene reporter for identification and analysis of cis elements and trans factors affecting pre‐mRNA splicing. Biotechniques. 2006;41:177–181. [DOI] [PubMed] [Google Scholar]
- 23. Jahn L, Sadoshima J, Greene A, Parker C, Morgan KG, Izumo S. Conditional differentiation of heart‐ and smooth muscle‐derived cells transformed by a temperature‐sensitive mutant of SV40 T antigen. J Cell Sci. 1996;109(pt 2):397–407. [DOI] [PubMed] [Google Scholar]
- 24. Hoekstra M, Mummery CL, Wilde AA, Bezzina CR, Verkerk AO. Induced pluripotent stem cell derived cardiomyocytes as models for cardiac arrhythmias. Front Physiol. 2012;3:346. [DOI] [PMC free article] [PubMed] [Google Scholar]
- 25. Giles WR, Noble D. Rigorous phenotyping of cardiac IPSc preparations requires knowledge of their resting potential(s). Biophys J. 2016;110:278–280. [DOI] [PMC free article] [PubMed] [Google Scholar]
- 26. Bett GC, Kaplan AD, Lis A, Cimato TR, Tzanakakis ES, Zhou Q, Morales MJ, Rasmusson RL. Electronic “expression” of the inward rectifier in cardiocytes derived from human‐induced pluripotent stem cells. Heart Rhythm. 2013;10:1903–1910. [DOI] [PMC free article] [PubMed] [Google Scholar]
- 27. Lundy SD, Zhu WZ, Regnier M, Laflamme MA. Structural and functional maturation of cardiomyocytes derived from human pluripotent stem cells. Stem Cells Dev. 2013;22:1991–2002. [DOI] [PMC free article] [PubMed] [Google Scholar]
- 28. Ivashchenko CY, Pipes GC, Lozinskaya IM, Lin Z, Xiaoping X, Needle S, Grygielko ET, Hu E, Toomey JR, Lepore JJ, Willette RN. Human‐induced pluripotent stem cell‐derived cardiomyocytes exhibit temporal changes in phenotype. Am J Physiol Heart Circ Physiol. 2013;305:H913–H922. [DOI] [PubMed] [Google Scholar]
- 29. Sartiani L, Bettiol E, Stillitano F, Mugelli A, Cerbai E, Jaconi ME. Developmental changes in cardiomyocytes differentiated from human embryonic stem cells: a molecular and electrophysiological approach. Stem Cells. 2007;25:1136–1144. [DOI] [PubMed] [Google Scholar]
- 30. Desmet FO, Hamroun D, Lalande M, Collod‐Béroud G, Claustres M, Béroud C. Human splicing finder: an online bioinformatics tool to predict splicing signals. Nucleic Acids Res. 2009;37:e67. [DOI] [PMC free article] [PubMed] [Google Scholar]
- 31. Murphy LL, Moon‐Grady AJ, Cuneo BF, Wakai RT, Yu S, Kunic JD, Benson DW, George AL Jr. Developmentally regulated SCN5A splice variant potentiates dysfunction of a novel mutation associated with severe fetal arrhythmia. Heart Rhythm. 2012;9:590–597. [DOI] [PMC free article] [PubMed] [Google Scholar]
- 32. Freyermuth F, Rau F, Kokunai Y, Linke T, Sellier C, Nakamori M, Kino Y, Arandel L, Jollet A, Thibault C, Philipps M, Vicaire S, Jost B, Udd B, Day JW, Duboc D, Wahbi K, Matsumura T, Fujimura H, Mochizuki H, Deryckere F, Kimura T, Nukina N, Ishiura S, Lacroix V, Campan‐Fournier A, Navratil V, Chautard E, Auboeuf D, Horie M, Imoto K, Lee KY, Swanson MS, Lopez de Munain A, Inada S, Itoh H, Nakazawa K, Ashihara T, Wang E, Zimmer T, Furling D, Takahashi MP, Charlet‐Berguerand N. Splicing misregulation of SCN5A contributes to cardiac‐conduction delay and heart arrhythmia in myotonic dystrophy. Nat Commun. 2016;7:11067. [DOI] [PMC free article] [PubMed] [Google Scholar]
- 33. Ma J, Guo L, Fiene SJ, Anson BD, Thomson JA, Kamp TJ, Kolaja KL, Swanson BJ, January CT. High purity human‐induced pluripotent stem cell‐derived cardiomyocytes: electrophysiological properties of action potentials and ionic currents. Am J Physiol Heart Circ Physiol. 2011;301:H2006–H2017. [DOI] [PMC free article] [PubMed] [Google Scholar]
- 34. Cordeiro JM, Nesterenko VV, Sicouri S, Goodrow RJ Jr, Treat JA, Desai M, Wu Y, Doss MX, Antzelevitch C, Di Diego JM. Identification and characterization of a transient outward K+ current in human induced pluripotent stem cell‐derived cardiomyocytes. J Mol Cell Cardiol. 2013;60:36–46. [DOI] [PMC free article] [PubMed] [Google Scholar]
- 35. Thompson CH, Kahlig KM, George AL Jr. SCN1A splice variants exhibit divergent sensitivity to commonly used antiepileptic drugs. Epilepsia. 2011;52:1000–1009. [DOI] [PMC free article] [PubMed] [Google Scholar]
- 36. Bezzina CR, Rook MB, Groenewegen WA, Herfst LJ, van der Wal AC, Lam J, Jongsma HJ, Wilde AA, Mannens MM. Compound heterozygosity for mutations (W156X and R225W) in SCN5A associated with severe cardiac conduction disturbances and degenerative changes in the conduction system. Circ Res. 2003;92:159–168. [DOI] [PubMed] [Google Scholar]
- 37. Potet F, Mabo P, Le Coq G, Probst V, Schott JJ, Airaud F, Guihard G, Daubert JC, Escande D, Le Marec H. Novel brugada SCN5A mutation leading to st segment elevation in the inferior or the right precordial leads. J Cardiovasc Electrophysiol. 2003;14:200–203. [DOI] [PubMed] [Google Scholar]
- 38. Smits JP, Koopmann TT, Wilders R, Veldkamp MW, Opthof T, Bhuiyan ZA, Mannens MM, Balser JR, Tan HL, Bezzina CR, Wilde AA. A mutation in the human cardiac sodium channel (E161K) contributes to sick sinus syndrome, conduction disease and Brugada syndrome in two families. J Mol Cell Cardiol. 2005;38:969–981. [DOI] [PubMed] [Google Scholar]
- 39. Lopez KN, Decker JA, Friedman RA, Kim JJ. Homozygous mutation in SCN5A associated with atrial quiescence, recalcitrant arrhythmias, and poor capture thresholds. Heart Rhythm. 2011;8:471–473. [DOI] [PubMed] [Google Scholar]
- 40. Frigo G, Rampazzo A, Bauce B, Pilichou K, Beffagna G, Danieli GA, Nava A, Martini B. Homozygous SCN5A mutation in Brugada syndrome with monomorphic ventricular tachycardia and structural heart abnormalities. Europace. 2007;9:391–397. [DOI] [PubMed] [Google Scholar]
- 41. Benson DW, Wang DW, Dyment M, Knilans TK, Fish FA, Strieper MJ, Rhodes TH, George AL Jr. Congenital sick sinus syndrome caused by recessive mutations in the cardiac sodium channel gene (SCN5A). J Clin Invest. 2003;112:1019–1028. [DOI] [PMC free article] [PubMed] [Google Scholar]
- 42. Tan BY, Yong RY, Barajas‐Martinez H, Dumaine R, Chew YX, Wasan PS, Ching CK, Ho KL, Gan LS, Morin N, Chong AP, Yap SH, Neo JL, Yap EP, Moochhala S, Chong DT, Chow W, Seow SC, Hu D, Uttamchandani M, Teo WS. A Brugada syndrome proband with compound heterozygote SCN5A mutations identified from a Chinese family in Singapore. Europace. 2016;18:897–904. [DOI] [PubMed] [Google Scholar]
Associated Data
This section collects any data citations, data availability statements, or supplementary materials included in this article.
Supplementary Materials
Table S1. List of the Applied Primers Used for PCR Per Gene
Table S2. Average Cell Capacitance and Series Resistance in All Experimental Groups. Values are Depicted as Mean±SEM
Figure S1. Scheme of experimental approach depicting the different time points during differentiation at which the different steps, ie, addition of lactate, enzymatic dissociation, collection of RNA, and electrophysiological measurements, were performed.
Figure S2. Comparison of sodium current (I Na) properties in control 1 (Ctrl1) human induced pluripotent stem cell–derived cardiomyocytes (hiPSC‐CMs) measured after a short and extended culture period (early‐ and late‐stage, respectively). Current–voltage relationships (A), voltage dependence of activation (B), voltage dependence of inactivation (C), recovery from inactivation (D), and time dependence of inactivation (E) are shown. Inset in (D) depicts the voltage clamp protocol to determine P2/P1 values. In (E), the left and right panels indicate time constants of the slow and fast components (τslow and τfast), respectively. Upon extended time in culture, I Na density, recovery rate, and inactivation rate increase. *P<0.05 (Mann–Whitney U test).
Figure S3. Comparison of sodium current (I Na) properties in control 2 (Ctrl2) human induced pluripotent stem cell–derived cardiomyocytes (hiPSC‐CMs) measured after a short and extended culture period (early‐ and late‐stage, respectively). Current‐voltage relationships (A), voltage dependence of activation (B), voltage dependence of inactivation (C), recovery from inactivation (D), and time dependence of inactivation (E) are shown. Inset in (D) depicts the voltage clamp protocol to determine P2/P1 values. In (E), the left and right panels indicate time constants of the slow and fast components (τslow and τfast), respectively. Upon extended time in culture, I Na density and the slow component of inactivation rate increase, while voltage dependence of inactivation displays a positive shift of 3 mV. *P<0.05 (Mann–Whitney U test).