

Abstract
Background
T cells are found in atherosclerotic plaques, with evidence supporting a potential role for CD8+ T cells in atherogenesis. Prior studies provide evidence of low‐density lipoprotein and apoB‐100 reactive T cells, yet specific epitopes relevant to the disease remain to be defined. The current study was undertaken to identify and characterize endogenous, antigen‐specific CD8+ T cells in atherosclerosis.
Methods and Results
A peptide fragment of apoB‐100 that tested positive for binding to the mouse MHC‐I allele H2Kb was used to generate a fluorescent‐labeled H2Kb pentamer and tested in apoE−/− mice. H2Kb pentamer(+)CD8+ T cells were higher in apoE−/− mice fed an atherogenic diet compared with those fed a normal chow. H2Kb pentamer (+)CD8+ T cells in atherogenic diet–fed mice had significantly increased effector memory phenotype with a shift in Vβ profile. H2Kb pentamer blocked lytic activity of CD8+ T cells from atherogenic diet–fed mice. Immunization of age‐matched apoE−/− mice with the apoB‐100 peptide altered the immune‐dominant epitope of CD8+ T cells and reduced atherosclerosis.
Conclusions
Our study provides evidence of a self‐reactive, antigen‐specific CD8+ T‐cell population in apoE−/− mice. Immune modulation using the peptide antigen reduced atherosclerosis in apoE−/− mice.
Keywords: apoB‐100, atherosclerosis, CD8+ T cells, immunology, lymphocyte, major histocompatibility complex‐I tetramer
Subject Categories: Atherosclerosis, Pathophysiology, Basic Science Research
Clinical Perspective
What Is New?
We provide evidence of CD8+ T‐cell subtypes in apoE−/− mice reactive to a peptide epitope derived from apoB‐100.
The apoB‐100‐specific CD8+ T‐cell response tracks atherosclerosis disease progression.
Immunization with the apoB‐100 peptide changed the immune‐dominant epitope response and reduced atherosclerosis.
What Are the Clinical Implications?
The study provides evidence of self‐reactive autoimmune CD8+ T‐cell response to apoB‐100 that is involved in atherosclerosis.
Modulation of autoimmune apoB‐100 CD8+ T‐cell response in atherosclerosis may be achievable by immunization with a vaccine.
Introduction
T cells are found in atherosclerotic plaques of both experimental animals and humans.1 Evidence suggests that different T‐cell types exist with varied functions.2, 3, 4, 5, 6, 7 In addition, there is evidence to support local antigen presentation and activation inside the plaque.1 Studies have shown the existence of clonality in the T‐cell receptor (TCR) repertoire of T cells derived from atherosclerotic plaques,8, 9 suggesting that at least some of these T cells are responding to specific antigenic epitopes.
Low‐density lipoprotein (LDL) remains the main source of atherosclerosis‐related antigens,4, 10, 11, 12 and various immune modulatory therapies using LDL or its major apolipoprotein apoB‐100 have been successful in modulating experimental atherosclerosis.4, 11, 12, 13, 14, 15 These studies used various immunization techniques with the intent of inducing CD4+ T‐cell responses and antibody production. Recent reports suggest that CD8+ T cells are also important modulators of atherosclerosis.2, 3, 4, 5, 6, 16, 17, 18, 19 We have reported that the athero‐protective immune response to an experimental apoB‐100 peptide vaccine in apoE−/− mice, called p210, is mediated by CD8+ T cells.4 The p210 peptide is 90% homologous to the corresponding mouse apoB‐100 peptide, suggesting that fragments of p210 may be self‐antigens in humans as well as in the mouse model. A report on human atherosclerotic plaque microparticles identified p210 among several peptide sequences that correspond to apoB‐100.20 This suggests that p210, or fragments thereof, may indeed be relevant self‐antigens in atherosclerosis. Given the role of CD8+ T cells in the protective effect of the p210 vaccine in experimental atherosclerosis,4 we continued our investigations focusing on the potential of p210 fragments to be presented as self‐antigens on major histocompatibility complex I (MHC‐I) and react with CD8+ T cells.
Using synthetic MHC‐I/p210 multimers, we investigated a p210 epitope‐specific CD8+ T‐cell population provoked by development of atherosclerosis in apoE−/− mice fed an atherogenic diet. Our results show the presence of a small population of CD8+ T cells in mice that are specific to a fragment of p210, suggesting the presence of spontaneously generated, antigen‐specific CD8+ T‐cell populations that are reactive to short peptide segments of apoB‐100. We also tested the effect of immunization with p210 on the antigen‐specific CD8+ T‐cell response. Immunization with p210 alters the antigen‐specific CD8+ T‐cell profile while reducing atherosclerosis.
Materials and Methods
Mice
Six‐week‐old male C57Bl6/J (WT) mice and age‐matched apoE−/− mice were purchased (Jackson Lab) and housed in a specific pathogen‐free facility until the age of 13 weeks when mice were euthanized. Freshly isolated spleens were used for splenocyte fluorescent staining. Additional male apoE−/− mice were purchased at 6 weeks of age and fed either normal chow or an atherogenic diet (TD88137; 21.2% fat; 0.2% cholesterol; Harlan Laboratories) starting at 7 weeks of age for 6, 12, or 15 weeks, and then euthanized. At euthanasia, freshly isolated spleens were used for splenocyte fluorescent staining. Serum was collected for cholesterol measurement using a commercially available kit. Aortas from the arch to the iliac branch were cleaned and processed for en face lipid staining with oil red‐o as previously described.4, 6 Atherosclerotic area was measured using computer‐assisted morphometry (ImagePro, Media Cybernetics).
Peptide Stimulation of Mouse T Cells
Splenocytes from male mice were cultured in 10% FCS/RPMI 1640 medium stimulated with 20 μg/mL of p210, a scrambled peptide, or equal volume of vehicle for 24 hours. CD8+ memory T‐cell profiling was performed on cultured splenocytes or bone marrow cells with or without peptide stimulation using CD44 (clone IM7), CD62L (clone MEL‐14; both from eBioscience), and CD8b antibodies. For intracellular cytokine staining, cells were cultured in Cellular Technology Limited (CTL) Test Medium and stimulated with p210, scrambled peptide, or vehicle for 48 hours. Cells were collected and subjected to fluorescent surface staining with monoclonal anti‐CD4 (clone GK1.5) and anti‐CD8b (clone H35‐17.2) antibodies (eBioscience) followed by fixation and permeabilization for fluorescent intracellular staining. Cells were then stained with monoclonal anti‐interferon‐γ (clone XMG1.2) and anti‐interleukin‐10 (IL‐10) (clone JES5‐16E3) antibodies (eBioscience) and data were acquired using a BD Fortessa flow cytometric apparatus.
CD8+ T‐Cell Degranulation
Splenocytes and bone marrow cells collected from male apoE−/− mice were cultured as described above. Fluorescent‐conjugated antibody to granular membrane protein CD107a (Biolegend) was added to the cell culture before stimulation with peptide. The cultures were then incubated for 1 hour at 37°C in 5% CO2, followed by incubation with transport inhibitor Monensin (eBioscience) for 4 hours. The cells were then harvested, washed with PBS, and stained as described above for flow cytometry.
MHC‐I Binding Prediction and Pentamer Generation
Potential binding of the p210 peptide to mouse H2Kb and H2Db was assessed using the Immune Epitope Data Base (IEDB) prediction site. Mouse H2Kb pentamers were synthesized on the ProVE platform (ProImmune) following REVEAL binding assays (ProImmune) of 8‐mer serial fragments of p210 to H2Kb.
Pentamer Staining
Pentamer staining was performed on 2×10⁶ red blood cell–lysed mouse splenocytes using a 2‐layer approach. Biotinylated pentamers were added to the cells and incubated for 10 minutes in 25°C. A control mouse H2Kb SIINFEKL pentamer (ProImmune) was used as staining control. Cells were washed twice and stained with CD8a (clone KT15) and CD19 (clone 6D5) antibodies, and a secondary fluorescent reagent (Fluorotag; ProImmune) for pentamer staining for 20 minutes in 4°C. After washing twice, cells were suspended in fluorescence‐activated cell sorter buffer (1% bovine serum albumin/1xPBS/0.1% sodium azide) and fixed with 4% paraformaldehyde for a final concentration of 1%. Cells were then analyzed using a BD Fortessa apparatus. Specific pentamer staining was based on control pentamers as reference. Antibody staining was verified using isotype controls. Characterization of the staining strategy in the lymphocyte‐gated CD8+CD19(−) T cells of apoE−/− splenocytes was performed using LIVE/DEAD Fixable Aqua Dead Cell Stain (ThermoFisher), CD49b (NK cell; clone DX5; eBioscience), CD3e (clone145‐2C11; BD Bioscience), and CD11c (clone N418; eBioscience). Exclusion of cell doublets in pilot experiments yielded identical results.
TCR Vβ Screening
TCR Vβ screening was performed using a commercially available panel of antibodies (Mouse Vβ TCR Screening Panel; BD Bioscience). Spleen cells were pooled from 5 mice per group at 13 weeks of age. For Vβ screening of pentamer‐gated cells, pentamer staining was performed first as described above. Vβ antibodies were then added during CD8 and CD19 staining of the cells, washed, and processed as described above.
Memory T‐Cell Profile
CD8+ memory T‐cell profiling was performed on freshly isolated spleen cells using CD44, CD62L, and CD8 antibodies using the pentamer staining techniques described above. CD44 and CD62L antibodies were added during CD8 and CD19 staining of the cells, washed, and processed as described.
In Vitro Cytolytic Assay
Thioglycollate‐elicited peritoneal macrophage from male apoE−/− mice were harvested and seeded onto 96‐well plates overnight in 10% FBS‐RPMI medium with 10 μg/mL oxLDL as target cells. After 18 hours, medium was replaced with 5% FBS‐RPMI for cytotoxic assay. Spleens from experimental groups were collected at 13 weeks of age and CD8+ T cells were negatively isolated (Dynabeads Untouched Mouse CD8+ T cell kit; Invitrogen) as effector cells. Effector and target cells were then cocultured in 5% FBS‐RPMI at an effector‐to‐target ratio of 3:1 for 4 hours and culture medium was collected for CytoTox 96 Cytotoxicity Assay (Promega) with the appropriate controls as recommended by the manufacturer. For pentamer blocking,21 aliquots of CD8+ T cells were incubated with pentamers as detailed in the pentamer staining procedure but without anti‐CD8 antibody. CD8+T cells were then washed and cocultured with target cells also at a 3:1 ratio and the assay was performed as above. For immunization studies, apoE−/− bone marrow derived dendritic cells (DCs) were used as target cells, as we previously reported.4
Pentamer(+) CD8+ T Cells in Aortic Plaques
A subgroup of male mice continued being fed an atherogenic diet for a total of 22 weeks until euthanasia at 29 weeks of age. Aortas from 4 apoE−/− mice fed an atherogenic diet for 22 weeks were microdissected from surrounding tissue and enzymatically digested (0.25 mg/mL collagenase, 0.125 mg/mL elastase, 60 U/mL hyaluronidase [Sigma] in RPMI 1640 medium at 37°C for 35 minutes). Collected cells were then passed through a cell strainer, stained for nonviable cell exclusion and with Pentamer 2, CD3, CD8, and CD19 antibodies as detailed in the pentamer staining procedure above.
Peptide Immunization Studies
Male apoE−/− mice fed normal chow were subcutaneously immunized with p210/cBSA/Alum in the dorsal area at 7 weeks of age, followed by a booster at 10 and 12 weeks of age.4, 22 Each injection contained 100 μg of p210 peptide conjugated to the carrier cBSA (cationized BSA) according to the manufacturer's protocol (ThermoFisher Scientific) and with Alum (containing 1.38 mg aluminum per administration, ThermoFisher Scientific) as adjuvant. Mice receiving an equivalent dose of cBSA/alum or PBS served as control groups. C57Bl6 mice expressing GFP on the FoxP3 promoter (a kind gift from Dr Talal Chatila) were crossed with apoE−/− mice. Compound homozygous transgenic mice were subjected to immunization as described above.
For immune characterization and functional studies, mice were euthanized at 13 weeks of age after the second booster injection. Spleens were collected and the splenocytes were subjected to pentamer staining as described above. For pentamer‐positive cell sorting, splenocytes from 5 immunized mice were pooled, subjected to CD8+ T‐cell negative isolation (Dynabeads Untouched Mouse CD8+ T cell kit, Invitrogen), stained with pentamer, and sorted. Sorted cell aliquots were then used for either cytolytic assay or cell expansion. Cytolytic assays were performed as described above using apoE−/− bone marrow–derived DCs as target cells.4 Cell expansion was performed by culturing sorted cells in RPMI 1640 medium supplemented with 10% FBS, 0.6 μg/mL IL‐2, and CD3/CD28 antibody beads (Invitrogen). Fresh medium was added every 2 days. After 7 days in culture, expanded cells were split 1:2 in 10% FBS medium with 0.5 μg/mL IL‐2, and CD3/CD28 antibody beads (Invitrogen). Subsequent addition of fresh medium every 2 days contained 0.02 μg/mL IL‐2 for cell maintenance for 14 days. Cells were then harvested, exposed to a magnetic apparatus (Invitrogen) to remove the CD3/CD28 antibody beads, counted, and used as effector cells for cytolytic assays described above.
To study the effect of immunization on atherosclerosis, mice were fed an atherogenic diet starting at 13 weeks of age after the second booster injection and euthanized at 25 weeks of age.4 Collected aortas were processed for en face oil red‐o staining of atherosclerotic plaques and the plaque area was measured4, 6 as described above.
Statistics
All data are reported as mean±SD. Data were analyzed using 2‐tailed t test unless indicated otherwise. Correlations were analyzed using the Pearson correlation coefficients test. A P<0.05 was considered significant.
Ethics Statement
Mice were housed in a specific pathogen‐free facility at a 12‐hour day/night cycle and had unlimited access to food and water. The Cedars‐Sinai Institutional Animal Care and Use Committee approved the experimental protocols (IACUC# 004399, 004697, and 005536).
Results
Atherogenic Diet Generates CD8+ Effector Memory T Cells and Increases CD8+ T‐Cell Cytolytic Activity in apoE−/− Mice
We first tested the effect of feeding an atherogenic diet on global CD8+ T‐cell phenotype and function. ApoE−/− mice were fed either normal chow or an atherogenic diet for 6 weeks starting at 7 weeks of age and the spleens were collected at euthanasia. Gating strategy for flow cytometry analysis is shown in Figure 1. There was no difference in total CD8+ T cells between mice fed normal chow and those fed an atherogenic diet (11.2±1.0% versus 10.1±0.6%, respectively; N=5 each). CD44(+)CD62L(−) Effector Memory (EM) CD8+ T cells were significantly increased in the spleens of atherogenic diet–fed mice compared with normal chow–fed mice (6.3±1.9% versus 3.0±0.8%, respectively; P<0.01; N=5 each; Figure 2A). There was a modest but significant reduction in CD44(+)CD62L(+) Central Memory (CM) CD8+ cells in atherogenic diet–fed mice compared with normal chow–fed mice (9.0±0.9% versus 11.1±1.6%, respectively; P<0.05; Figure 2B) and no significant difference in CD44(−)CD62L(+) naïve CD8+ T cells (75.5±1.5% versus 77.3±2.8%, respectively). Serum cholesterol levels were significantly higher in the atherogenic diet–fed mice compared with normal chow–fed mice (1544±195 mg/dL versus 490±107 mg/dL, respectively; P<0.0001), with a significant positive correlation between serum cholesterol levels and CD44(+)CD62L(−) EM CD8+ T cells (R 2=0.662, P=0.004; Figure 2C). However, feeding with an atherogenic diet did not elicit changes in the TCR Vβ profile of total CD8+ T cells when compared with feeding with normal chow (Figure 2D).
Figure 1.
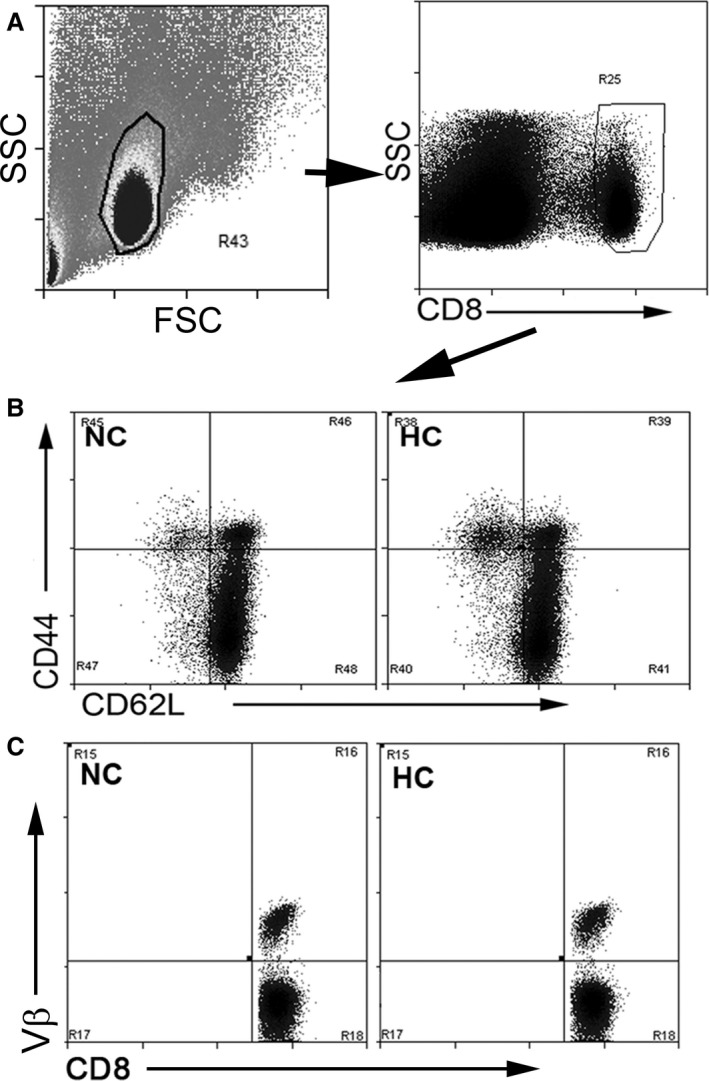
Gating strategy for CD8+ T cells in apoE−/− mice fed normal chow or an atherogenic diet. Splenocytes from mice fed normal chow (NC) or atherogenic diet (HC) were size gated on lymphocytes and then on CD8 (A). Gated cells were then plotted on CD62L/CD44 (B) for memory cell profile or CD8/Vβ (C) to assess Vβ repertoire. Nonviable cells comprised <0.05% of freshly isolated, stained splenocytes. FSC indicates Forward Scatter; SSC, Side Scatter.
Figure 2.
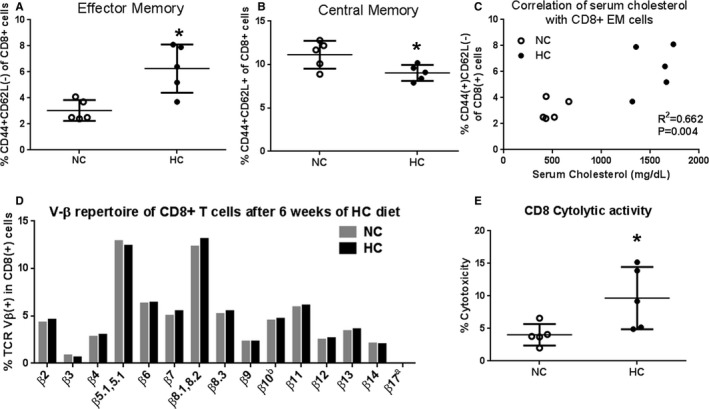
Atherogenic diet–induced generation of effector memory CD8+ T cells and increased cytolytic activity. A, CD8+ effector memory T cells and (B) central memory CD8+ T cells of freshly isolated splenocytes from apoE−/− mice fed normal chow (NC) or an atherogenic diet (HC) for 6 weeks. *P<0.05, N=5 each. Gating strategy is shown in Figure 1. C, CD8+ effector memory T‐cell correlation with serum cholesterol (R 2=0.662; P=0.004). D, Bar graph of Vβ repertoire after 6 weeks of atherogenic diet compared with NC–fed mice. Spleens from 5 mice per group were pooled to obtain a sufficient number of cells for all Vβ types. Gating strategy and representative scatterplot for Vβ staining analysis of splenocytes are shown in Figure 1C. E, Cytolytic activity of CD8+ T cells from apoE−/− mice fed NC or an HC for 6 weeks. *P<0.01; N=5 each.
To determine whether the diet‐induced phenotypic change in CD8+ T cells was associated with functional changes, cytotoxic activity was assessed. Using oxLDL‐stimulated peritoneal macrophage as target cells, there was significantly more cytotoxic activity by CD8+ T cells from apoE−/− mice fed an atherogenic diet for 6 weeks compared with mice fed normal chow (10.0±4.4% versus 3.4±2.2%, respectively; P<0.05; Figure 2E). Thus, our results indicated that feeding apoE−/− mice an atherogenic diet results in phenotypic change of CD8+ T cells with increased cytolytic function.
CD8+ T Cells Respond to p210 Stimulation
The p210 peptide fragment of apoB‐100 is a potential self‐antigen, and vaccination with this peptide antigen reduced atherosclerosis in apoE−/− mice.4 We therefore tested whether apoE−/− mice have an existing pool of CD8+ T cells responsive to p210 as a potential source of endogenous antigens. Splenocytes were cultured for 24 hours with or without p210 peptide stimulation at a dose of 20 μg/mL. There was a trend for increased CD8+ EM T cells after 24‐hour p210 stimulation but no difference in the CD8+ CM T cells in normal chow–fed mice (Figure 3A and 3B). CD8+ EM T cells were significantly increased and CD8+ CM T cells were significantly reduced after 24‐hour p210 stimulation in mice fed an atherogenic diet (Figure 3C and 3D). CD8+ EM T‐cell degranulation, assessed by CD107a staining as a function of cytolytic activity,23 was significantly increased by 5‐hour p210 stimulation (Figure 3E). CD8+ T cells in the bone marrow have a high percentage of memory cells,24 suggesting that it may be a potential source of p210 reactive cells. We confirmed that bone marrow cells from atherogenic diet–fed mice had a high percentage of CD8+ EM T cells, but did not increase after p210 stimulation (Figure 3F) and did not have increased degranulation (Figure 3G).
Figure 3.
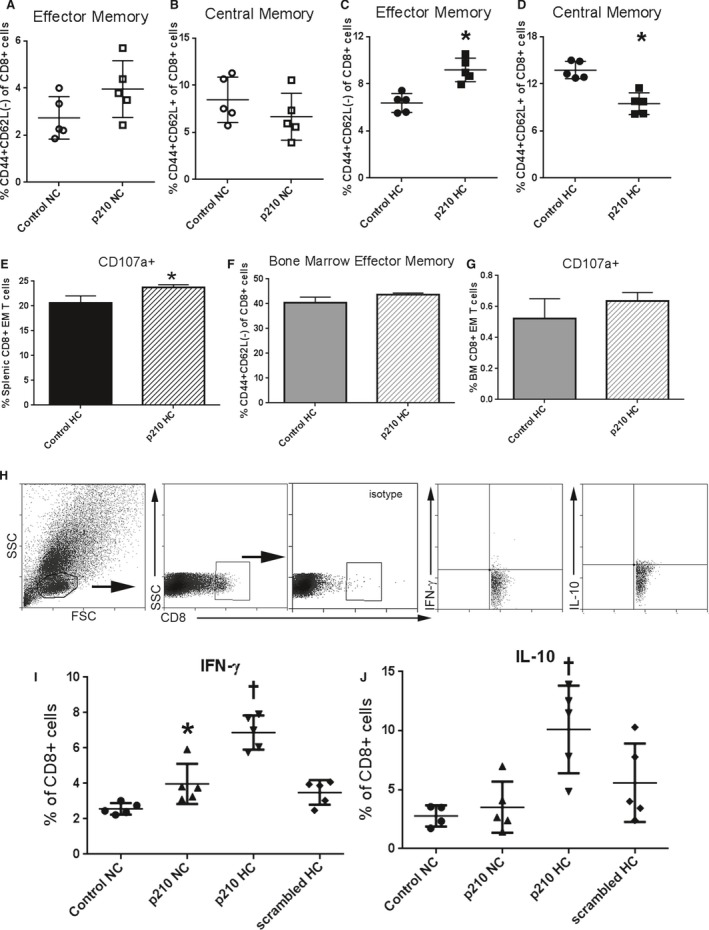
CD8+ T‐cell response to stimulation with p210 peptide. Splenocytes from apoE−/− mice fed normal chow (NC) or atherogenic diet (HC) for 12 weeks were stimulated for 24 hours and then stained for memory cell profile. A and B, CD8+ effector memory and central memory in splenocytes from NC mice. C and D, CD8+ effector memory and central memory in splenocytes from HC mice. N=5 each; P<0.05. E, CD107a staining, a marker of CD8+ T‐cell degranulation as a function of cytolytic activity, was significantly increased after 5‐hour p210 stimulation in splenic CD8+ effector memory T cells (N=4 each, P<0.05). F, Bone marrow cells had more effector memory cells as a percentage of total CD8+ T cells as compared with splenocytes (C) but did not change after 24‐hour p210 stimulation (N=3 each; P=NS, Mann–Whitney test). CD107a+ staining was also unchanged after 5‐hour p210 stimulation in bone marrow (BM) CD8+ effector memory T cells (G; N=3 each; P=NS, Mann–Whitney test). Intracellular cytokine staining in splenocytes of apoE−/− mice fed NC or HC for 6 weeks (H through J). Splenocytes were stimulated with p210 peptide, scrambled peptide, or vehicle as control for 48 hours, with Brefeldin‐A treatment for the last 4 hours before collection and staining. Cells were size‐gated for lymphocytes and then for CD8 with isotype staining as reference. Representative scatterplots of cells stained for IFN‐γ and IL‐10 (H). CD8+IFN‐γ (I) and CD8+IL‐10+ (J) cells in splenocytes of mice fed NC or HC. N=5 each; *P<0.05 vs Control NC; † P<0.05 vs all groups, ANOVA. FSC indicates Forward Scatter; IFN‐γ, interferon‐γ; IL‐10, interleukin‐10; NS, not significant; SSC, Side Scatter.
Gating strategy for intracellular cytokine staining is shown in Figure 3H. Stimulation with p210 for 48 hours significantly increased CD8+interferon‐γ+ T cells in mice fed normal chow (Figure 3I). The interferon‐γ response provoked by p210 peptide was significantly augmented in mice fed an atherogenic diet. Stimulation of splenocytes from mice fed normal chow with p210 peptide had no effect on CD8+IL‐10+ T cells (Figure 3J). In mice fed an atherogenic diet, CD8+IL‐10+ T cells were significantly increased after p210 stimulation. The scrambled peptide had no effect, indicating p210 specificity. The results provide evidence that p210 is an endogenous antigen source that induced CD8+ T‐cell recall responses, augmented in atherogenic diet–fed mice.
Generation of Mouse p210 Pentamer
Given the observed changes in CD8+ T cells after atherogenic diet feeding and responses to p210 stimulation, we pursued studies to investigate the existence of p210‐specific CD8+ T cells. Initial assessment of the potential binding to the mouse H‐2Db and H2‐Kb, which are the MHC‐I alleles in the C57Bl/6 mouse, showed modest predicted binding scores using the IEDB prediction method (Table 1). The MHC‐I binding predictions were made using the IEDB analysis resource Consensus tool,25 which combines predictions from ANN aka NetMHC (3.4),26, 27 SMM,28 and Comblib.29 Peptide length was based on optimal binding on H2Db (nanomers) or H2Kb (octamers).30 We therefore contracted ProImmune to assess binding of the p210 peptide to the mouse H‐2Db and H2‐Kb. ProImmune's REVEAL screening for peptide binding indicated no potential binding for H‐2Db. However, 13 potential 8‐mer serial peptide sequences from p210 were identified that bound H2‐Kb (Figure 4A). Of those, only 10 were successfully synthesized as pentamers (Pents) using the ProVE platform (Table 2), the first of which was Pent 2 (so named according to the peptide number of the original p210 peptide sequence that corresponds to starting position of the epitope).
Table 1.
Epitope Binding Prediction for p210 Peptide (p210 Sequence: KTTKQSFDLSVKAQYKKNKH)
| Allele | # | Start | End | Length | Peptide | Method Used | Percentile_Rank |
|---|---|---|---|---|---|---|---|
| H‐2‐Kb | 1 | 2 | 9 | 8 | TTKQSFDL | Consensus (ann/smm) | 14.0 |
| H‐2‐Kb | 1 | 5 | 12 | 8 | QSFDLSVK | Consensus (ann/smm) | 19.5 |
| H‐2‐Kb | 1 | 11 | 18 | 8 | VKAQYKKN | Consensus (ann/smm) | 28.0 |
| H‐2‐Kb | 1 | 9 | 16 | 8 | LSVKAQYK | Consensus (ann/smm) | 32.0 |
| H‐2‐Db | 1 | 5 | 13 | 9 | QSFDLSVKA | Consensus (ann/smm/comblib_sidney2008) | 33 |
| H‐2‐Kb | 1 | 3 | 10 | 8 | TKQSFDLS | Consensus (ann/smm) | 38.0 |
| H‐2‐Db | 1 | 2 | 10 | 9 | TTKQSFDLS | Consensus (ann/smm/comblib_sidney 2008) | 38 |
| H‐2‐Db | 1 | 9 | 17 | 9 | LSVKAQYKK | Consensus (ann/smm/comblib_sidney2008) | 38 |
| H‐2‐Db | 1 | 1 | 9 | 9 | KTTKQSFDL | Consensus (ann/smm/comblib_sidney2008) | 39 |
| H‐2‐Kb | 1 | 6 | 13 | 8 | SFDLSVKA | Consensus (ann/smm) | 39.5 |
| H‐2‐Db | 1 | 4 | 12 | 9 | KQSFDLSVK | Consensus (ann/smm/comblib_sidney2008) | 43 |
| H‐2‐Db | 1 | 3 | 11 | 9 | TKQSFDLSV | Consensus (ann/smm/comblib_sidney2008) | 45 |
| H‐2‐Kb | 1 | 4 | 11 | 8 | KQSFDLSV | Consensus (ann/smm) | 47.5 |
| H‐2‐Kb | 1 | 1 | 8 | 8 | KTTKQSFD | Consensus (ann/smm) | 51.0 |
| H‐2‐Kb | 1 | 10 | 17 | 8 | SVKAQYKK | Consensus (ann/smm) | 52.0 |
| H‐2‐Kb | 1 | 7 | 14 | 8 | FDLSVKAQ | Consensus (ann/smm) | 58.5 |
| H‐2‐Db | 1 | 7 | 15 | 9 | FDLSVKAQY | Consensus (ann/smm/comblib_sidney2008) | 59 |
| H‐2‐Kb | 1 | 13 | 20 | 8 | AQYKKNKH | Consensus (ann/smm) | 60.0 |
| H‐2‐Db | 1 | 12 | 20 | 9 | KAQYKKNKH | Consensus (ann/smm/comblib_sidney2008) | 63 |
| H‐2‐Db | 1 | 8 | 16 | 9 | DLSVKAQYK | Consensus (ann/smm/comblib_sidney2008) | 67 |
| H‐2‐Kb | 1 | 12 | 19 | 8 | KAQYKKNK | Consensus (ann/smm) | 67.5 |
| H‐2‐Db | 1 | 6 | 14 | 9 | SFDLSVKAQ | Consensus (ann/smm/comblib_sidney2008) | 71 |
| H‐2‐Db | 1 | 10 | 18 | 9 | SVKAQYKKN | Consensus (ann/smm/comblib_sidney2008) | 91 |
| H‐2‐Kb | 1 | 8 | 15 | 8 | DLSVKAQY | Consensus (ann/smm) | 94.5 |
| H‐2‐Db | 1 | 11 | 19 | 9 | VKAQYKKNK | Consensus (ann/smm/comblib_sidney2008) | 98 |
Figure 4.
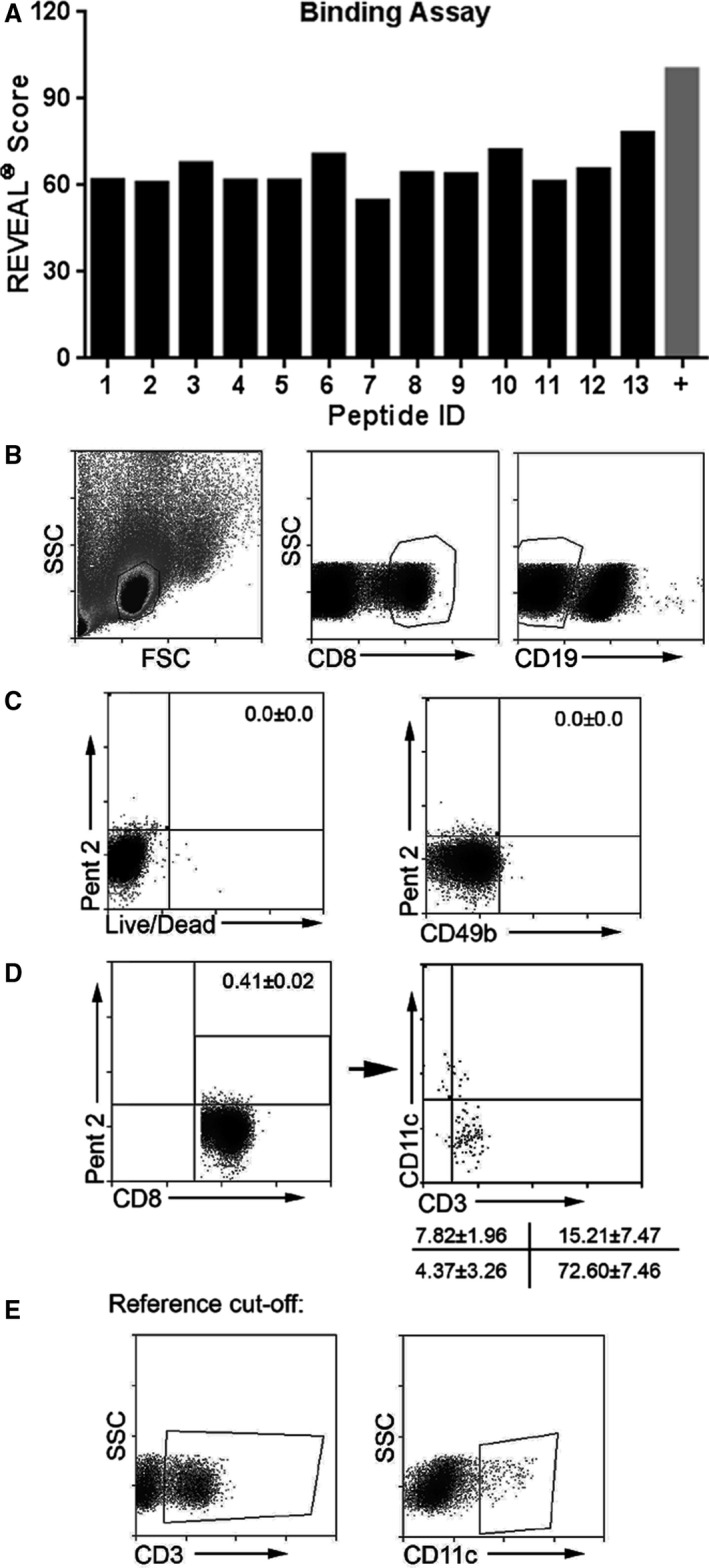
Screening of p210 peptide fragments for binding on mouse H2Kb. A, REVEAL binding assays identified 13 possible 8‐mer sequences for H2Kb binding and 10 were synthesized successfully as pentamers in the ProVE platform, the first of which was Pent 2 (see Table 2). B through E, Optimization and characterization of pentamer staining and gating strategy were performed using freshly isolated splenocytes from apoE−/− mice with cell viability staining and antibodies to CD3e, CD8, CD11c, CD19, CD49b, and Pent 2; representative of 3. B, Splenocytes were size‐gated and selected for the CD8+CD19(−) gate. C, Cells gated from (B) were plotted on live/dead cell vs Pent 2 stain quadrant analysis (left) or CD49b (NK cells) vs Pent 2 stain quadrant analysis. Numbers in the top right quadrants are percentage of cells double positive for the indicated stains. D, Pent 2(+)CD8+ T cells as plotted (left) after CD8+CD19(−) gating scheme shown in (B). Box indicates double positive cells with corresponding percentage. These cells were then plotted on CD3e vs CD11c for further characterization (right). Numbers at lower right are percentages of the respective cell subgroups corresponding to the plot quadrants. E, CD3e (left) and CD11c (right) positive cells on the SSC plot used as reference for the quadrant analysis in (D). FSC indicates Forward Scatter; SSC, Side Scatter.
Table 2.
H2Kb Pentamer Synthesis With Respective Peptide Fragment and Designation
| Peptide I.D. | Peptide Sequence | Pentamer I.D. |
|---|---|---|
| 1 | KTTKQSFD | Failed in synthesis |
| 2 | TTKQSFDL | 2 |
| 3 | TKQSFDLS | 3 |
| 4 | KQSFDLSV | Failed in synthesis |
| 5 | QSFDLSVK | 5 |
| 6 | SFDLSVKA | 6 |
| 7 | FDLSVKAQ | 7 |
| 8 | DLSVKAQY | Failed in synthesis |
| 9 | LSVKAQYK | 9 |
| 10 | SVKAQYKK | 10 |
| 11 | VKAQYKKN | 11 |
| 12 | KAQYKKNK | 12 |
| 13 | AQYKKNKH | 13 |
All binding assays and pentamer synthesis shown are with H2Kb. H2Db failed in binding assays. No H2Db pentamers were generated.
Immune‐Dominant p210 Epitopes in apoE−/− Mice
To determine the immune‐dominant p210 epitopes in atherosclerotic apoE−/− mice, spleen cells from 5 mice were pooled, and staining with the 10 synthesized pentamers was compared with spleen cells from a C57Bl6/J WT mouse. Optimization and characterization of the pentamer staining and gating strategy was first performed using Pent 2. The lymphocyte‐gated CD8+CD19(−) T cells of apoE−/− splenocytes (Figure 4B) showed no dead cell or CD49b (NK cell) staining of Pent 2(+) cells (Figure 4C). The same staining strategy also showed that ≈90% of Pent 2 (+) cells in CD8+CD19(−) gated cells were CD3e+, and 15% of Pent 2 (+) cells in CD8+CD19(−) gate double‐stained for CD3e and CD11c (Figure 4D and 4E). All 10 pentamers were then used to screen p210‐pentamer(+)CD8+ T cells from spleens of 13‐week‐old apoE−/− mice compared with WT mice. The screening identified 3 pentamers that showed more than 2‐fold higher staining of splenic CD8+ T cells from apoE−/− mice, namely, Pent 2, Pent 6, and Pent 7 (Figure 5A). Pent 2 was ranked with the highest prediction score in the IEDB report (Table 1) and thus was chosen as prototype to confirm pentamer reactivity in individual mice. Gating strategy for Pent 2(+) cells is shown in Figure 5B. There was significantly more Pent 2(+)CD8+ T cells in 13‐week‐old apoE−/− mice compared with age‐matched WT mice (0.50±0.14% versus 0.25±0.06%, respectively; P<0.05; Figure 5C). The results confirmed that Pent 2 was a valid candidate to perform further immunologic testing for antigen‐specific CD8+ T cells in atherosclerosis‐prone apoE−/− mice.
Figure 5.
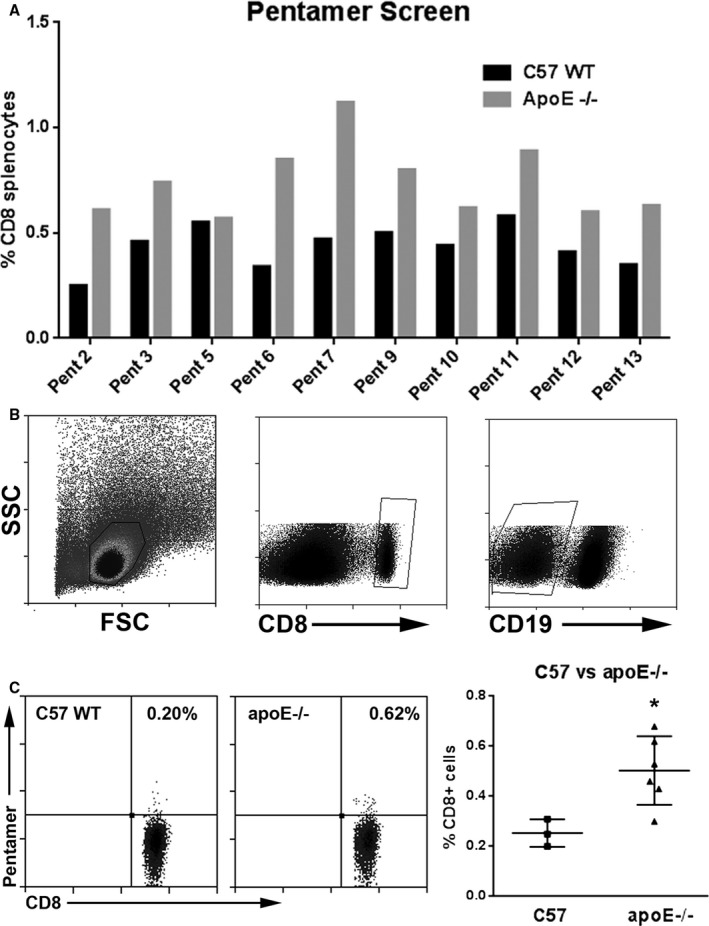
Pentamer 2(+)CD8+ cells in apoE−/− mice. A, Bar graph of relevant p210 epitopes screened in freshly isolated splenocytes of mice as detected by pentamer(+)CD8+ T cells. Screening for potential relevant epitopes was performed by staining freshly isolated splenocytes from 1 C57Bl6/J or pooled from 5 apoE−/− mice age‐matched at 13 weeks. Black bars=C57Bl6/J; gray bars=apoE−/−. B, Cells were size‐gated for lymphocytes and for CD8+ CD19(−) stain. C, Representative scatterplot of Pent 2(+)CD8+ T cells in splenocytes of C57 wild‐type (C57 WT, left panel) or apoE−/− (middle panel) mice. Pentamer 2(+)CD8+ T cells in splenocytes (right panel) of C57 WT mice (N=3) compared with apoE−/− mice (N=6). *P<0.05. FSC indicates Forward Scatter; SSC, Side Scatter.
Atherogenic Diet Increased Pent 2(+)CD8+ T Cells
A major advantage of the apoE−/− mouse model is its predictable progression of atherosclerotic disease with atherogenic diet feeding over time compared with age‐matched mice fed normal chow (Figure 6A through 6D). To determine the effect of an atherogenic diet on Pent 2(+)CD8+ T cells, the spleens were collected for pentamer staining. There was a significant increase in Pent 2(+)CD8+ T cells in apoE−/− mice fed an atherogenic diet for 6 weeks compared with normal chow (0.99±0.15% versus 0.51±0.02%, respectively; P<0.05; Figure 7A and 7B). However, prolonged feeding with normal or atherogenic diet for 15 weeks (euthanized at 22 weeks of age) did not significantly increase percentage of Pent 2(+)CD8+ T cells (Figure 7B). This finding suggests that p210 specific CD8+ T cells expand during the early stage of atherosclerosis development. There was no significant difference in Pent 2(+)CD8+ T cells between the 2 age groups fed an atherogenic diet (Figure 7B).
Figure 6.
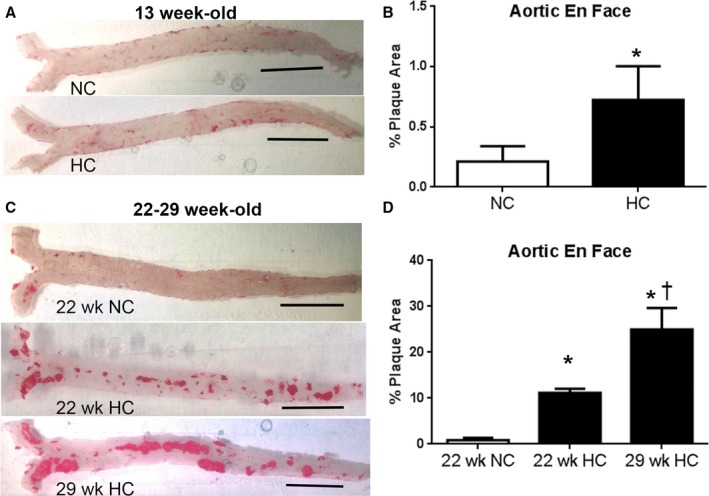
Progression of atherosclerosis after atherogenic diet feeding. A, Representative photos of aortic en face oil‐red‐o staining of plaques in 13‐week‐old mice fed NC or HC. B, Measured percentage plaque area in 13‐week‐old mice fed NC or HC (0.21±0.13% vs 0.72±0.28%, respectively; N=5 each; P<0.01). The study was extended over a longer period of time and included 22‐week‐old mice fed normal chow, 22‐week‐old mice fed an atherogenic diet for 15 weeks, and 29‐week‐old mice fed an atherogenic diet for 22 weeks. C, Representative en face oil red‐o staining of plaques in 22‐ and 29‐week‐old mice fed NC or HC. D, Measured percent plaque area in aorta. *P<0.001 vs 22 weeks NC; † P<0.001 vs 22 weeks HC (22‐week‐old normal chow: 0.9±0.5%, N=4; 22‐week‐old atherogenic diet: 11.2±0.9%, N=4; 29‐week‐old atherogenic diet: 24.9±4.7%, N=5; P<0.001, ANOVA). Bar = 0.5 cm in 6A and 6C. HC indicates atherogenic diet; NC, normal chow.
Figure 7.
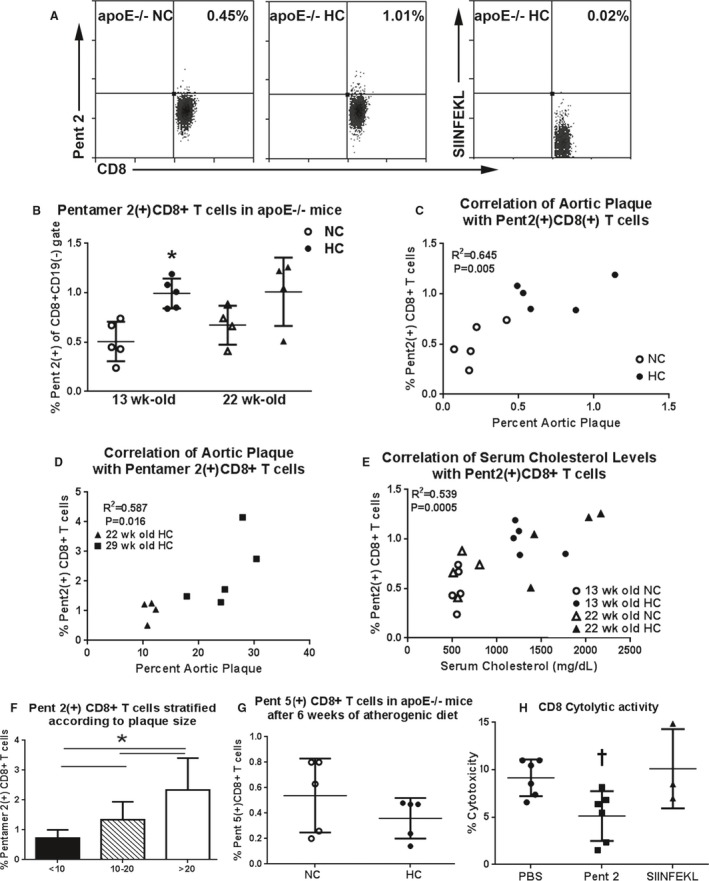
Pentamer 2(+)CD8+ cells in apoE−/− mice. A, Representative scatterplot of Pent 2(+)CD8+ T cells in splenocytes of 13‐week‐old apoE−/− mice fed normal chow (apoE−/− NC) or an atherogenic diet (apoE−/− HC). Specificity of the stain was assured by the use of an H2‐Kb allele‐matched, nonrelevant pentamer with the OVA peptide SIINFEKL. B, Graph of Pent 2(+)CD8+ T cells in splenocytes of apoE−/− mice. N=5 each for 13‐week‐old and N=4 each for 22‐week‐old mice. *P<0.05. Open symbol: normal chow; closed symbol: atherogenic diet. C, Percent aortic plaque area was significantly correlated with percent Pent 2(+)CD8+ T cells in 13‐week‐old mice. D, Plaque area was also correlated with Pent 2(+)CD8+ T cells in older apoE−/− mice. E, There was significant correlation between serum levels of total cholesterol and the percentage of Pent 2(+)CD8+ T cells in the 13‐ and 22‐week‐old mice (R 2=0.539, P=0.0005). F, Pent 2(+) CD8+ T cells plotted according to stratified percent aortic plaque size (x‐axis) from mice fed an atherogenic diet for 13 to 22 weeks. <10 N=14; 10 to 20 N=7; >20 N=7; *P<0.05, ANOVA. G, There was no difference in Pent 5(+)CD8+ T cells in 13‐week‐old mice fed NC or HC. H, Pentamer 2 significantly reduced cytolytic activity of CD8+ T cells from mice fed the atherogenic diet for 6 weeks. PBS and Pent 2 N=6 each; SIINFEKL N=3; † P<0.05 vs PBS; Kruskal–Wallis and Dunn's multiple comparison test.
We then tested for age‐controlled correlation between percent plaque area and percentage of Pent 2(+)CD8+ T cells using 13‐week‐old apoE−/− fed normal chow or atherogenic diet. There was a significant correlation between percent aortic plaque area and percentage of Pent 2(+)CD8+ T cells in 13‐week‐old mice (R 2=0.645; P=0.005; Figure 7C). Thus, this observation further supports the notion that the changes in the frequency of Pent 2(+)CD8+ T cells occurred in response to the diet early in the disease process. We also tested whether the correlation would persist as the plaques progressed by feeding apoE−/− mice with an atherogenic diet for 15 or 22 weeks. There was a significant correlation of percent aortic plaque area (R 2=0.587, P=0.016; Figure 7D) and serum cholesterol levels (Figure 7E) with the percentage of Pent 2(+)CD8+ T cells in these mice. Plaque sizes from mice fed atherogenic diet for 15, 18, and 22 weeks were further stratified into 3 size‐escalating groups to assess the association between plaque size and Pent 2(+)CD8+ T cells. There was a significant increase in Pent 2(+)CD8+ T cells associated with increased aortic atherosclerotic plaques (Figure 7F). Pent 5(+)CD8+ T cells (Figure 7G), on the other hand, did not increase in atherogenic diet–fed mice, suggesting a degree of specificity of the effect of diet on certain p210‐pentamers such as Pent 2.
Cytotoxic Activity of CD8+ T Cells From Atherogenic Diet–Fed Mice Is Partially Blocked by Pent 2
We showed that feeding an atherogenic diet increased CD8+ T‐cell cytotoxic activity (Figure 2E). To determine whether Pent 2(+)CD8+ T cells played a role in the cytotoxic activity of CD8+ T cells from atherogenic diet–fed mice, we used a pentamer‐mediated blocking approach.21 There was a significant reduction in cytotoxic activity after Pent 2 blocking (PBS: 9.2±1.9%, Pent 2: 5.1±2.6%; P<0.05; Figure 7F). SIINFEKL pentamer as control had no significant effect (10.1±4.2%).
TCR Vβ Profile of Pent 2(+)CD8+ T Cells After Atherogenic Diet
Clonotyping of Vβ use is a useful tool to assess TCR switching of antigen‐specific T cells. We therefore assessed TCR Vβ use in splenocytes pooled from 5 mice each fed either normal chow or atherogenic diet for 6 weeks. Pent 2(+)CD8+ T cells showed a shift from a β3 dominance in the normal chow–fed mice to β2 and β4 dominance in the atherogenic diet–fed mice (Figure 8A through 8C).
Figure 8.
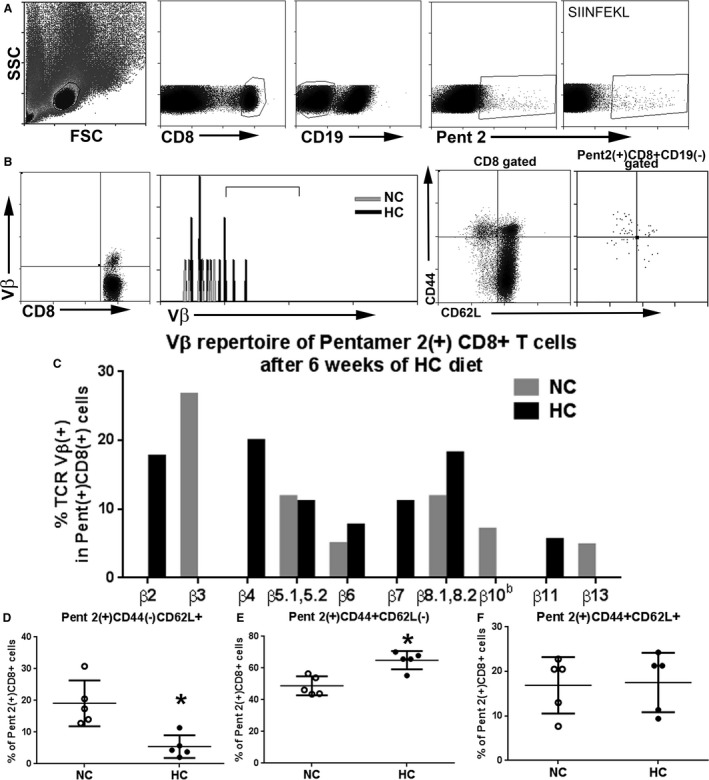
Analysis of TCR Vβ use and Pent2(+)CD8+ T cell subtypes in 13‐week‐old apoE−/− mice fed either normal chow or atherogenic diet for 6 weeks. A, Cells were size‐gated for lymphocytes then CD8+, CD19(−), and Pent 2(+) stain. The OVA H2Kb pentamer SIINFEKL was used as control. Representative scatterplot of Vβ staining of CD8+ T cells as gating reference for Vβ analysis, and representative histogram depicting Vβ positive staining in Pent 2(+)CD8+ gated T cells (B, left panels). Representative scatterplot of CD44 and CD62L staining of CD8+ T‐cell gated splenocytes from 13‐week‐old mice fed an atherogenic diet for 6 weeks as reference for Pent 2(+)CD8+ T‐cell analysis (B, right panel). C, Vβ repertoire of Pent 2(+)CD8+ T cells. D, Pent 2(+)CD8+ gated naïve T cells. E, Pent 2(+)CD8+ gated effector memory T cells. F, Pent 2(+)CD8+ gated central memory T cells. *P<0.05; N=5 per group. FSC indicates Forward Scatter; HC, atherogenic diet; NC, normal chow; SSC, Side Scatter; TCR, T‐cell receptor.
Atherogenic Diet Increased Pent 2(+)CD8+ T EM Cells
Atherogenic diet feeding increased EM T cells and reduced CM T cells in total CD8+ T‐cell population (Figure 2A and 2B). To assess Pent 2(+)CD8+ T‐cell subpopulations, we costained splenocytes from 13‐week‐old mice fed either normal chow or atherogenic diet with CD62L and CD44 for memory cell profiling. There was a significant decrease in Pent 2(+)CD8+CD44(−)CD62L+ naïve T cells in mice fed an atherogenic diet compared with normal chow (5.5±3.6% versus 19.1±7.2%, respectively; P<0.01; Figure 8A and 8B for gating strategy, and 8D). There was also a significant increase in Pent 2(+)CD8+CD44+CD62L(−) EM cells in atherogenic diet–fed mice (65.0±5.7% versus 48.8±6.0%, respectively; P<0.01; Figure 8E). No significant difference was observed in the Pent 2(+)CD8+CD44+CD62L+ CM cells (Figure 8F). We also detected Pent 2(+)CD8+ T cells in the aortas (27.8±14.2%, N=4) of apoE−/− mice fed atherogenic diet for 22 weeks (Figure 9). However, the limited availability of retrieved cells from enzymatically digested aortas was prohibitive in performing memory subtype analysis.
Figure 9.
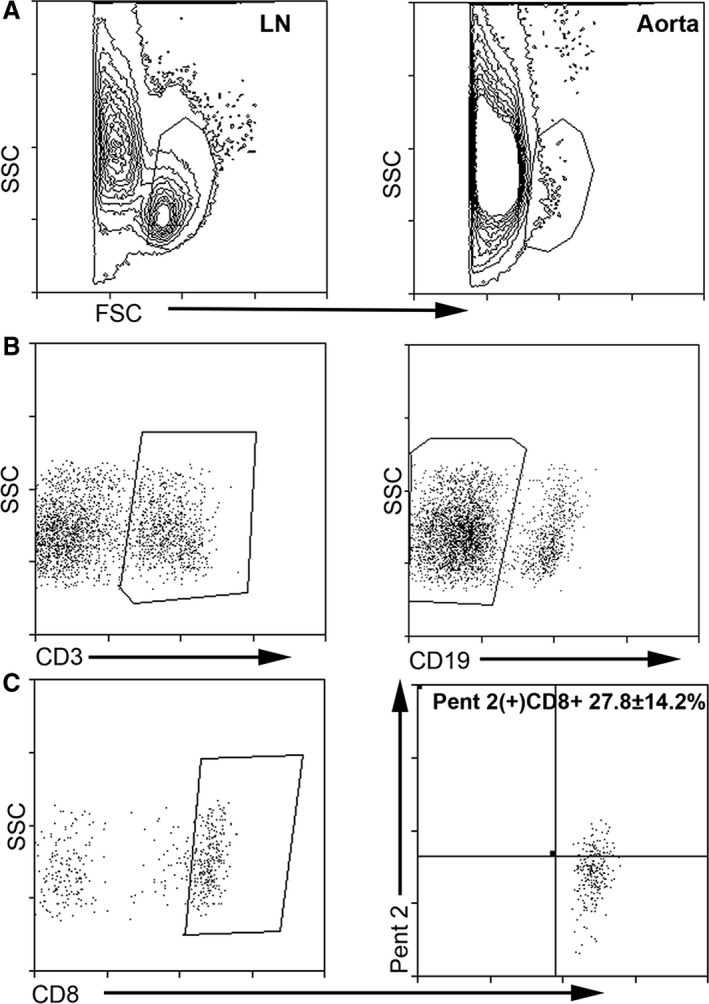
Pent 2(+)CD8+ T cells localize in the atherosclerotic plaques of apoE−/− mice. Aortas from apoE−/− mice fed an atherogenic diet for 22 weeks were subjected to enzymatic digestion and stained with the pentamer. Gating strategy was based on doublet and dead cell exclusion using the viability stain. Size gating was then performed based on lymph node cells after the dump gate exclusion (A). Size‐gated cells were then selected (B) for CD3e+, CD19(−), and CD8+ cells then plotted for Pent 2(+) CD8+ T cells (C). FSC indicates Forward Scatter; LN, lymph node cells; SSC, Side Scatter.
Immunization With p210 Peptide Shifts the Immune‐Dominant Epitope
Given that we had developed a tool to assess p210‐specific CD8+ T cells, we then determined the immune‐dominant epitopes induced by p210 immunization by screening for pentamer staining using splenocytes pooled from 5 mice. Mice injected with PBS or cBSA/alum served as controls. We identified 2 pentamers with more than 2‐fold increase in p210‐immunized mice compared with controls (Pent 5 and Pent 9, Figure 10A). We then used Pent 5 for further studies, given that it had the larger difference of the 2 compared with the respective controls and was ranked with the second‐highest prediction score in the IEDB report (Table 1). The increase in Pent 5(+)CD8+ T cells in p210‐immunized mice compared with PBS and cBSA controls was confirmed in individual mice (1.3±0.9% versus 0.6±0.4% and 0.7±0.4%, respectively; P<0.05; Figure 10B). Pent 12 was also tested, given that there was a high percentage of Pent 12(+)CD8+ T cells in the p210 immunized group, even as the percentage also tended to be higher in the control groups as well. Pent 12(+)CD8+ T cells were not significantly higher in the p210‐immunized mice compared with the controls (Figure 10C). Using apoE−/− mice expressing GFP on the FoxP3 promoter, we characterized the effect of p210 immunization on CD8+FoxP3+ regulatory T cells.6, 31 Immunization did not increase total CD8+FoxP3+ T cells, nor did it increase Pent 5(+) CD8+FoxP3+ T cells (Figure 10D and 10E, respectively). Immunization did not result in changes in the percentage of CD4+ regulatory T cells (Figure 10F and 10G).
Figure 10.
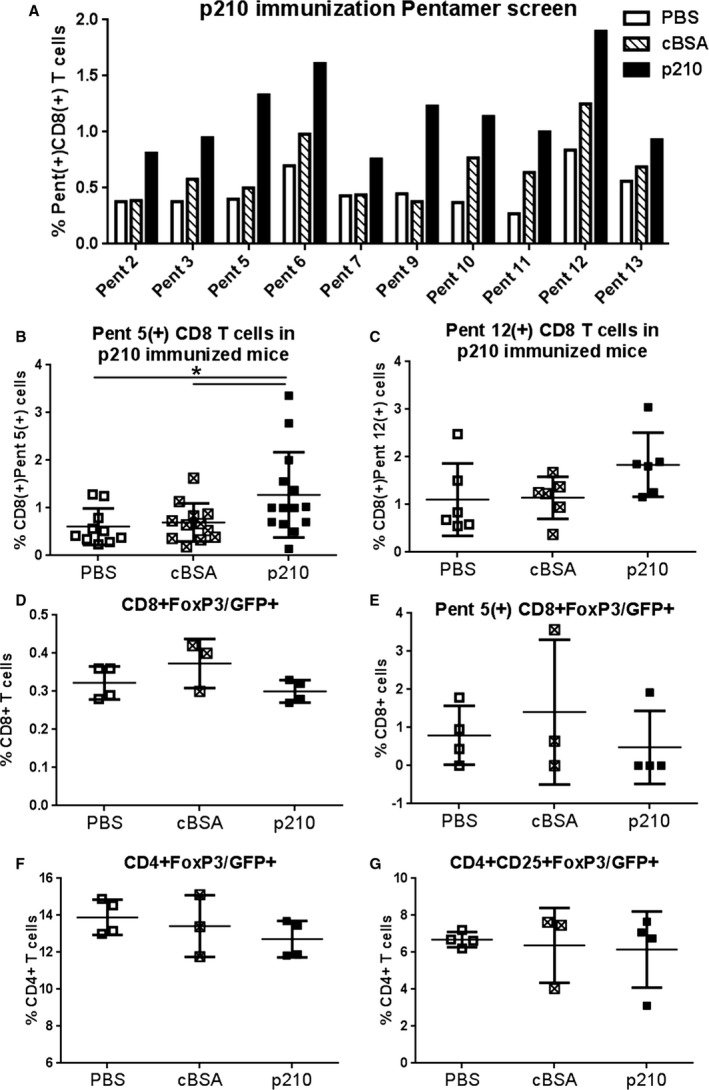
Pentamer(+) CD8+ T cells in apoE−/− mice immunized with the apoB‐100 peptide p210. A, Mice were immunized at 7 weeks of age and administered with booster shots at 10 and 12 weeks of age. At 13 weeks of age, mice were euthanized and the spleens collected for pentamer screening. Splenocytes from 5 mice per group were pooled. B, The observed increase in Pent 5(+)CD8+ T cells in immunized mice was confirmed in individual mice (PBS N=10; cBSA N=12; p210 N=14; *P<0.05). C, Pent 12(+)CD8+ T cells were also tested in individual mice (N=6 each; P=NS). ApoE−/− mice expressing the GFP protein on the FoxP3 promoter immunized with p210 did not result in changes in total CD8+FoxP3+ (D) or in Pent 5(+)CD8+FoxP3+ T cells (E). No differences were observed in CD4+FoxP3+ or CD4+CD25+FoxP3+ Treg cells (F and G, respectively); PBS N=4; cBSA N=3; p210 N=4). cBSA indicates cationic bovine serum albumin; NS, not significant.
Functional Characterization of Pent 5(+)CD8+ T Cells Induced by p210 Immunization
Negatively isolated CD8+ T cells were pooled from 5 p210‐immunized mice and sorted for Pent 5(+) staining using unstained cells and SIINFEKL pentamer as reference (Figure 11A). Pent 5(+)CD8+ T‐cell cytolytic activity was then tested using DCs as target cells, as we had previously reported.4 Similar to Pent 2, Pent 5 binding on sorted CD8+ T cells significantly reduced cytolytic activity compared with total CD8+ T cells (1.2±2.2% versus 17.0±13.8%, respectively; P<0.05; Figure 11B), given the propensity of pentamer binding to block antigen‐specific CD8+ T‐cell cytolytic activity (Figure 7G).
Figure 11.
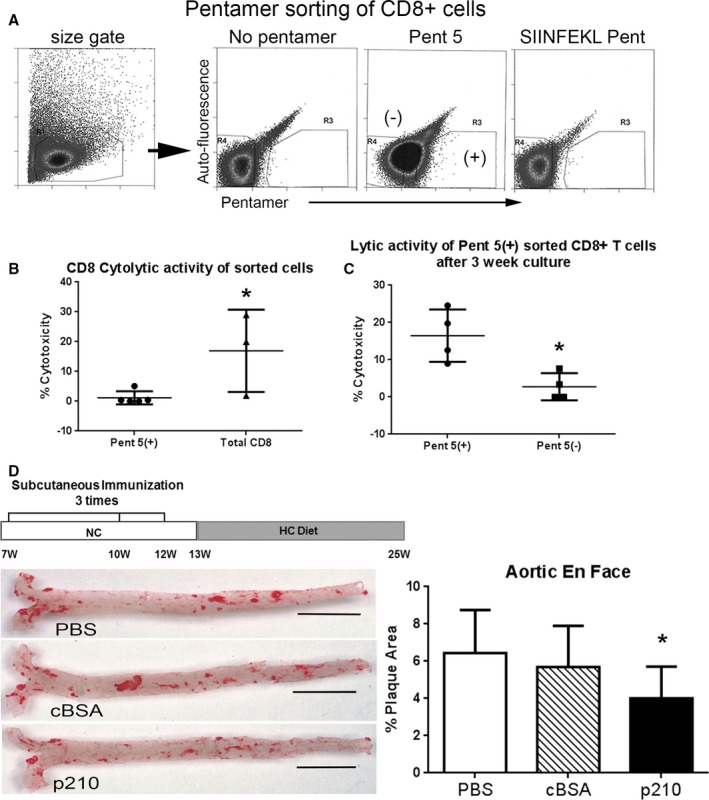
Functional profile of Pent 5(+)CD8+ T cells and atherosclerosis in apoE−/− mice immunized with the apoB‐100 peptide p210. A, Negatively isolated CD8+ T cells pooled from 5 mice immunized with p210 were sorted based on Pent 5 staining using unstained cells and SIINFEKL pentamer‐stained cells as reference. B, Sorted CD8+ T cells were then used in a 4‐hour cytolytic assay with dendritic cells as targets. Pent 5(+) N=5; total CD8 N=3; P<0.05. C, An aliquot of the sorted cells was further cultured for 21 days with IL‐2 supplementation (see Methods), collected, and used in the cytolytic assay. N=4 each; P<0.05. D, Immunization with p210 according to the illustrated schedule reduced aortic atherosclerosis in apoE−/− mice at 25 weeks of age as measured by oil red‐o stained lipid area. Representative photos of en face oil red‐o stain of aortas (bar=0.5 cm). Measurements of percentage plaque area were plotted. PBS N=22; cBSA N=21; p210 N=25; *P<0.01 vs PBS and cBSA. cBSA indicates cationic bovine serum albumin; HC, atherogenic diet; IL‐2, interleukin‐2; NC, normal chow.
Antigen‐specific tetramers have been used to expand antigen‐specific cells in order to evaluate function.32 Using the same technique, an aliquot of both Pent 5(+) and Pent 5(−) sorted CD8+ T cells were cultured in vitro in medium supplemented with IL‐2 as T‐cell growth factor. After 21 days in culture, the cells were once again tested for cytolytic activity. Both Pent 5(+) and Pent 5(−) CD8+ T‐cell aliquots expanded. However, cytolytic activity in the expanded Pent 5(+) aliquot was significantly higher compared with expanded Pent 5(−) aliquot (16.5±7.0% versus 2.8±3.6%, respectively; P<0.05; Figure 11C). Immunization with the p210 peptide reduced atherosclerosis as measured by en face oil red‐o stain area compared with PBS and cBSA control groups (4.0±1.7% versus 6.4±2.3% and 5.7±2.2%, respectively; P<0.01; Figure 11D), confirming our previous report.4
Discussion
Our study shows that (1) CD8+ T‐cell activation and memory generation occurs in response to atherogenic diet feeding in apoE−/− mice; (2) A small fraction of these activated CD8+ T cells in apoE−/− mice are antigen‐specific that are reactive to the p210 peptide fragment of apoB‐100, supporting the notion that p210 is a self‐antigen; and (3) Immunization of apoE−/− mice with the p210 peptide fragment altered the immune‐dominant epitopes, concurrent with reduced atherosclerosis. This has significant implications in our efforts to characterize immune functions in atherosclerosis and develop potential apoB‐100 peptide‐based vaccine candidates.4, 22
T‐cell activation is a hallmark feature of adaptive immunity. Naïve T cells undergo activation and clonal expansion of antigen‐specific T cells when encountering antigen presented by antigen‐presenting cells in the context of costimulatory signaling. Such antigen‐specific T cells further differentiate into effector and memory cells under the influence of IL‐2 and other cytokines produced by T cells and antigen‐presenting cells. Effector T cells migrate to the site of antigens (such as infection or inflammatory sites) to eliminate the source of antigens. In the case of CD8+ T cells, CD8+ cytotoxic T cells are the effector cells. Memory T cells have 2 main subclasses: CM cells and EM cells. CM cells are characterized by expression of CD44 and CD62L, differentiated from EM cells by their increased potential for proliferation upon antigen re‐encounter. EM cells express CD44 with low CD62L and typically have rapid effector response but less proliferative potential.33 Functionally, EM T cells control the initial re‐exposure of antigen, allowing time for CM T cells to expand and generate new effectors.33
The atherogenic diet–induced generation of EM CD8+ T cells occurred early in the disease process, in agreement with a prior study that showed immune changes detectable only in the mediastinal lymph nodes and the spleen, not in other tissues.16 Based on this report, we focused our study on CD8+ T cells from the spleen. The effect of an atherogenic diet on CD8+ memory T cells also concurs with a prior report showing a similar effect on EM CD4+ T cells in various models of atherosclerosis.9 Our focus on CD8+ T‐cell responses is based on our previous report delineating the role of CD8+ T cells in the atheroprotective response to p210 immunization.4 Since p210 is derived from a self‐protein, it suggested that some features of the immune modulatory responses were to self‐antigens.
In the current study, treatment of cultured splenocytes from naive apoE−/− mice with p210 peptide provoked a response in CD8+ T cells that was augmented by feeding with an atherogenic diet, suggesting the existence of a CD8+ memory T‐cell recall response to p210. A recent report showed a significant proportion of bone marrow CD8+ T cells, although low in absolute numbers, were expressing the EM phenotype.24 Our results are in agreement with the report. There was a lack of response to p210 stimulation, suggesting that they are not likely to play a significant role in the CD8+ T‐cell response to p210 in the apoE−/− model of atherosclerosis. However, we cannot exclude the possibility that bone marrow CD8+ T cells reactive to other antigens may play a role in atherosclerosis.
Peptide binding assays identified potential p210 peptide/MHC complexes with the mouse MHC‐I allele H2Kb. Optimization and characterization of the pentamer staining and gating strategy showed that the majority were CD3+CD8+ T cells, with no detectable CD49b+ NK cells. There was, however, a small number of CD11c+CD3+CD8+ T cells that may correspond to a previously reported CD8+ T‐cell subtype.34, 35, 36 The significance of this subgroup remains to be investigated. Screening of the pentamers generated based on the result of the binding assays identified a small number of p210 self‐reactive CD8+ T cells present in higher numbers in apoE−/− mice. Pent 2 was chosen for further study based on 3 observations: (1) More than 2‐fold increase in reactive CD8+ T cells, which was the maximum degree of difference found between apoE−/− and wild‐type mice; (2) It had the lowest reactivity with CD8+ T cells from wild‐type mice; and (3) Its rank with the highest predictive score in the IEDB report (Table 1). Using Pent 2 as prototype, our results further show increased EM cell population of these p210‐reactive CD8+ T cells in mice fed an atherogenic diet. We cannot rule out the possibility that CD8+ T cells in the apoE−/− mice would react to all the pentamers, which can only be verified by testing all the pentamers on individual mice. However, it should be noted that atherogenic diet feeding did not increase Pent 5(+)CD8+ T cells when assessed in individual apoE−/− mice, suggesting a certain degree of specificity of p210(+) CD8+ T cells under pro‐atherogenic challenge.
In addition to increased EM subset in the Pent 2(+)CD8+ T cells, there was also a shift in TCR Vβ use and increased lytic activity. The rearrangement of the TCR molecular organization that occurs during T cell differentiation reflects clonality and antigen specificity in atherosclerosis that can be detected by shifts in Vβ expression.8 The observed change in Vβ expression pattern of Pent 2(+)CD8+ T cells supports the notion of selective p210‐specific CD8+ T‐cell response to atherogenic diet–feeding of apoE−/− mice. We believe this is the first report of a functional, antigen‐specific CD8+ T‐cell population reactive to a fragment of apoB‐100 demonstrable in mice.
Although the immune system is designed to purge self‐reactive T cells, a small number escape into the periphery.37, 38 Previous reports provide evidence that endogenous LDL‐reactive CD4+ T cells and CD8+ T cells exist.39, 40, 41 Our results further support the possibility that some of these self‐reactive antigen‐specific CD8+ T cells are induced during the atherogenesis process in immune organs such as the spleen.16 The percentage of Pent 2(+)CD8+ T cells correlated with plaque size in the 13‐week‐old mice, as well as in older mice, suggesting involvement in the disease process. However, correlation does not mean causation and investigations must be conducted to determine to what degree these cells are involved in the disease process.
Our previous report showed that modifying the immune response to the p210 peptide by immunization results in reduced atherosclerosis.4 Our current results show that the immunization strategy altered CD8+ T‐cell immune response to the p210 antigen, as shown by increased Pent 5(+)CD8+ T cells compared with the dominant immune epitope after atherogenic diet feeding, demonstrated by increased Pent 2(+)CD8+ T cells. Functional assessment of the immunization‐induced immune‐dominant CD8+ T‐cell shift was accomplished using Pent 5(+) sorted CD8+ T cells. The procedure was to accomplish 2 goals. One was to replicate the blocking function of pentamer binding to antigen‐specific CD8+ T cells. This was demonstrated by the significantly reduced cytolytic activity of Pent 5(+) sorted CD8+ T cells against target DCs compared with total CD8+ T cells from the immunized mice, an outcome similar to blocking the diet‐induced cytolytic activity of Pent 2(+)CD8+ T cells. Another goal was to use pentamer binding as a costimulus to expand the functional CD8+ T cells in an antigen‐specific manner in the presence of IL‐2 and CD3/CD28 antibodies. Our results demonstrated that the cytolytic function of the Pent 5(+) sorted CD8+ T cells against target DCs persisted under conditions that favored T‐cell growth. DCs were used as target cells in the current immunization studies because we had previously shown significantly increased cytolytic activity against DCs by CD8+ T cells after p210 immunization.4 We have also demonstrated that macrophages can be targets for lysis by p210 immune CD8+ T cells in a model of angiotensin‐II‐induced aneurysm formation.22
There are limitations to the study in addition to those already mentioned. We have not yet defined the role of each pentamer‐specific CD8+ T‐cell population. We have attempted to isolate the cells to use in adoptive cell transfer studies, but the extremely low number of cells is very prohibitive. Expanding the pentamer‐specific cells in vitro to obtain sufficient numbers is another option, but in vitro expansion of antigen‐specific CD8+ T cells with antigen may alter the dominant T‐cell repertoire.42 Thus, the expanded cells may not be functionally identical. However, we continue to investigate other approaches to define the role of apoB‐100 pentamer‐specific CD8+ T cells in atherosclerosis.
In conclusion, our study provides evidence of a self‐reactive, antigen‐specific CD8+ T‐cell population in apoE−/− mice that is increased by feeding mice an atherogenic diet, differentiates into an EM type with a shift in TCR Vβ use, and has cytolytic function. In addition, we provide evidence that this self‐reactive immune response is altered by immunization, resulting in a shift in the dominant epitope response and reduced atherosclerosis. EM CD8+ T cells have been reported in human atherosclerotic plaques and EM CD8+ T cells in the blood were significantly higher in patients compared with healthy controls.43 This body of evidence suggests a potential role for CD8+ T cells in modulating atherosclerosis in humans. Our study provides the framework for potential investigations on the concept of self‐reactive CD8+ T‐cell immune responses specific to apoB‐100 in human atherosclerotic disease.
Sources of Funding
This work was supported by the Heart Foundation, the Spielberg Cardiovascular Research Fund, the Petersen Foundation, the Steinberg Foundation, the Annnenberg Foundation, and Cardiovax Inc. Mihailovic was supported by the Eleanor and Harold Foonberg Endowed Chair in Cardiac Intensive Care Fund.
Disclosures
Shah and Chyu are coinventors of apoB‐100 peptide vaccines and have assigned patent rights to Cedars‐Sinai Medical Center. Shah is an unpaid scientific advisor of Cardiovax Inc.
(J Am Heart Assoc. 2017;6:e005318 DOI: 10.1161/JAHA.116.005318.)28711866
References
- 1. Koltsova EK, Garcia Z, Chodaczek G, Landau M, McArdle S, Scott SR, von Vietinghoff S, Galkina E, Miller YI, Acton ST, Ley K. Dynamic T cell‐APC interactions sustain chronic inflammation in atherosclerosis. J Clin Invest. 2012;122:3114–3126. [DOI] [PMC free article] [PubMed] [Google Scholar]
- 2. Dimayuga PC, Chyu KY, Kirzner J, Yano J, Zhao X, Zhou J, Shah PK, Cercek B. Enhanced neointima formation following arterial injury in immune deficient Rag‐1‐/‐ mice is attenuated by adoptive transfer of CD8 T cells. PLoS One. 2011;6:e20214. [DOI] [PMC free article] [PubMed] [Google Scholar]
- 3. Dimayuga PC, Chyu KY, Lio WM, Zhao X, Yano J, Zhou J, Honjo T, Shah PK, Cercek B. Reduced neointima formation after arterial injury in CD4‐/‐ mice is mediated by CD8+CD28hi T cells. J Am Heart Assoc. 2013;2:e000155 DOI: 10.1161/JAHA.113.000155. [DOI] [PMC free article] [PubMed] [Google Scholar]
- 4. Chyu KY, Zhao X, Dimayuga PC, Zhou J, Li X, Yano J, Lio WM, Chan LF, Kirzner J, Trinidad P, Cercek B, Shah PK. CD8 T cells mediate the athero‐protective effect of immunization with an ApoB‐100 peptide. PLoS One. 2012;7:e30780. [DOI] [PMC free article] [PubMed] [Google Scholar]
- 5. Kyaw T, Winship A, Tay C, Kanellakis P, Hosseini H, Cao A, Li P, Tipping P, Bobik A, Toh BH. Cytotoxic and proinflammatory CD8+ T lymphocytes promote development of vulnerable atherosclerotic plaques in apoE‐deficient mice. Circulation. 2013;127:1028–1039. [DOI] [PubMed] [Google Scholar]
- 6. Zhou J, Dimayuga PC, Zhao X, Yano J, Lio WM, Trinidad P, Honjo T, Cercek B, Shah PK, Chyu KY. CD8(+)CD25(+) T cells reduce atherosclerosis in apoE(‐/‐) mice. Biochem Biophys Res Commun. 2014;443:864–870. [DOI] [PubMed] [Google Scholar]
- 7. Ketelhuth DF, Gistera A, Johansson DK, Hansson GK. T cell‐based therapies for atherosclerosis. Curr Pharm Des. 2013;19:5850–5858. [DOI] [PubMed] [Google Scholar]
- 8. Oksenberg JR, Stavri GT, Jeong MC, Garovoy N, Salisbury JR, Erusalimsky JD. Analysis of the T‐cell receptor repertoire in human atherosclerosis. Cardiovasc Res. 1997;36:256–267. [DOI] [PubMed] [Google Scholar]
- 9. Ammirati E, Cianflone D, Vecchio V, Banfi M, Vermi AC, De Metrio M, Grigore L, Pellegatta F, Pirillo A, Garlaschelli K, Manfredi AA, Catapano AL, Maseri A, Palini AG, Norata GD. Effector memory T cells are associated with atherosclerosis in humans and animal models. J Am Heart Assoc. 2012;1:e000125 DOI: 10.1161/JAHA.111.000125. [DOI] [PMC free article] [PubMed] [Google Scholar]
- 10. Chyu KY, Zhao X, Reyes OS, Babbidge SM, Dimayuga PC, Yano J, Cercek B, Fredrikson GN, Nilsson J, Shah PK. Immunization using an Apo B‐100 related epitope reduces atherosclerosis and plaque inflammation in hypercholesterolemic apo E (‐/‐) mice. Biochem Biophys Res Commun. 2005;338:1982–1989. [DOI] [PubMed] [Google Scholar]
- 11. Fredrikson GN, Soderberg I, Lindholm M, Dimayuga P, Chyu KY, Shah PK, Nilsson J. Inhibition of atherosclerosis in apoE‐null mice by immunization with apoB‐100 peptide sequences. Arterioscler Thromb Vasc Biol. 2003;23:879–884. [DOI] [PubMed] [Google Scholar]
- 12. Klingenberg R, Lebens M, Hermansson A, Fredrikson GN, Strodthoff D, Rudling M, Ketelhuth DF, Gerdes N, Holmgren J, Nilsson J, Hansson GK. Intranasal immunization with an apolipoprotein B‐100 fusion protein induces antigen‐specific regulatory T cells and reduces atherosclerosis. Arterioscler Thromb Vasc Biol. 2010;30:946–952. [DOI] [PubMed] [Google Scholar]
- 13. Ameli S, Hultgardh‐Nilsson A, Regnstrom J, Calara F, Yano J, Cercek B, Shah PK, Nilsson J. Effect of immunization with homologous LDL and oxidized LDL on early atherosclerosis in hypercholesterolemic rabbits. Arterioscler Thromb Vasc Biol. 1996;16:1074–1079. [DOI] [PubMed] [Google Scholar]
- 14. Palinski W, Miller E, Witztum JL. Immunization of low density lipoprotein (LDL) receptor‐deficient rabbits with homologous malondialdehyde‐modified LDL reduces atherogenesis. Proc Natl Acad Sci USA. 1995;92:821–825. [DOI] [PMC free article] [PubMed] [Google Scholar]
- 15. Chyu KY, Reyes OS, Zhao X, Yano J, Dimayuga P, Nilsson J, Cercek B, Shah PK. Timing affects the efficacy of LDL immunization on atherosclerotic lesions in apo E (‐/‐) mice. Atherosclerosis. 2004;176:27–35. [DOI] [PubMed] [Google Scholar]
- 16. Kolbus D, Ramos OH, Berg KE, Persson J, Wigren M, Bjorkbacka H, Fredrikson GN, Nilsson J. CD8+ T cell activation predominate early immune responses to hypercholesterolemia in Apoe(/) mice. BMC Immunol. 2010;11:58. [DOI] [PMC free article] [PubMed] [Google Scholar]
- 17. Almanzar G, Ollinger R, Leuenberger J, Onestingel E, Rantner B, Zehm S, Cardini B, van der Zee R, Grundtman C, Wick G. Autoreactive HSP60 epitope‐specific T‐cells in early human atherosclerotic lesions. J Autoimmun. 2012;39:441–450. [DOI] [PMC free article] [PubMed] [Google Scholar]
- 18. Hendel A, Cooper D, Abraham T, Zhao H, Allard MF, Granville DJ. Proteinase inhibitor 9 is reduced in human atherosclerotic lesion development. Cardiovasc Pathol. 2012;21:28–38. [DOI] [PubMed] [Google Scholar]
- 19. Cochain C, Koch M, Chaudhari SM, Busch M, Pelisek J, Boon L, Zernecke A. CD8+ T cells regulate monopoiesis and circulating Ly6Chigh monocyte levels in atherosclerosis in mice. Circ Res. 2015;117:244–253. [DOI] [PubMed] [Google Scholar]
- 20. Mayr M, Grainger D, Mayr U, Leroyer AS, Leseche G, Sidibe A, Herbin O, Yin X, Gomes A, Madhu B, Griffiths JR, Xu Q, Tedgui A, Boulanger CM. Proteomics, metabolomics, and immunomics on microparticles derived from human atherosclerotic plaques. Circ Cardiovasc Genet. 2009;2:379–388. [DOI] [PubMed] [Google Scholar]
- 21. Yokouchi H, Chamoto K, Wakita D, Noguchi D, Yamazaki K, Dosaka‐Akita H, Nishimura M, Ikeda H, Nishimura T. Tetramer‐blocking assay for defining antigen‐specific cytotoxic T lymphocytes using peptide‐MHC tetramer. Cancer Sci. 2006;97:148–154. [DOI] [PMC free article] [PubMed] [Google Scholar]
- 22. Honjo T, Chyu KY, Dimayuga P, Yano J, Lio WM, Trinidad P, Zhao X, Zhou J, Chen S, Cercek B, Arditi M, Shah PK. ApoB‐100–related peptide vaccine protects against angiotensin II–induced aortic aneurysm formation and rupture. J Am Coll Cardiol. 2015;65:546–556. [DOI] [PubMed] [Google Scholar]
- 23. Betts MR, Brenchley JM, Price DA, De Rosa SC, Douek DC, Roederer M, Koup RA. Sensitive and viable identification of antigen‐specific CD8+ T cells by a flow cytometric assay for degranulation. J Immunol Methods. 2003;281:65–78. [DOI] [PubMed] [Google Scholar]
- 24. Geerman S, Hickson S, Brasser G, Pascutti MF, Nolte MA. Quantitative and qualitative analysis of bone marrow CD8(+) T cells from different bones uncovers a major contribution of the bone marrow in the vertebrae. Front Immunol. 2016;6:660. [DOI] [PMC free article] [PubMed] [Google Scholar]
- 25. Kim Y, Ponomarenko J, Zhu Z, Tamang D, Wang P, Greenbaum J, Lundegaard C, Sette A, Lund O, Bourne PE, Nielsen M, Peters B. Immune epitope database analysis resource. Nucleic Acids Res. 2012;40:W525–W530. [DOI] [PMC free article] [PubMed] [Google Scholar]
- 26. Nielsen M, Lundegaard C, Worning P, Lauemoller SL, Lamberth K, Buus S, Brunak S, Lund O. Reliable prediction of T‐cell epitopes using neural networks with novel sequence representations. Protein Sci. 2003;12:1007–1017. [DOI] [PMC free article] [PubMed] [Google Scholar]
- 27. Lundegaard C, Lamberth K, Harndahl M, Buus S, Lund O, Nielsen M. NetMHC‐3.0: accurate web accessible predictions of human, mouse and monkey MHC class I affinities for peptides of length 8‐11. Nucleic Acids Res. 2008;36:W509–W512. [DOI] [PMC free article] [PubMed] [Google Scholar]
- 28. Peters B, Sette A. Generating quantitative models describing the sequence specificity of biological processes with the stabilized matrix method. BMC Bioinformatics. 2005;6:132. [DOI] [PMC free article] [PubMed] [Google Scholar]
- 29. Sidney J, Assarsson E, Moore C, Ngo S, Pinilla C, Sette A, Peters B. Quantitative peptide binding motifs for 19 human and mouse MHC class I molecules derived using positional scanning combinatorial peptide libraries. Immunome Res. 2008;4:2–4. [DOI] [PMC free article] [PubMed] [Google Scholar]
- 30. Falk K, Rotzschke O, Stevanovic S, Jung G, Rammensee HG. Allele‐specific motifs revealed by sequencing of self‐peptides eluted from MHC molecules. Nature. 1991;351:290–296. [DOI] [PubMed] [Google Scholar]
- 31. Churlaud G, Pitoiset F, Jebbawi F, Lorenzon R, Bellier B, Rosenzwajg M, Klatzmann D. Human and mouse CD8(+)CD25(+)FOXP3(+) regulatory T cells at steady state and during interleukin‐2 therapy. Front Immunol. 2015;6:171. [DOI] [PMC free article] [PubMed] [Google Scholar]
- 32. Savage P, Millrain M, Dimakou S, Stebbing J, Dyson J. Expansion of CD8+ cytotoxic T cells in vitro and in vivo using MHC class I tetramers. Tumour Biol. 2007;28:70–76. [DOI] [PubMed] [Google Scholar]
- 33. Pennock ND, White JT, Cross EW, Cheney EE, Tamburini BA, Kedl RM. T cell responses: naive to memory and everything in between. Adv Physiol Educ. 2013;37:273–283. [DOI] [PMC free article] [PubMed] [Google Scholar]
- 34. Beyer M, Wang H, Peters N, Doths S, Koerner‐Rettberg C, Openshaw PJ, Schwarze J. The beta2 integrin CD11c distinguishes a subset of cytotoxic pulmonary T cells with potent antiviral effects in vitro and in vivo. Respir Res. 2005;6:70. [DOI] [PMC free article] [PubMed] [Google Scholar]
- 35. Qualai J, Li LX, Cantero J, Tarrats A, Fernandez MA, Sumoy L, Rodolosse A, McSorley SJ, Genesca M. Expression of CD11c is associated with unconventional activated T cell subsets with high migratory potential. PLoS One. 2016;11:e0154253. [DOI] [PMC free article] [PubMed] [Google Scholar]
- 36. Cooney LA, Gupta M, Thomas S, Mikolajczak S, Choi KY, Gibson C, Jang IK, Danziger S, Aitchison J, Gardner MJ, Kappe SH, Wang R. Short‐lived effector CD8 T cells induced by genetically attenuated malaria parasite vaccination express CD11c. Infect Immun. 2013;81:4171–4181. [DOI] [PMC free article] [PubMed] [Google Scholar]
- 37. Turner MJ, Jellison ER, Lingenheld EG, Puddington L, Lefrancois L. Avidity maturation of memory CD8 T cells is limited by self‐antigen expression. J Exp Med. 2008;205:1859–1868. [DOI] [PMC free article] [PubMed] [Google Scholar]
- 38. Zehn D, Bevan MJ. T cells with low avidity for a tissue‐restricted antigen routinely evade central and peripheral tolerance and cause autoimmunity. Immunity. 2006;25:261–270. [DOI] [PMC free article] [PubMed] [Google Scholar]
- 39. Hansson GK, Jonasson L. The discovery of cellular immunity in the atherosclerotic plaque. Arterioscler Thromb Vasc Biol. 2009;29:1714–1717. [DOI] [PubMed] [Google Scholar]
- 40. Stemme S, Faber B, Holm J, Wiklund O, Witztum JL, Hansson GK. T lymphocytes from human atherosclerotic plaques recognize oxidized low density lipoprotein. Proc Natl Acad Sci USA. 1995;92:3893–3897. [DOI] [PMC free article] [PubMed] [Google Scholar]
- 41. Wu R, Giscombe R, Holm G, Lefvert AK. Induction of human cytotoxic T lymphocytes by oxidized low density lipoproteins. Scand J Immunol. 1996;43:381–384. [DOI] [PubMed] [Google Scholar]
- 42. Koning D, Costa AI, Hasrat R, Grady BP, Spijkers S, Nanlohy N, Kesmir C, van Baarle D. In vitro expansion of antigen‐specific CD8(+) T cells distorts the T‐cell repertoire. J Immunol Methods. 2014;405:199–203. [DOI] [PubMed] [Google Scholar]
- 43. Grivel JC, Ivanova O, Pinegina N, Blank PS, Shpektor A, Margolis LB, Vasilieva E. Activation of T lymphocytes in atherosclerotic plaques. Arterioscler Thromb Vasc Biol. 2011;31:2929–2937. [DOI] [PMC free article] [PubMed] [Google Scholar]