

Abstract
Background
There is uncertainty regarding the clinical utility of the data obtained from patient‐reported outcome measures (PROMs) for patient care. We evaluated the incremental information obtained by PROMs compared to the clinician‐reported modified Rankin Scale (mRS).
Methods and Results
This was an observational study of 3283 ischemic stroke patients seen in a cerebrovascular clinic from September 14, 2012 to June 16, 2015 who completed the routinely collected PROMs: Stroke Impact Scale‐16 (SIS‐16), EQ‐5D, Patient Health Questionnaire‐9, PROMIS Physical Function, and PROMIS fatigue. The amount of variation in the PROMs explained by mRS was determined using r2 after adjustment for age and level of stroke impairment. The proportion with meaningful change was calculated for patients with ≥2 visits. Concordance with change in the other scales and the ability to discriminate changes in health state as measured by c‐statistic was evaluated for mRS versus SIS‐16. Correlation between PROMs and mRS was highest for SIS‐16 (r=−0.64, P<0.01). The r2 ranged from 0.11 (PROMIS fatigue) to 0.56 (SIS‐16). Change in scores occurred in 51% with mRS and 35% with SIS‐16. There was lower agreement and less ability to discriminate change in mRS than in SIS‐16 with change in the other measures.
Conclusions
PROMs provide additional valuable information compared to the mRS alone in stroke patients seen in the ambulatory setting. SIS‐16 may have a better ability to identify change than mRS in health status of relevance to the patient. PROMs may be a useful addition to mRS in the assessment of health status in clinical practice.
Keywords: ischemic stroke, outcome, patient reported outcome
Subject Categories: Ischemic Stroke, Quality and Outcomes
Clinical Perspective
What Is New?
In this observational study of 3283 ischemic stroke patients who completed PROMs as part of routine outpatient care, a significant proportion of variation in PROM scores was not explained by the mRS.
There was lower agreement and less ability to discriminate change in the clinician‐reported mRS than in the patient‐reported SIS‐16 compared with change in the other measures.
What Are the Clinical Implications?
PROMs may be a useful addition to mRS to assess health status of ischemic stroke patients in clinical practice.
Introduction
Functional status is a primary concern of patients with stroke and their providers. Improvement and worsening in function can occur after stroke,1 which often impacts medical management. Group‐level data on functional status can be used to evaluate the impact of treatments and quality of care and have greater sensitivity to detect differences between patient groups than mortality.2 Functional status is often assessed in routine care settings by a nonstandardized descriptive appraisal, which provides only a limited ability to quantify change. Clinician‐reported measures are also frequently used. Although they provide a quantifiable score, they may not fully reflect a patient's health status because the impact of functional limitations on well‐being differs for each patient. An outcome perceived as “good” by a clinician may not represent an acceptable outcome from a patient or family perspective.3 The collection of patient‐reported outcome measures (PROMs) is becoming increasingly feasible with advances in technology that allow electronic assessment of PROMs that provide automatic scoring and integration within the clinical workflow. Yet, there is uncertainty regarding the clinical utility of the data obtained from PROMs for patient care.
To evaluate the potential benefits of collecting PROMs in clinical practice, this study had the following objectives: (1) to assess the incremental information gained from PROMs commonly used in stroke patients compared to the measurement of global disability as assessed by the commonly used4 clinician‐reported measure of disability, the modified Rankin Scale (mRS); (2) to assess the ability of the PROM that had the highest correlation with the mRS in this study to detect changes over time compared to the mRS.
The World Health Organization's International Classification of Functioning, Disability, and Health (ICF) is a framework for describing and organizing information on functioning and disability.5 Health is categorized into different components. Body Functions generally refer to impairment and describe components of health such as mental functions, sensory functions, and pain. Body Structures encompass structures related to movement or structures of the nervous system and other body systems. Activity refers to execution of a task or action by an individual and was formerly termed “Disability.” Participation refers to involvement in a life situation and was formerly often termed “Handicap.” Activity and Participation are grouped together in the current ICF framework. A second part of ICF covers Contextual Factors, which refers to the physical, social, and attitudinal environment that impacts an individual's health. We have classified each of the outcome measures into the relevant ICF categories.
Methods
Design, Setting, Subjects
This was a retrospective cohort study of ischemic stroke patients seen in the Cleveland Clinic cerebrovascular clinic from September 14, 2012 to June 16, 2015 who completed at least 1 PROM during the study period. As part of routine care, cerebrovascular patients completed the Stroke Impact Scale 16 (SIS‐16), Patient Health Questionnaire 9 (PHQ‐9), EuroQol 5 Dimensions (EQ‐5D), and the Patient‐Reported Outcomes Measurement Information System (PROMIS) physical function (PF) and fatigue scales. Clinicians also completed the National Institutes of Health Stroke Scale (NIHSS) and modified Rankin score (mRS) during each visit. Patient‐ and clinician‐reported scales were collected through the Knowledge Program©, an electronic platform for systematic collection of patient‐reported information.6 PROMs are administered on tablets immediately before an ambulatory visit or through the electronic health record patient portal (MyChart, Epic Systems [Verona, WI]). The system is integrated within the electronic health record, and the data are available at the time of the clinical encounter. The diagnosis of ischemic stroke was obtained from visit diagnosis codes (433.x1, 434.x11, 433.10, 433.91, 434.00, and 436) and provider documentation of ischemic stroke in structured fields of the Knowledge Program©. This study was approved by the Cleveland Clinic Institutional Review Board. Because all data were collected as part of routine care, the requirement for patient informed consent was waived.
Patient‐Reported Outcome Measures
The SIS‐16 is a psychometrically robust patient‐reported scale that measures physical function after stroke.7 Individual questions fall mainly within the Activity ICF classification.8 The final item score ranges from 0 to 100, where higher scores indicate better physical functioning.
The EQ‐5D is a commonly used 5‐item generic scale that measures health‐related quality of life.9 Scores are transformed into utility weights and range from −0.109 (state worse than death) to 1.00 (best possible health). It is a measure of activity in the ICF framework.10
The PHQ‐9 is a 9‐item depression screen frequently used in stroke and other patient populations that ranges from 0 to 27, with higher scores indicating more depressive symptoms.11 It is a measure of body functions in the ICF framework.
The PROMIS PF v1.0 and fatigue v1.0 scales are 2 of numerous scales available in PROMIS, which covers multiple different domains of health, spanning mental, physical, and social realms, and utilizes computer adaptive testing to measure self‐reported health in patients across conditions.12 Scale scores are standardized on the T‐scale where the mean is 50 and standard deviation is 10.13 PROMIS PF assesses the ability to perform activities of daily living and instrumental activities of daily living.13 Higher PROMIS PF scores indicate better physical functioning and higher PROMIS fatigue scores indicate more fatigue symptoms. They are measures of activity and body functions, respectively, in the ICF framework.14
Clinician‐Reported Measures
The NIHSS15 is the standard scale for measuring neurological impairment. It consists of 15 items with scores ranging from 0 to 42, with higher scales indicating greater impairment. It is a measure of body function in the ICF framework.
The mRS is a 1‐item measure of global disability with scores ranging from 0 to 6 with 0 representing no symptoms.16 It is a measure of participation in the ICF framework.10
It is the most commonly used outcome measure in clinical stroke trials.4 All providers have undergone standardized training and are certified in the completion of the mRS,17 which has been shown to improve interobserver reliability.18
Data Analysis
Descriptive statistics were calculated for patient characteristics and health status measure. The proportion of scores at the scale ceiling, defined as the “best” health response option, was calculated for each respective scale from the first visit for all patients in the study cohort.
Assessment of the Additional Information Gained From PROMs
Distribution of scores were calculated for each scale for patients with mRS scores at the ceiling (mRS=0) at their baseline visit to gauge the extent of additional information explained by other PROMs. Because mRS is an ordinal variable, we used pairwise Spearman correlation coefficients to assess the association between measures. The amount of variation in the PROMs explained by mRS was determined by calculating the r2 in linear regression models after adjusting for age and stroke impairment (NIHSS). In these models we treated mRS as a categorical predictor variable. We hypothesized that much of the variation in scale scores would not be explained by the mRS.
Identification of Change
For patients with 2 or more visits, the proportion of patients who had meaningful change was calculated for each of the scales between the first and last visit of the study period. The proportion of patients who demonstrated concordant change in clinician‐reported measures, mRS and NIHSS, with each of the other scales was then determined and compared using the Cohen κ. We hypothesized that a higher proportion of patients would demonstrate meaningful change in PROMs than with the clinician‐reported measures.
Estimates for meaningful change used in this analysis were the following: NIHSS ≥2, PHQ‐9 ≥5, mRS ≥1, EQ‐5D ≥0.11, PROMIS PF ≥5, PROMIS fatigue ≥5, and SIS‐16 ≥9. Commonly accepted criteria for meaningful change were used for the NIHSS19 and mRS.20 One‐half standard deviation, considered to be a conservative estimate of minimally important difference,21 was used to estimate the meaningful change for the EQ‐5D, PROMIS PF, and PROMIS fatigue. A difference of 5 points in PROMIS scales has been considered to be an estimate of meaningful difference.22 The meaningful change estimates for PHQ‐923 and SIS‐1624 were obtained from literature review.
Additional Analysis for the PROM That Had the Highest Correlation With mRS
Additional analysis focused on mRS and the PROM that had the highest correlation with the mRS since performance of this scale would likely be more similar to mRS than other scales. We hypothesized that either the SIS‐16 or PROMIS PF would have the highest correlation with mRS, given that both measure physical function. Distribution of this scale for each level of mRS was calculated to evaluate the potential to more finely describe health status.
To provide insight on whether changes in the PROM and mRS represented true change in patient status rather than imprecision in scores, we evaluated correspondence of change in this PROM and mRS with change in other scales. For each pair of scales, we computed the proportion of patients who were stable on 1 scale but experienced clinically significant change on the other scale. Additionally, for each scale, we determined whether patients had improved, worsened, or remained stable according to the clinically meaningful change thresholds for each scale. Logistic regression models were constructed to determine the discriminant ability of mRS and this PROM to detect meaningful change in the other PROMs within patients who improved and within those who worsened over time. Predictive discrimination was assessed using the index of concordance (c‐statistic) and compared between mRS and this PROM. Ninety‐five percent confidence intervals were constructed around the c‐statistic using DeLong's method and P‐values were calculated utilizing bootstrap methods by sampling with replacement for 2000 iterations.25
Finally, sensitivity analyses were conducted to determine differential responsiveness of the health status measures to discriminate between patient populations. Medians with interquartile ranges for each health status measure were stratified by sex, age group, race, marital status, income level, and comorbidities and compared across characteristics using a Mann‐Whitney U test.
Statistical significance was established throughout at an α level of 0.05. As the results of this study are to assess clinical utility and will focus on effect size and clinical significance, no formal adjustment for multiple comparisons was made. All statistical analyses were conducted using R26 and SAS version 9.4 (SAS Institute Inc, Cary, NC).
Results
There were 3308 patients with documented ischemic stroke seen during the study period, of whom 3283 had at least 1 scale completed and were included in the study cohort. Mean age was 63.5 (standard deviation 14.4) years; the majority were white (75.6%), and 20.8% were black. The median number of days since stroke and first visit was 58 (interquartile range 32‐258). Median mRS=2, indicating mild disability, and 74.8% had mRS 0 to 2 (data not shown).
Additional Information Gained From Patient‐Reported Outcome Measures
The clinician‐reported NIHSS and mRS scales had the highest percentage of scores at the ceiling, the best possible score, on the first visit: 52.9% with NIHSS score of 0% and 20.9% with mRS score of 0 (Table 1). PROMIS PF and fatigue scales had the lowest ceiling effect with 1.3% scoring at the ceiling on both. In the subgroup of patients with normal mRS (ceiling: score=0) at first visit, there was a distribution of scores for all PROMs with ranges that exceeded the threshold for meaningful change for each scale (Figure 1).
Table 1.
Patient‐Reported Outcome Measure Scores and Change Over Time, n=3283
| Outcome Measure | Score at First Visit, Median (q1, q3) | Percentage at Ceiling at First Visita | Number of Patients With a Follow‐Up Score | Percentage With Improvementb | Percentage With Worseningb |
|---|---|---|---|---|---|
| Clinician‐reported | |||||
| Modified Rankin Scalec | 2 (1, 3) | 20.9% | 1166 | 30.8% | 20.2% |
| NIHSSc | 0 (0, 2) | 52.9% | 1116 | 13.3% | 5.6% |
| Patient‐reported | |||||
| Stroke Impact Scale 16 | 85.9 (64.1, 96.9) | 15.4% | 545 | 19.8% | 15.6% |
| PROMIS Physical Function | 40.9 (33.1, 48.8) | 1.3% | 739 | 24.2% | 16.1% |
| PHQ‐9c | 4 (1, 9) | 14.0% | 645 | 12.9% | 10.2% |
| EQ‐5D Index | 0.79 (0.68, 0.84) | 17.2% | 771 | 23.7% | 17.3% |
| PROMIS Fatiguec | 52.2 (46.3, 60.3) | 1.3% | 720 | 24.7% | 22.6% |
EQ‐5D indicates EuroQol 5 Dimensions; NIHSS, National Institutes of Health Stroke Scale; PHQ‐9, Patient Health Questionnaire 9; Patient‐Reported Outcome Measure PROMIS, Patient‐Reported Outcomes Measurement Information System; q1, first quartile; q3, third quartile.
Percentage at ceiling, defined as percentage of patients with the best possible score.
Improvement or worsening is defined as a meaningful threshold change in Rankin ≥1, NIHSS ≥2, SIS‐16 ≥9, PROMIS physical function ≥5, PHQ‐9 ≥5, EQ‐5D ≥0.11, PROMIS fatigue ≥5.
Higher scores indicate worse symptoms or function.
Figure 1.
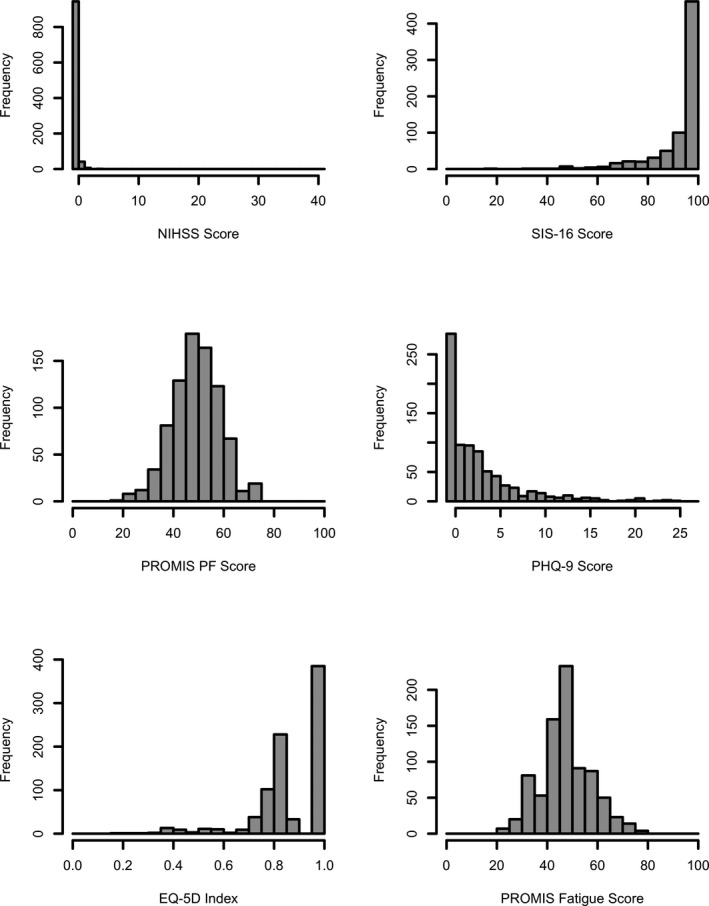
Frequency distribution of scale scores in patients with normal modified Rankin Score (mRS=0) at first visit. EQ‐5D indicates EuroQol 5 Dimensions; mRS, modified Rankin Scale; NIHSS, National Institutes of Health Stroke Scale; PF, physical function; PHQ‐9, Patient Health Questionnaire 9; PROMIS, Patient‐Reported Outcomes Measurement Information System; SIS‐16, Stroke Impact Scale 16. For the NIHSS, PHQ‐9, and PROMIS fatigue scales, higher scores indicated worse symptoms or function.
Correlations between mRS and PROMs was highest for SIS‐16 (r=−0.64, P<0.01), followed by PROMIS PF (r=−0.60, P<0.01) and EQ‐5D (r=−0.53, P<0.01) (Table 2). Correlations are negative because higher mRS scores indicate worse health. After adjustment for mRS, age, and NIHSS, the highest r2 was with SIS‐16 (r2=0.56), indicating that almost half of the variation in SIS‐16 scores was not explained by the mRS score, age, or NIHSS. The r2 for the other PROMs ranged from 0.11 for PROMIS fatigue to 0.42 for PROMIS PF, suggesting that much of the information obtained from the PROMs evaluated in this study was not captured by the mRS.
Table 2.
Correlation Among Outcome Measures and the Proportion of Variation in Health Status Explained by the mRS, n=3283
| SIS‐16 | PROMIS Physical Function | PHQ‐9a | EQ‐5D Index | PROMIS Fatiguea | ||||||
|---|---|---|---|---|---|---|---|---|---|---|
| r | r2 | r | r2 | r | r2 | r | r2 | r | r2 | |
| mRSa | −0.64 | 0.56 | −0.60 | 0.42 | 0.37 | 0.15 | −0.53 | 0.35 | 0.32 | 0.11 |
| SIS‐16 | ··· | ··· | 0.90 | 0.71 | −0.58 | 0.33 | 0.78 | 0.61 | −0.58 | 0.31 |
| PROMIS physical function | ··· | ··· | −0.55 | 0.32 | 0.72 | 0.51 | −0.59 | 0.37 | ||
| PHQ‐9a | ··· | ··· | −0.63 | 0.49 | 0.76 | 0.54 | ||||
| EQ‐5D Index | ··· | ··· | −0.57 | 0.29 | ||||||
r, Spearman correlation coefficient, all P<0.001; r2=calculated from linear regression models for each scale; explanatory variables for each model included modified Rankin Scale score, National Institutes of Health Stroke Scale score, and age. EQ‐5D indicates EuroQol 5 Dimensions; mRS, modified Rankin Scale; NIHSS, National Institutes of Health Stroke Scale; PHQ‐9, Patient Health Questionnaire 9; PROMIS, Patient‐Reported Outcomes Measurement Information System; SIS‐16, Stroke Impact Scale 16.
Higher scores indicate worse symptoms or function.
Identification of Change
There were 1437 patients with 2 or more visits with a median time between visits of 196 days (interquartile range 84‐406 days). Change in scores at or above the threshold for meaningful change ranged from 5.6% for NIHSS to 30.8% in the mRS (Table 1). This finding was contrary to our hypothesis that change would be seen more frequently in PROMs than the mRS. Changes seen in mRS occurred between scores 0 and 1 in 28.2% of cases (data not shown). Improvement in scores occurred more frequently than worsening in all scales. Concordant worsening or improvement with mRS was higher with SIS‐16 (45.7%) than with other PROMs (Figure 2). Although mRS showed statistically significant agreement with all PROMs, κ scores showed poor to slight agreement (from 0.11 with PROMIS fatigue to 0.30 in SIS‐16, data not shown). Meaningful change in NIHSS had poor agreement with all PROMs, with κ coefficients ranging from 0.05 for EQ‐5D to 0.31 for PROMIS PF.
Figure 2.
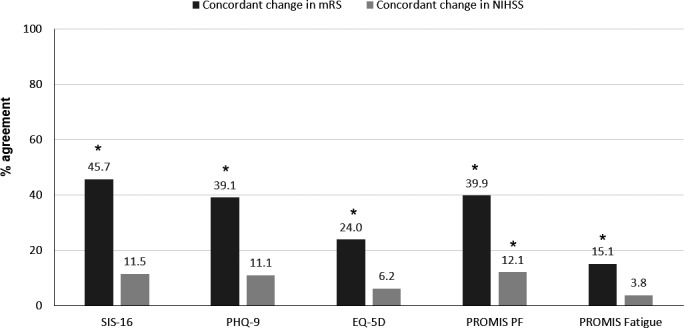
Concordance of change in patient‐reported outcome measures with change in clinician‐reported measures over time, n=1437. EQ‐5D indicates EuroQol 5 Dimensions; mRS, modified Rankin Scale; NIHSS, National Institutes of Health Stroke Scale; PF, physical function; PHQ‐9, Patient Health Questionnaire 9; PROMIS, Patient‐Reported Outcomes Measurement Information System; SIS‐16, Stroke Impact Scale 16. Presence of change determined using predefined thresholds for meaningful change. Clinician‐reported scales include: NIHSS and mRS. Patient‐reported outcome measures include: SIS‐16, PHQ‐9, EQ‐5D Index, PROMIS PF, or PROMIS fatigue. Concordant change defined as worsening in the clinician‐reported scale (NIHSS or mRS) when the patient‐reported outcome measure worsened, or improvement in the clinician‐reported scale when the patient‐reported outcome measure improved. Agreement was assessed using κ statistic. *Significant agreement at P<0.05.
Additional Analysis for the PROM That Had Highest Correlation With mRS
Because the SIS‐16 had the highest correlation with mRS and the greatest amount of variation explained by the mRS, it was the focus of additional analyses. Within each level of mRS, there was a distribution of SIS‐16 scores that had ranges ≥9, the threshold for meaningful difference in the SIS‐16 (Figure 3).
Figure 3.
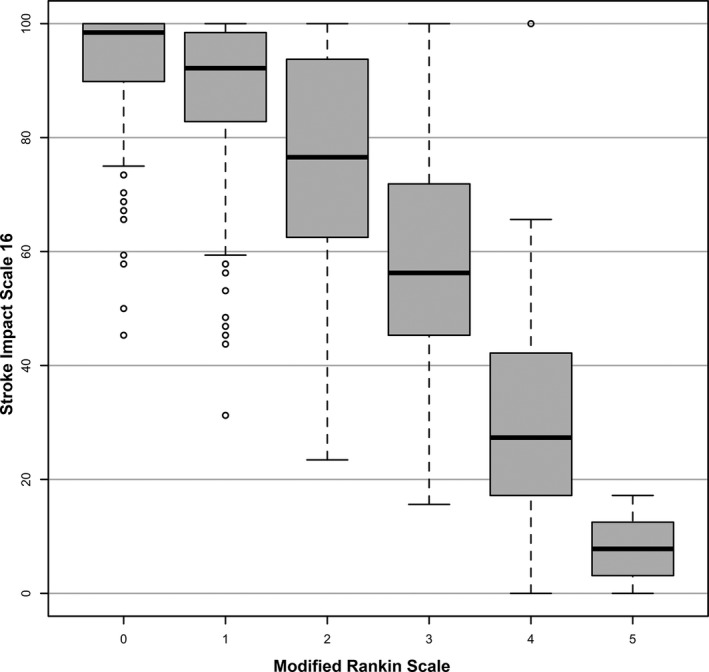
Distribution of Stroke Impact Scale 16 across modified Rankin Scale scores at first visit. The thick bar represents the median for each Rankin level. The ends of the boxes represent the first and third quartiles. The short lines at the end of the dashed lines represent “fences”—values that are 1.5 times the interquartile range from each quartile or the min/max if inside 1.5 interquartile range. The small open circles represent outliers (more than 1.5 times the interquartile range from a quartile). Higher Rankin Scores indicate worse disability.
If the changes in SIS‐16 and mRS represent true changes in patient condition, we would expect them to have discriminant ability to detect meaningful changes in the other outcome measures. Meaningful improvements in mRS and SIS‐16 were predictive of improvements in NIHSS as evidenced by a c‐statistic of 0.74 (95% CI 0.67‐0.82) and 0.77 (95% CI 0.68‐0.85), respectively (Table 3). Although c‐statistics were lower for the other measures, they were significantly higher for improvements in PROMIS PF and fatigue with SIS‐16 as compared with mRS. Results were similar for ability to discriminate between worsening scores.
Table 3.
Discriminant Ability of mRS and SIS‐16 to Detect Meaningful Improvement and Worsening in Outcomes Over Time, n=1437
| Improved in Outcome | Worsened in Outcome | |||||
|---|---|---|---|---|---|---|
| mRS C‐Statistic (95%CI) | SIS‐16 C‐Statistic (95%CI) | P Value | mRS C‐Statistic (95%CI) | SIS‐16 C‐Statistic (95%CI) | P Value | |
| NIHSS | 0.74 (0.67, 0.82) | 0.77 (0.68, 0.85) | 0.49 | 0.80 (0.67, 0.93) | 0.74 (0.58, 0.90) | 0.31 |
| PROMIS physical function | 0.52 (0.45, 0.58) | 0.57 (0.51, 0.63) | 0.04 | 0.51 (0.44, 0.59) | 0.60 (0.52, 0.68) | 0.02 |
| PHQ‐9 | 0.56 (0.48, 0.65) | 0.54 (0.45, 0.63) | 0.50 | 0.56 (0.48, 0.65) | 0.54 (0.45, 0.63) | 0.50 |
| EQ‐5D Index | 0.51 (0.45, 0.58) | 0.55 (0.49, 0.62) | 0.13 | 0.51 (0.45, 0.58) | 0.55 (0.49, 0.62) | 0.12 |
| PROMIS fatigue | 0.52 (0.45, 0.59) | 0.59 (0.53, 0.66) | 0.01 | 0.50 (0.44, 0.57) | 0.58 (0.52, 0.65) | <0.01 |
Computed using the DeLong method, and P‐values were computed using bootstrapping with 2000 iterations. EQ‐5D, EuroQol 5 Dimensions; mRS, modified Rankin Scale; NIHSS, National Institutes of Health Stroke Scale; PHQ‐9, Patient Health Questionnaire 9; PROMIS, Patient‐Reported Outcomes Measurement Information System; SIS‐16, Stroke Impact Scale 16.
In a sensitivity analysis, both clinician‐ and patient‐reported outcomes demonstrated significant discrimination among marital status, income status, and hypertension (Table 4). SIS‐16 and PROMIS PF showed the highest level of responsiveness and were able to differentiate among all patient characteristics.
Table 4.
Discriminate Ability of PROMs to Differentiate Patient Populations at First Visit, n=3283
| Total | mRSa | NIHSSa | SIS‐16 | PROMIS PF | PHQ‐9a | EQ‐5D | PROMIS Fatiguea | ||||||||
|---|---|---|---|---|---|---|---|---|---|---|---|---|---|---|---|
| % | Median (q1, q3) | P Value | Median (q1, q3) | P Value | Median (q1, q3) | P Value | Median (q1, q3) | P Value | Median (q1, q3) | P Value | Median (q1, q3) | P Value | Median (q1, q3) | P Value | |
| Sex | <0.01 | 0.08 | <0.01 | <0.01 | <0.01 | <0.01 | <0.01 | ||||||||
| Male | 54% | 1 (1, 2) | 0 (0, 2) | 89 (68, 98) | 42 (34, 50) | 4 (1, 8) | 0.81 (0.69, 0.86) | 50 (46, 59) | |||||||
| Female | 46% | 2 (1, 3) | 0 (0, 2) | 81 (56, 95) | 40 (32, 47) | 5 (2, 10) | 0.78 (0.60, 0.84) | 54 (49, 62) | |||||||
| Age, y | <0.01 | 0.27 | <0.01 | <0.01 | <0.01 | 0.39 | <0.01 | ||||||||
| <65 | 51% | 1 (1, 2) | 0 (0, 2) | 88 (66, 98) | 42 (34, 50) | 5 (1, 10) | 0.79 (0.60, 0.84) | 53 (46, 61) | |||||||
| 65+ | 49% | 2 (1, 3) | 0 (0, 2) | 84 (61, 95) | 40 (31, 47) | 4 (1, 8) | 0.80 (0.69, 0.85) | 51 (46, 59) | |||||||
| Race | <0.01 | <0.01 | <0.01 | <0.01 | <0.01 | <0.01 | 0.09 | ||||||||
| White | 76% | 1 (1, 2) | 0 (0, 2) | 88 (67, 97) | 42 (33, 49) | 4 (1, 8) | 0.80 (0.69, 0.85) | 52 (46, 60) | |||||||
| Black | 21% | 2 (1, 3) | 1 (0, 3) | 73 (50, 92) | 39 (30, 47) | 5 (2, 11) | 0.73 (0.52, 0.83) | 54 (47, 61) | |||||||
| Other | 3% | 1 (0, 3) | 0 (0, 2) | 83 (61, 97) | 40 (31, 51) | 5 (1, 9) | 0.78 (0.60, 1.00) | 50 (43, 60) | |||||||
| Marital status | <0.01 | <0.01 | <0.01 | <0.01 | <0.01 | <0.01 | <0.01 | ||||||||
| Married | 60% | 1 (1, 2) | 0 (0, 2) | 88 (67, 98) | 42 (34, 50) | 4 (1, 8) | 0.81 (0.71, 0.86) | 51 (46, 60) | |||||||
| Not Married | 40% | 2 (1, 3) | 1 (0, 2) | 81 (56, 95) | 40 (32, 47) | 5 (2, 10) | 0.78 (0.60, 0.84) | 53 (47, 62) | |||||||
| Income | <0.01 | <0.01 | <0.01 | <0.01 | <0.01 | <0.01 | <0.01 | ||||||||
| Bottom 25% | ··· | 2 (1, 3) | 1 (0, 2) | 78 (53, 94) | 39 (31, 47) | 5 (2, 9) | 0.78 (0.60, 0.83) | 53 (47, 62) | |||||||
| Top 25% | 1 (1, 2) | 0 (0, 2) | 91 (69, 98) | 42 (34, 50) | 3 (1, 7) | 0.81 (0.71, 0.86) | 51 (46, 59) | ||||||||
| Hypertension | <0.01 | <0.01 | <0.01 | <0.01 | <0.01 | <0.01 | 0.01 | ||||||||
| Yes | 63% | 2 (1, 3) | 0 (0, 2) | 83 (61, 95) | 40 (32, 47) | 5 (1, 9) | 0.78 (0.60, 0.84) | 53 (47, 61) | |||||||
| No | 37% | 1 (1, 2) | 0 (0, 1) | 91 (70, 99) | 43 (34, 51) | 4 (1, 9) | 0.81 (0.71, 0.86) | 51 (46, 60) | |||||||
| CAD | 0.79 | 0.29 | <0.01 | <0.01 | 0.53 | 0.19 | 0.33 | ||||||||
| Yes | 19% | 2 (1, 3) | 0 (0, 2) | 81 (63, 94) | 39 (31, 45) | 5 (2, 8) | 0.78 (0.68, 0.84) | 53 (48, 60) | |||||||
| No | 81% | 1 (1, 2) | 0 (0, 2) | 88 (64, 97) | 42 (33, 50) | 4 (1, 9) | 0.80 (0.69, 0.85) | 52 (46, 60) | |||||||
P‐values from Mann‐Whitney U test compare column PROM across demographic and health subgroups. CAD indicates coronary artery disease; EQ‐5D, EuroQol 5 Dimensions; mRS, modified Rankin Scale; NIHSS, National Institutes of Health Stroke Scale; PF, physical function; PHQ‐9, Patient Health Questionnaire 9; PROMIS, Patient‐Reported Outcomes Measurement Information System; SIS‐16, Stroke Impact Scale 16.
Higher scores indicate worse symptoms or function.
Discussion
This study demonstrated that PROMs provide additional information outside the traditional clinician‐reported measures (NIHSS and mRS). The NIHSS, a measure of impairment, had the highest ceiling effect, with 53% having a normal score (NIHSS=0). It demonstrated the lowest percentage of either improvement or worsening of any of the scores evaluated. Our findings corroborate those of others that suggest that the NIHSS is not an optimal measure to assess outcomes after stroke.27
The mRS had the second highest percentage of scores at the ceiling (21% at mRS=0). Among patients with normal mRS, a significant proportion of patients had abnormal scores on the PROMs. Although one would not expect perfect correlation between mRS and the PROMs, the modest r2 in regression models indicate that much of the information obtained with PROMs are not captured with the mRS. Concordance of meaningful change in PROMs with meaningful change in the clinician‐reported measures was low, ranging from 15.1% to 45.7% for mRS and 3.8% to 12.1% for NIHSS. One contributing factor to these findings is that mRS and other scales measure different constructs and span different categories within the ICF framework of health and disability. Another potential explanation for the poor concordance of changes in mRS with other scales is that these mRS changes reflect differences in the provider scoring rather than true change in patient status. A quarter of the changes in mRS occurred between score of 0 (no symptoms) and 1 (symptoms but no disability) and there can be substantial interobserver variability in mRS scoring, especially between scores 1 and 4.28
The SIS‐16 was the focus of additional analysis with mRS; because it had the highest correlation and concordance for change with mRS compared with the other PROMs, differences are likely to be smaller between mRS and SIS‐16 than with the other scales. Within each level of mRS, SIS‐16 showed ranges of values that exceeded the threshold for meaningful change, suggesting it may be better able to discriminate a patient's health state than the mRS. Indeed, when discriminant ability was assessed, SIS‐16 had a significantly higher c‐statistic for predicting health state changes in PROMIS PF and fatigue as compared with mRS. Because the mRS has only 6 levels, the ability to detect meaningful change and differences in outcomes among treatment groups is limited. The mRS had the highest proportion of “meaningful” change according to predefined threshold than other scales, but these changes in mRS may not reflect true changes in health status, especially from the patient's perspective. Additionally, SIS‐16 and PROMIS PF were more responsive to differences in patient characteristics than the clinician‐reported measures.
Although mRS is one of the most commonly used outcome measures in ischemic stroke, it has several limitations that reduce its utility as a sole measure for the assessment and monitoring of health status of patients with stroke. Importantly, in addition to the limited number of disability levels and poor interobserver reliability reported in other studies, it does not comprehensively cover domains of health that are frequently impacted by ischemic stroke, such as fatigue and depression, as demonstrated in this analysis. Because domains of recovery are not interchangeable, describing recovery in more than 1 dimension has been advocated.4, 29 The primary goal of most medical therapies is to improve symptoms, functional status, or health‐related quality of life, and these can only be accurately quantified through patient self‐report.30 Because of this, the American Heart Association has advocated for broader use of PROMs in both clinical practice and research.30 With the increasing functionality of electronic health records to collect patient‐entered data, the ability to assess patient‐reported health status is now possible.
There are also limitations when PROMs are used in clinical care or research. Severely impaired patients may not be able to complete PROMs. Although proxies can be used, some domains may be more difficult for proxies to assess, such as those involving psychosocial domains of health.31 In addition, patient‐reported scores may be impacted by a patient's mental outlook or factors outside of clinician's control, such as social support or physical environment. Even so, knowledge of health status from the patient's perspective allows more informed treatment decisions and can improve patient‐provider communication and recognition of problems.32
This study evaluated several common PROMs used in patients with stroke. There are other PROMs developed specifically for patients with stroke such as the 49‐item Stroke Specific Quality of Life scale33 and the 59‐item Stroke Impact Scale.34 In addition to PROMIS physical function and fatigue used in this study, several other PROMIS scales and the closely related Quality of Life in Neurological Disorders (NeuroQoL) scales have shown excellent potential for use in stroke.35, 36 Recently, the International Consortium for Health Outcomes Measurement (ICHOM), a nonprofit organization that develops standard sets of outcomes and risk factors for medical conditions, published a recommended standard set of stroke outcome measures comprised of the PROMIS Global Health (GH) Short Form and mRS.37 The PROMIS GH Short Form was developed using same psychometric methods as the other PROMIS scales. It is comprised of 10 global items that each represent a different domain of health and is used to calculate mental health and physical health summary scores.38 The PROMIS GH has not yet been evaluated in the stroke population.
Strengths of this study included its large size, inclusion of several commonly used PROMs, and measurement over time. Importantly, this study involved data collected as part of clinical practice rather than in a research setting, which is more directly relevant to “real‐world care.” A limitation of this study is that the mRS was the only clinician‐reported scale assessed. However, this is 1 of the most common outcome measures in stroke, and other less frequently used clinician‐reported scales have the same inability to evaluate aspects of health that can only be obtained directly from patients. Another limitation to this study is that not all patients had follow‐up scores. In addition, definitions of meaningful change were not specifically determined for the study cohort. There have been few formal evaluations of definitions for meaningful change of stroke scales,39 and there is little evidence associating meaningful change of these measures with occurrence of adverse clinical outcomes. Finally, our population had relatively mild impairment, which limits extrapolation of our findings to a population of patients with more severe disability. In our study cohort, 74.8% of patients had mRS 0 to 2. The disability of our population is similar to those of epidemiologic studies, which found that 65.3% of patients alive at 6 months had mRS 0 to 2.40 With the recent revision of the definition of transient ischemic attack,41 patients who were previously categorized as transient ischemic attacks are now categorized as having ischemic stroke if an infarct is seen on imaging,42 which has likely further increased the percentage of ischemic stroke patients with mild disability.
In summary, PROMs provide additional information compared to the mRS alone in ischemic stroke patients in the ambulatory setting and may be a useful adjunct for the assessment of health status in clinical practice. Further research on the integration of PROMs in clinical practice will enhance their utility in clinical care.
Disclosures
None.
(J Am Heart Assoc. 2017;6:e005356 DOI: 10.1161/JAHA.116.005356.)28733434
References
- 1. Toschke AM, Tilling K, Cox AM, Rudd AG, Heuschmann PU, Wolfe CD. Patient‐specific recovery patterns over time measured by dependence in activities of daily living after stroke and post‐stroke care: the South London Stroke Register (SLSR). Eur J Neurol. 2010;17:219–225. [DOI] [PubMed] [Google Scholar]
- 2. Katzan IL, Spertus J, Bettger JP, Bravata DM, Reeves MJ, Smith EE, Bushnell C, Higashida RT, Hinchey JA, Holloway RG, Howard G, King RB, Krumholz HM, Lutz BJ, Yeh RW. Risk adjustment of ischemic stroke outcomes for comparing hospital performance: a statement for healthcare professionals from the American Heart Association/American Stroke Association. Stroke. 2014;45:918–944. [DOI] [PubMed] [Google Scholar]
- 3. Ali M, Fulton R, Quinn T, Brady M; VISTA Collaboration . How well do standard stroke outcome measures reflect quality of life? A retrospective analysis of clinical trial data. Stroke. 2013;44:3161–3165. [DOI] [PubMed] [Google Scholar]
- 4. Quinn TJ, Dawson J, Walters MR, Lees KR. Functional outcome measures in contemporary stroke trials. Int J Stroke. 2009;4:200–205. [DOI] [PubMed] [Google Scholar]
- 5. Kostanjsek N. Use of The International Classification of Functioning, Disability and Health (ICF) as a conceptual framework and common language for disability statistics and health information systems. BMC Public Health. 2011;11(suppl 4):S3. [DOI] [PMC free article] [PubMed] [Google Scholar]
- 6. Katzan I, Speck M, Dopler C, Urchek J, Bielawski K, Dunphy C, Jehi L, Bae C, Parchman A. The Knowledge Program: an innovative, comprehensive electronic data capture system and warehouse. AMIA Annu Symp Proc. 2011;2011:683–692. [PMC free article] [PubMed] [Google Scholar]
- 7. Duncan PW, Lai SM, Bode RK, Perera S, DeRosa J. Stroke Impact Scale‐16: a brief assessment of physical function. Neurology. 2003;60:291–296. [DOI] [PubMed] [Google Scholar]
- 8. Moriello C, Byrne K, Cieza A, Nash C, Stolee P, Mayo N. Mapping the Stroke Impact Scale (SIS‐16) to the International Classification of Functioning, Disability and Health. J Rehabil Med. 2008;40:102–106. [DOI] [PubMed] [Google Scholar]
- 9. Shaw JW, Johnson JA, Coons SJ. US valuation of the EQ‐5D health states: development and testing of the D1 valuation model. Med Care. 2005;43:203–220. [DOI] [PubMed] [Google Scholar]
- 10. Salter K, Campbell N, Richardson M, Mehta SN, Jutai J, Zettler L, Moses M, McClure A, Mays R, Foley N, Teasell R. Outcome measures in stroke rehabilitation. Evidence‐Based Review of Stroke Rehabilitation 2013. Available at: http://www.ebrsr.com/sites/default/files/Chapter%2020_Outcome%20Measures.pdf. Accessed February 20, 2017.
- 11. Kroenke K, Spitzer RL, Williams JB. The PHQ‐9: validity of a brief depression severity measure. J Gen Intern Med. 2001;16:606–613. [DOI] [PMC free article] [PubMed] [Google Scholar]
- 12. PROMIS Network . PROMIS—dynamic tools to measure health outcomes from the patient perspective. Available at: www.nihpromis.org. Accessed June 29, 2016.
- 13. Rose M, Bjorner JB, Becker J, Fries JF, Ware JE. Evaluation of a preliminary physical function item bank supported the expected advantages of the Patient‐Reported Outcomes Measurement Information System (PROMIS). J Clin Epidemiol. 2008;61:17–33. [DOI] [PubMed] [Google Scholar]
- 14. Tucker CA, Escorpizo R, Cieza A, Lai JS, Stucki G, Ustun TB, Kostanjsek N, Cella D, Forrest CB. Mapping the content of the Patient‐Reported Outcomes Measurement Information System (PROMIS®) using the International Classification of Functioning, Health and Disability. Qual Life Res. 2014;23:2431–2438. [DOI] [PMC free article] [PubMed] [Google Scholar]
- 15. Brott T, Adams HP Jr, Olinger CP, Marler JR, Barsan WG, Biller J, Spilker J, Holleran R, Eberle R, Hertzberg V, Rorick M, Moomaw CJ, Walker W. Measurements of acute cerebral infarction: a clinical examination scale. Stroke. 1989;20:864–870. [DOI] [PubMed] [Google Scholar]
- 16. van Swieten JC, Koudstaal PJ, Visser MC, Schouten HJ, van Gijn J. Interobserver agreement for the assessment of handicap in stroke patients. Stroke. 1988;19:604–607. [DOI] [PubMed] [Google Scholar]
- 17. Quinn TJ, Lees KR, Hardemark HG, Dawson J, Walters MR. Initial experience of a digital training resource for modified Rankin scale assessment in clinical trials. Stroke. 2007;38:2257–2261. [DOI] [PubMed] [Google Scholar]
- 18. Quinn TJ, Dawson J, Walters MR, Lees KR. Variability in modified Rankin scoring across a large cohort of international observers. Stroke. 2008;39:2975–2979. [DOI] [PubMed] [Google Scholar]
- 19. Kasner SE. Clinical interpretation and use of stroke scales. Lancet Neurol. 2006;5:603–612. [DOI] [PubMed] [Google Scholar]
- 20. Weimar C, Kurth T, Kraywinkel K, Wagner M, Busse O, Haberl RL, Diener HC; German Stroke Data Bank Collaborators . Assessment of functioning and disability after ischemic stroke. Stroke. 2002;33:2053–2059. [DOI] [PubMed] [Google Scholar]
- 21. Norman GR, Sloan JA, Wyrwich KW. The truly remarkable universality of half a standard deviation: confirmation through another look. Expert Rev Pharmacoecon Outcomes Res. 2004;4:581–585. [DOI] [PubMed] [Google Scholar]
- 22. Revicki DA, Cella D, Hays RD, Sloan JA, Lenderking WR, Aaronson NK. Responsiveness and minimal important differences for patient reported outcomes. Health Qual Life Outcomes. 2006;4:70. [DOI] [PMC free article] [PubMed] [Google Scholar]
- 23. McMillan D, Gilbody S, Richards D. Defining successful treatment outcome in depression using the PHQ‐9: a comparison of methods. J Affect Disord. 2010;127:122–129. [DOI] [PubMed] [Google Scholar]
- 24. Fulk GD, Ludwig M, Dunning K, Golden S, Boyne P, West T. How much change in the stroke impact scale‐16 is important to people who have experienced a stroke? Top Stroke Rehabil. 2010;17:477–483. [DOI] [PubMed] [Google Scholar]
- 25. DeLong ER, DeLong DM, Clarke‐Pearson DL. Comparing the areas under two or more correlated receiver operating characteristic curves: a nonparametric approach. Biometrics. 1988;44:837–845. [PubMed] [Google Scholar]
- 26. R: A Language and Environment for Statistical Computing. Vienna, Austria: R Foundation for Statistical Computing ; 2015. Available at: www.R-project.org [computer program]. Accessed January 10, 2017. [Google Scholar]
- 27. Lees KR, Bath PM, Schellinger PD, Kerr DM, Fulton R, Hacke W, Matchar D, Sehra R, Toni D; European Stroke Organization Outcomes Working Group . Contemporary outcome measures in acute stroke research: choice of primary outcome measure. Stroke. 2012;43:1163–1170. [DOI] [PubMed] [Google Scholar]
- 28. Quinn TJ, Dawson J, Walters MR, Lees KR. Exploring the reliability of the modified Rankin scale. Stroke. 2009;40:762–766. [DOI] [PubMed] [Google Scholar]
- 29. Vanhook P. The domains of stroke recovery: a synopsis of the literature. J Neurosci Nurs. 2009;41:6–17. [DOI] [PubMed] [Google Scholar]
- 30. Rumsfeld JS, Alexander KP, Goff DC Jr, Graham MM, Ho PM, Masoudi FA, Moser DK, Roger VL, Slaughter MS, Smolderen KG, Spertus JA, Sullivan MD, Treat‐Jacobson D, Zerwic JJ. Cardiovascular health: the importance of measuring patient‐reported health status: a scientific statement from the American Heart Association. Circulation. 2013;127:2233–2249. [DOI] [PubMed] [Google Scholar]
- 31. Carod‐Artal FJ, Ferreira Coral L, Stieven Trizotto D, Menezes Moreira C. Self‐ and proxy‐report agreement on the Stroke Impact Scale. Stroke. 2009;40:3308–3314. [DOI] [PubMed] [Google Scholar]
- 32. Frost MH, Bonomi AE, Cappelleri JC, Schunemann HJ, Moynihan TJ, Aaronson NK; Clinical Significance Consensus Meeting Group . Applying quality‐of‐life data formally and systematically into clinical practice. Mayo Clin Proc. 2007;82:1214–1228. [DOI] [PubMed] [Google Scholar]
- 33. Williams LS, Weinberger M, Harris LE, Clark DO, Biller J. Development of a stroke‐specific quality of life scale. Stroke. 1999;30:1362–1369. [DOI] [PubMed] [Google Scholar]
- 34. Duncan PW, Bode RK, Min Lai S, Perera S. Rasch analysis of a new stroke‐specific outcome scale: the Stroke Impact Scale. Arch Phys Med Rehabil. 2003;84:950–963. [DOI] [PubMed] [Google Scholar]
- 35. Katzan IL, Thompson N, Uchino K. Innovations in stroke—the use of PROMIS and NeuroQoL scales in clinical stroke rials. Stroke. 2016;47:e27–e30. [DOI] [PubMed] [Google Scholar]
- 36. Sangha RS, Caprio FZ, Askew R, Corado C, Bernstein R, Curran Y, Ruff I, Cella D, Naidech AM, Prabhakaran S. Quality of life in patients with TIA and minor ischemic stroke. Neurology. 2015;85:1957–1963. [DOI] [PMC free article] [PubMed] [Google Scholar]
- 37. Salinas J, Sprinkhuizen SM, Ackerson T, Bernhardt J, Davie C, George MG, Gething S, Kelly AG, Lindsay P, Liu L, Martins SC, Morgan L, Norrving B, Ribbers GM, Silver FL, Smith EE, Williams LS, Schwamm LH. An international standard set of patient‐centered outcome measures after stroke. Stroke. 2016;47:180–186. [DOI] [PMC free article] [PubMed] [Google Scholar]
- 38. Hays RD, Bjorner JB, Revicki DA, Spritzer KL, Cella D. Development of physical and mental health summary scores from the patient‐reported outcomes measurement information system (PROMIS) global items. Qual Life Res. 2009;18:873–880. [DOI] [PMC free article] [PubMed] [Google Scholar]
- 39. Bath PM, Lees KR, Schellinger PD, Altman H, Bland M, Hogg C, Howard G, Saver JL; European Stroke Organisation Outcomes Working Group . Statistical analysis of the primary outcome in acute stroke trials. Stroke. 2012;43:1171–1178. [DOI] [PubMed] [Google Scholar]
- 40. Slot KB, Berge E, Dorman P, Lewis S, Dennis M, Sandercock P. Impact of functional status at six months on long term survival in patients with ischaemic stroke: prospective cohort studies. BMJ. 2008;336:376–379. [DOI] [PMC free article] [PubMed] [Google Scholar]
- 41. Easton JD, Saver JL, Albers GW, Alberts MJ, Chaturvedi S, Feldmann E, Hatsukami TS, Higashida RT, Johnston SC, Kidwell CS, Lutsep HL, Miller E, Sacco RL. Definition and evaluation of transient ischemic attack: a scientific statement for healthcare professionals from the American Heart Association/American Stroke Association Stroke Council; Council on Cardiovascular Surgery and Anesthesia; Council on Cardiovascular Radiology and Intervention; Council on Cardiovascular Nursing; and the Interdisciplinary Council on Peripheral Vascular Disease. Stroke. 2009;40:2276–2293. [DOI] [PubMed] [Google Scholar]
- 42. Ovbiagele B, Kidwell CS, Saver JL. Epidemiological impact in the United States of a tissue‐based definition of transient ischemic attack. Stroke. 2003;34:919–924. [DOI] [PubMed] [Google Scholar]