Abstract
Background
The biphasic inflammation after ST‐segment elevation myocardial infarction (STEMI) plays an important role in myocardial healing and progression of systemic atherosclerosis. The purpose of this study is to investigate the impact of fever during the first and second phases of post‐STEMI inflammation on long‐term cardiac outcomes.
Methods and Results
A total of 550 patients with STEMI were enrolled in this study. Axillary body temperature (BT) was measured and maximum BTs were determined for the first (within 3 days: max‐BT 1–3d) and second (from 4 to 10 days after admission: max‐BT 4–10d) phases, respectively. Patients were followed for cardiac events (cardiovascular death, acute coronary syndrome, and rehospitalization for heart failure) for a median 5.3 years. During the follow‐up period, 80 patients experienced cardiac events. A high max‐BT 4–10d was strongly associated with long‐term cardiac events (hazard ratio, 95% CI) for a 1°C increase in the max‐BT 4–10d: 2.834 (2.017–3.828), P<0.0001, whereas the max‐BT 1–3d was not associated with cardiac events (1.136 [0.731–1.742], P=0.57). Even after adjustment for coronary risk factors, estimated glomerular filtration rate, infarct size, pericardial effusion, and medications on discharge, fever during the second phase (max‐BT 4–10d ≥37.1°C) was significantly associated with future cardiac events (hazard ratio [95% CI] 2.900 [1.710–5.143], P<0.0001).
Conclusions
Fever during the second phase but not the first phase of post‐STEMI inflammation was a strong associated factor with worse long‐term cardiac outcomes in patients after STEMI, suggesting the need to consider the optimal timing for anti‐inflammatory strategies after STEMI.
Keywords: fever, inflammation, prognosis, ST‐segment elevation myocardial infarction
Subject Categories: Acute Coronary Syndromes, Atherosclerosis, Coronary Artery Disease
Clinical Perspective
What Is New?
To the best of our knowledge, this is the first study that demonstrated that fever during the second phase (the active resolution of inflammation and tissue repair phase) but not the first phase (the early inflammatory and digestive phase) of post ST‐segment elevation myocardial infarction (STEMI) inflammation was a significant and independent factor associated with future cardiac events in patients after STEMI.
What Are the Clinical Implications?
Although it would be hard to elucidate causality between fever during the second phase of post‐STEMI inflammation and adverse cardiac events, our findings indicated that post‐STEMI inflammation (especially the second phase) plays a substantial role in the development of subsequent cardiac events in patients after STEMI.
Introduction
Recent experimental studies have reported that the inflammatory response after acute ST‐segment elevation myocardial infarction (STEMI) is a complex and strictly regulated process characterized by the critical involvement of leukocytes from both the innate and adaptive immune systems, which was triggered and activated by cardiomyocyte death and degradation of the cardiac extracellular matrix.1 Although inflammation is essential in the healing process of infarcted tissue, excessive inflammation might have an adverse effect on left ventricular remodeling and systemic atherosclerosis—like a double‐edged sword.
Inflammation after STEMI consists of 2 phases. The first phase occurs within 3 days after the onset of STEMI (the early inflammatory and digestive phase). The second phase occurs from 4 days to 2 weeks after the onset of STEMI (the active resolution of inflammation and tissue repair phase).2 Monocytes play a key role in inflammation after STEMI. Pro‐inflammatory CD16− monocytes dominate within 3 days after the onset of STEMI (the first phase) and promote the digestion of infarcted tissue and the removal of necrotic debris. Conversely, reparative CD16+ monocytes dominate during the resolution of inflammation (the second phase) and propagate repair.2, 3 The sequential inflammatory phases have been suggested to be important for myocardial healing after acute MI.
Dutta et al reported that a first MI could accelerate atherosclerosis by triggering a burst of acute systemic inflammation aimed at the repair of the injured heart.4 In their study, the first acute inflammatory stimuli induced by the necrotic myocardium tissue inflamed pre‐existing systemic chronic inflammation. Subsequently, the release of upstream progenitors from the bone marrow because of the activated sympathetic nerve system after MI was increased and became marked 4 days after MI. Then, the spleen hosted these cells, resulting in amplified extramedullary myelopoiesis. These pro‐inflammatory changes in atherosclerotic plaques persisted for several months. Thus, the post‐MI inflammation might influence cardiovascular outcomes in patients after STEMI, through an effect on not only myocardium but also on systemic atherosclerosis.
Fever is the most common and the simplest noninvasive measure used in inflammatory diseases. However, to date, the association between fever during the first and second inflammation phases after STEMI with long‐term cardiac outcomes has not been investigated. Therefore, in this study we aimed to elucidate the impact of fever occurring after STEMI on long‐term outcomes.
Methods
Study Design and Patients
This is an observational study performed at the Yokohama City University Medical Center in Japan. A total of 730 patients diagnosed as first STEMI and treated with primary percutaneous coronary intervention within 12 hours after symptom onset were enrolled between October 2001 and December 2009. All patients were administered double anti‐platelet therapy, including a loading dose of 200 mg of aspirin prior to the primary percutaneous coronary intervention and a maintenance dose of 100 mg of aspirin after the percutaneous coronary intervention. Patients were routinely included in the cardiac rehabilitation program during their 2‐week hospital stay, which is a common length of hospitalization for STEMI patients in Japan. The study flow chart is provided in Figure 1. The diagnostic criteria for STEMI consisted of (1) continuous chest pain lasting more than 20 minutes, (2) ST‐segment elevation ≥0.1 mV in ≥2 contiguous leads on the ECG, and (3) increased creatine kinase (>2‐fold the upper limit of the institutional reference range). The main exclusion criteria were as follows: active inflammatory or infectious diseases, known malignant diseases, current treatment with corticosteroids, coronary artery bypass grafting/left ventricular assist device/therapeutic hypothermia/tracheal intubation/intra‐aortic balloon pump within 10 days after admission, and discharge/death within 10 days after admission. Physical examinations by an attending physician, imaging examinations (ie, chest radiograph and whole‐body computed tomography), and 2 pairs of blood cultures and urine cultures were ordered to exclude infection in all patients who presented a body temperature (BT) >37°C. Nonsteroidal anti‐inflammatory drugs are prohibited for STEMI patients in our institution. The study protocol was approved by the institutional review board and was implemented in accordance with the guidelines of the ethics committee of our institution and the provisions of the Declaration of Helsinki. Written informed consent was obtained from each patient before participation.
Figure 1.
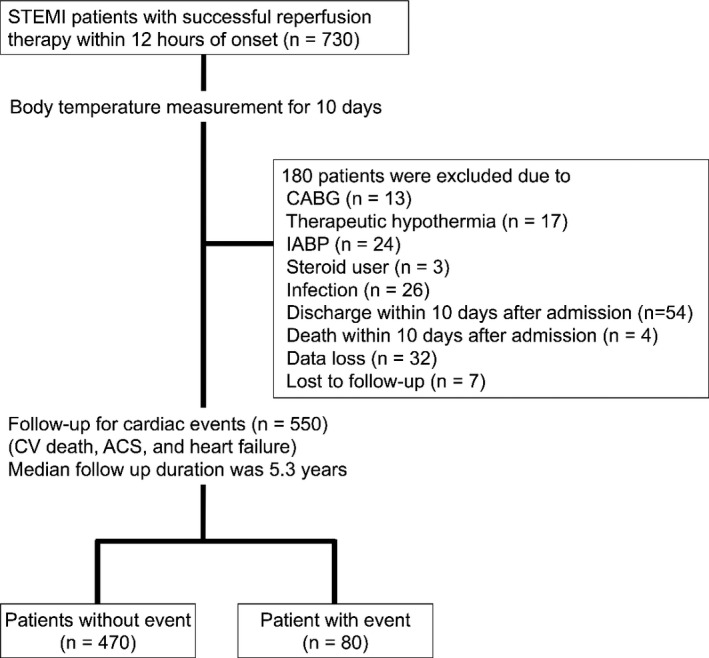
Study flow chart. ACS indicates acute coronary syndrome; CABG, coronary artery bypass grafting; CV, cardiovascular; IABP, intra‐aortic balloon pump; STEMI, ST‐segment elevation myocardial infarction.
Body Temperature
The axillary BT was measured every 6 hours on the day of admission and then every 8 hours for 10 days. As reported previously, there are 2 phases of inflammation after STEMI. The first phase occurs within 3 days after the onset of STEMI and the second phase occurs from 4 days to 2 weeks after the onset of STEMI. We investigated BT by dividing into these 2 phases. The highest BT was recorded for the entire 10‐day observation period (max‐BT1–10d), within the first 3 days after admission (max‐BT1–3d), and from the following 4 to 10 days after admission (max‐BT4–10d). The max‐BT1–3d represents the maximum fever during the first phase of inflammation after STEMI and the max‐BT4–10d represents the maximum fever during the second phase.
Blood Tests and Echocardiography
Blood samples were obtained upon admission and at 3‐hour intervals during the first 12 hours, 6‐hour intervals for the next 12 hours, 12‐hour intervals for the next 24 hours, and 24‐hour intervals for the next 24 hours. The area under the curve (AUC, in arbitrary units) of the release of serum creatine kinase within 72 hours was approximated in each patient using the trapezoid method as a surrogate marker for the infarct size. The estimated glomerular filtration rates were calculated using the prediction equation proposed by the Japanese Society of Nephrology.5 Pericardial effusion was assessed with transthoracic echocardiography, and pericardial effusion was defined as >10 mm of pericardial echo‐free space.
Follow‐Up and Cardiac Events
Cardiac event outcomes were evaluated for a median follow‐up of 5.3 years. The primary end point was the composite of death from cardiovascular causes, recurrent ischemic events (recurrent MI and unstable angina) that required coronary revascularization, and hospitalization for heart failure. Two telephone interviewers called all included patients or their families to inquire about all hospital admissions and death. The event committee consisted of 3 cardiologists who reviewed all medical records and death certificates for blinded end point classification and the assignment of incidence dates using prespecified criteria to verify the diagnosis. Cardiovascular death was defined as a death attributed to MI, congestive heart failure, or documented sudden death without apparent noncardiovascular causes. A diagnosis of MI was made by symptoms, a rise or fall in cardiac biomarkers above the 99th percentile of the upper limit of the normal range, and at least one of the following: ECG changes (new ST‐T changes, left bundle branch block, or pathological Q wave), imaging evidence of new viable myocardium loss, and new regional wall motion abnormality. A diagnosis of unstable angina pectoris was made by new or accelerating myocardial ischemia symptoms accompanied by new ischemic ST‐T‐wave changes. A diagnosis of hospitalization for heart failure decompensation was made if the patient was admitted with typical heart failure symptoms and had objective signs of a worsening disease that required intravenous drug administration.
Statistical Analysis
Statistical analyses were performed using the JMP version 12.1.0 (SAS Institute, Inc, Cary, NC) and SAS program for Windows, release 9.3 (SAS Institute Inc, Cary, NC). Descriptive statistics were used to examine the baseline characteristics of the enrolled participants. The median (interquartile range) or frequency (%) was reported for all characteristics, and variables were compared with the Wilcoxon rank‐sum test or Fisher exact test as appropriate. To assess differences in the sequential changes in BT between the event and nonevent groups, mixed‐model repeated measurements were used to account for the correlation of measurements in the same patients. Since the level of BT reached the peak at 32 hours after the admission and leveled off to 40 hours after admission, we set the BT at 32 hours after the admission as the peak for the analysis. The discriminative capacity of maximum and median BT in the first and second phase of post MI inflammation for future cardiovascular events was assessed by means of receiver operating characteristic curves and the AUCs were calculated, respectively. Optimal cut points were obtained by determining the maximum Youden index. Time‐to‐event analyses were performed using the Cox‐proportional hazards model. We used the Kaplan–Meier method to estimate the cumulative probability of the occurrence of an event and estimated the rates by dividing the number of first events. Kaplan–Meier curves were compared using the log‐rank test. A 2‐sided P value <0.05 was considered statistically significant.
Results
A total of 180 patients were excluded based on the study criteria, resulting in the inclusion of 550 patients in the present study (440 men, median age 64 years, Table 1). The median duration of follow‐up was 5.3 years (interquartile range 2.8–7.0). During the follow‐up period, 80 patients experienced cardiac events: 29 died of cardiovascular disease, 36 developed acute coronary syndrome (MI or unstable angina), and 22 developed heart failure (Figure 1).
Table 1.
Baseline Characteristics According to Prolonged Fever After the Onset of STEMI
| All Patients (N=550) | Low Max BT4–10d Group (N=271) | High Max BT4–10d Group (N=279) | P Value | |
|---|---|---|---|---|
| Median age, y | 64 (55–72) | 63 (56–73) | 64 (54–73) | 0.40 |
| Male sex, n (%) | 440 (80.0) | 230 (84.9) | 210 (75.3) | 0.006 |
| Coronary risk factors | ||||
| Hypertension, n (%) | 321 (58.4) | 159 (58.7) | 162 (58.1) | 0.93 |
| Dyslipidemia, n (%) | 336 (61.1) | 168 (62.0) | 168 (60.2) | 0.73 |
| Diabetes mellitus, n (%) | 136 (24.7) | 61 (22.5) | 75 (26.9) | 0.24 |
| Smoking, n (%) | 415 (75.5) | 222 (81.9) | 193 (69.2) | <0.001 |
| Laboratory data on admission | ||||
| Median total cholesterol, mg/dL | 206 (178–233) | 208 (183–233) | 205 (176–231) | 0.38 |
| Median HDL cholesterol, mg/dL | 44 (38–52) | 44 (38–53) | 44 (38–52) | 0.86 |
| Median LDL cholesterol, mg/dL | 134 (110–158) | 136 (112–159) | 132 (109–156) | 0.40 |
| Median triglycerides, mg/dL | 111 (59–188) | 118 (66–196) | 104 (55–179) | 0.12 |
| Median eGFR, mL/min per 1.73 m2 | 72 (59–88) | 72 (61–85) | 72 (58–88) | 0.52 |
| Reperfusion time, min | 197±138 | 187±125 | 207±150 | 0.08 |
| First TIMI 0/1, n (%) | 296 (54.4) | 141 (52.8) | 155 (56.0) | 0.46 |
| Final TIMI 3, n (%) | 483 (90.8) | 241 (92.0) | 242 (89.6) | 0.35 |
| Multivessel disease, n (%) | 169 (31.1) | 84 (31.6) | 85 (30.7) | 0.82 |
| Anterior wall MI, n (%) | 249 (45.3) | 109 (40.2) | 140 (50.2) | 0.021 |
| Median AUC‐CK, 103 IU/L×h | 64 (39–103) | 57 (34–89) | 73 (46–117) | <0.001 |
| Max, BT in first phase | 37.7±0.51 | 37.4±0.41 | 37.9±0.50 | <0.001 |
| Medication at discharge | ||||
| β‐Blocker, n (%) | 339 (62.9) | 162 (60.7) | 177 (65.1) | 0.29 |
| ACE‐I/ARB, n (%) | 466 (85.5) | 234 (87.3) | 232 (83.8) | 0.24 |
| Statin, n (%) | 354 (65.7) | 185 (69.3) | 169 (62.1) | 0.08 |
| Pericardial effusion (%) | 65 (11.8%) | 22 (8.1%) | 43 (15.4%) | 0.008 |
Low BT group was defined as patients with a max BT 4 to 10 days after admission <37.1°C, and high BT group was defined as ≥37.1°C. Data are shown as mean±SD, median (first and third quartile), or number (%). ACE‐I indicates angiotensin‐converting enzyme inhibitor; ARB, angiotensin II receptor blocker; AUC‐CK, area under the curve of creatine kinase; BT, body temperature; eGFR, estimated glomerular filtration rate; HDL, high‐density lipoprotein; LDL, low‐density lipoprotein; MI, myocardial infarction; STEMI, ST‐segment elevation myocardial infarction; TIMI, Thrombolysis In Myocardinal Infarction.
Time Course of BT After STEMI Between Patients With and Without Events
Figure 2A shows the time course of BT after admission in the event and nonevent groups. In both groups, the BT was elevated at the peak by an average of 1.6°C within 24 to 48 hours after admission. After the peak in BT, the time courses of BT were significantly different between the event and nonevent groups (P=0.039, assessed with mixed‐model repeated measurements). The recovery from fever was blunted in patients with events compared with those without events.
Figure 2.
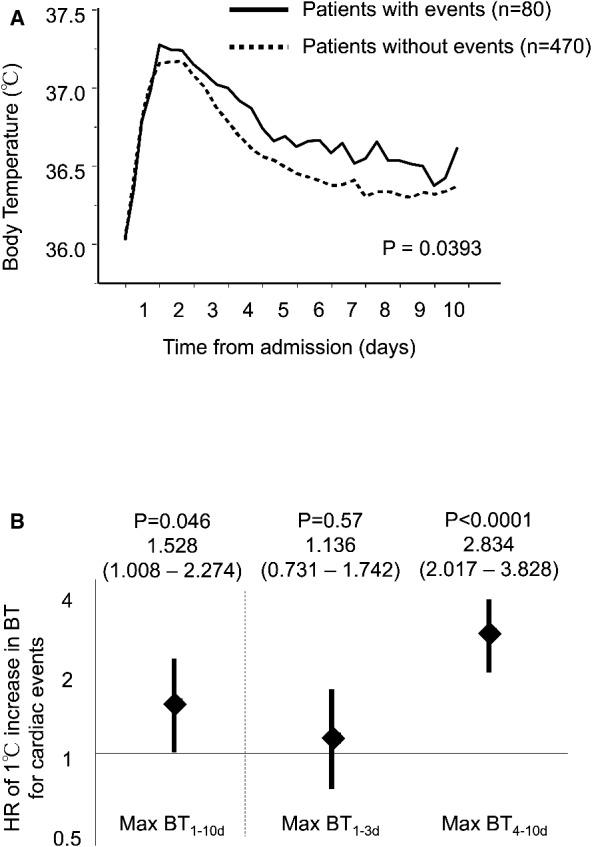
The time course of inflammation and body temperature after STEMI. A, The time course of body temperature after STEMI. Body temperature was elevated at the peak by an average of 1.6°C from 24 to 48 hours after admission. After the peak, the time course of body temperature was significantly different between patients with and without future cardiac events (P=0.0393). The recovery from fever was blunted in patients with events compared with those without. B, The impact of first‐ and second‐phase fevers on future cardiac events. The risk associated with fever during the second phase of post‐STEMI inflammation for future cardiac events was significant, but the risk associated with the first‐phase fever was not significant. BT indicates body temperature; HR, hazard ratio; STEMI, ST‐segment elevation myocardial infarction.
The discriminative power as assessed by C statistics (AUC) was 0.679 of max BT4–10d, the highest among max and median of BT1–3d and BT4–10d. The discriminative power as assessed by C statistics (AUC) was 0.679 of max BT4–10d, the highest among max and median of BT1–3d and BT4–10d (Table 2). The max‐BT1–10d was significantly associated with future cardiac events (hazard ratio [95% CI] for a 1°C increase in the max‐BT1–10d: 1.528 [1.008–2.274], P=0.046) (Figure 2B). However, when the max‐BT was separately analyzed as the max‐BT1–3d and max‐BT4–10d, the max‐BT1–3d was not significantly associated with events (hazard ratio [95% CI] for a 1°C increase in max‐BT1–3d: 1.136 [0.731–1.742], P=0.57); conversely, the max‐BT4–10d had a strong association with events (hazard ratio [95% CI] for a 1°C increase in max‐BT4–10d: 2.834 [2.017–3.828], P<0.0001).
Table 2.
Discriminative Capacity of the Analyzed Events of the Scoring System Estimated by Means of Receiver Operating Characteristic Curves
| C Statistics Value | HR (95% CI) | P Value | |
|---|---|---|---|
| Max BT1–10d | 0.571 | 0.498 to 0.643 | 0.043 |
| Median BT1–10d | 0.604 | 0.535 to 0.672 | 0.003 |
| Max BT1–3d | 0.527 | 0.454 to 0.599 | 0.443 |
| Median BT1–3d | 0.538 | 0.467 to 0.609 | 0.277 |
| Max BT4–10d | 0.679 | 0.613 to 0.745 | <0.0001 |
| Median BT4–10d | 0.593 | 0.523 to 0.664 | 0.008 |
HR indicates hazard ratio; Max BT1–3d, maximum body temperature from 1 to 3 days after admission; Max BT4–10d, maximum body temperature from 4 to 10 days after admission.
Time Course of Other Markers of Inflammation
The white blood cell counts exhibited high levels upon admission and reached their peaks within 24 hours. The monocyte counts reached their peak 48 hours after admission and then decreased. The serial change in the monocyte counts was similar to the BT time course. A rise and decrease in C‐reactive protein was 1 day behind the rise in the monocyte count and BT (Figure 3). Although blood samples were collected according to the study protocol within 72 hours, the timing of blood testing after the initial sample depended on the attending physicians. Most blood samples were obtained at 2‐ to 4‐day intervals until discharge. Thus, we could not assess the maximum values of the inflammatory markers.
Figure 3.
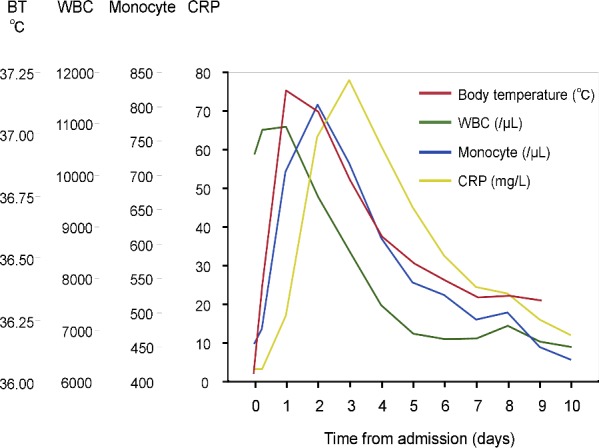
The time course of inflammatory markers after STEMI. Serial changes in the white blood cell count, monocyte count, C‐reactive protein, and body temperature are shown. BT indicates body temperature; CRP, C‐reactive protein; STEMI, ST‐segment elevation myocardial infarction; WBC, white blood cell.
Comparison Between the Low and High Max‐BT4–10d Groups
The distribution of max‐BT4–10d is shown in Figure 4. The optimal cut‐off value of max‐BT4–10d determined by the Youden index to predict future cardiac events was 37.1°C, which was equal to its median value. Females, nonsmokers, anterior wall MI, and pericardial effusion were more frequent, and the infarct size assessed by AUC‐creatine kinase was significantly larger in the high max‐BT4–10d group (Table 1).
Figure 4.
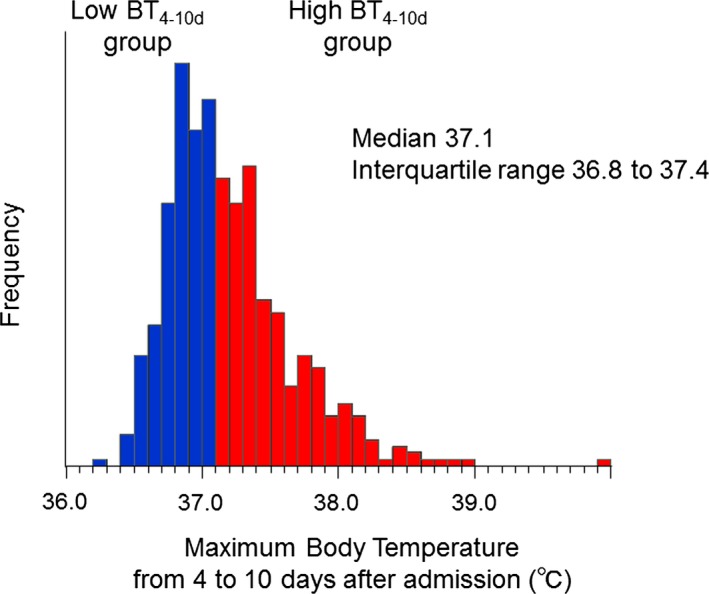
The distribution of the maximum body temperature during the second phase of post‐STEMI inflammation. A Max‐BT 4–10d of 37.1°C was the optimal cut‐off value to predict future cardiac events determined by the Youden index. The high BT 4–10d group was defined as patients with a max‐BT 4–10d ≥37.1°C. BT indicates body temperature; STEMI, ST‐segment elevation myocardial infarction.
Figure 5A depicts the nonadjusted cumulative risk of cardiac events for the high and low max‐BT4–10d groups. There was a significant difference in the incidences of cardiac events between the 2 groups (log‐rank, P<0.0001). The Kaplan–Meier curves began to separate after 3 months, and the gap consistently widened until the 7‐year follow‐up. Figure 5B through 5D shows the separate Kaplan–Meier curves of cardiovascular death, acute coronary syndrome, and heart failure. Although the log‐rank P value for heart failure was not significant, the rate of each event was higher in the high max‐BT4–10d group compared with the low max‐BT4–10d group.
Figure 5.
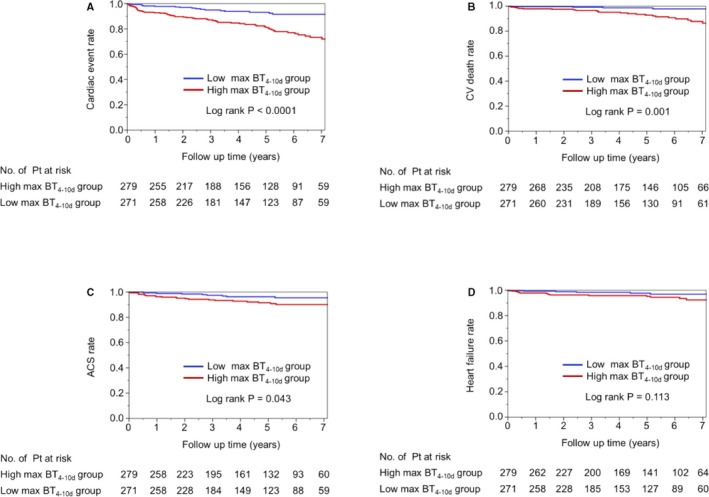
Unadjusted Kaplan–Meier estimates for cardiac events according to the second‐phase fever. Unadjusted Kaplan–Meier estimates are shown for the rate of the primary composite end point (death from cardiovascular causes, acute coronary syndrome, or heart failure) (A through D) according to the prolonged fever from 4 to 10 days after admission. ACS indicates acute coronary syndrome; BT, body temperature; CV, cardiovascular.
Figure 6A through 6D show cumulative event rates according to the cut‐off value of the max‐BT1–3d (37.9°C). Based on the Kaplan–Meier curves, a high max‐BT1–3d tended to be associated with a high rate of cardiac events. However, the cardiac event rates were similar between the low and high max‐BT1–3d groups during the entire follow‐up period.
Figure 6.
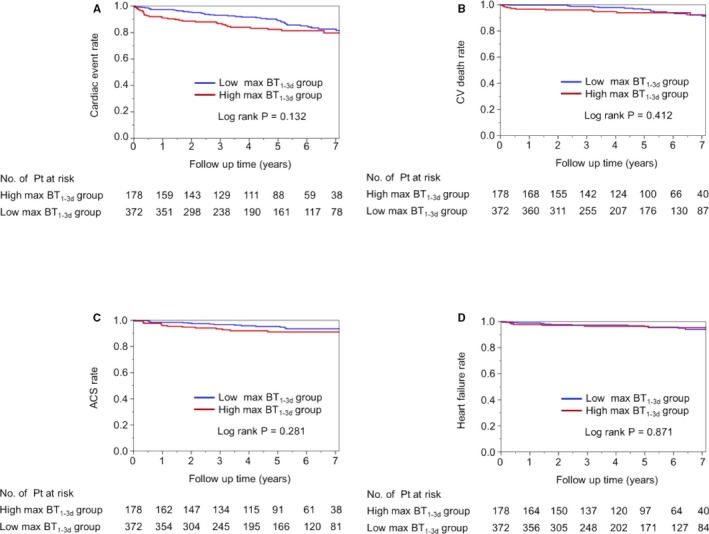
Unadjusted Kaplan–Meier estimates for cardiac events according to first‐phase fever. A max‐BT 1–3d of 37.9°C was the optimal cut‐off value to predict future cardiac events determined by the Youden index. The high BT 1–3d group was defined as patients with a max‐BT 1–3d ≥37.9°C. Unadjusted Kaplan–Meier estimates are shown for the rate of the primary composite end point (death from cardiovascular causes, acute coronary syndrome, or heart failure) (A through D) according to the high and low max‐BT 1–3d groups. ACS indicates acute coronary syndrome; BT, body temperature; CV, cardiovascular.
Independent Association Between the Max‐BT4–10d and Long‐Term Cardiac Events
We constructed multivariate Cox Hazards Model 1 and 2 to assess the independence of fever during the second phase of inflammation after STEMI in the association with future cardiac events (Table 3). Briefly, Model 1 included age, sex, coronary risk factors, the AUC creatine kinase and pericardial effusion, and medication on discharge were included in model 2. In all models, the max‐BT4–10d ≥37.1°C was independently associated with future cardiac events, and the high‐BT group had a more than doubled risk for events compared with the low‐BT group.
Table 3.
Risk of Cardiac Events Associated With Prolonged Fever After STEMI in Multiple Adjusted Models
| HR (95% CI) for Max BT4–10d ≥37.1°C | P Value | ||
|---|---|---|---|
| Unadjusted | 2.813 | 1.738 to 4.735 | <0.0001 |
| Adjusted | |||
| Model 1 | 2.801 | 1.674 to 4.888 | <0.0001 |
| Model 2 | 2.900 | 1.710 to 5.143 | <0.0001 |
Model 1: adjusted for variables including age, sex, current smoking, diabetes mellitus, total/high‐density lipoprotein cholesterol ratio, eGFR, area under the curve of creatine kinase, and pericardial effusion. Model 2: adjusted for variables including age, sex, current smoking, diabetes mellitus, total/high‐density lipoprotein cholesterol ratio, eGFR, area under the curve of creatine kinase, pericardial effusion, and medications on discharge (eg, β‐blockers, angiotensin‐converting enzyme inhibitors, angiotensin II receptor blockers, and statins). eGFR indicates estimated glomerular filtration rate; HR, hazard ratio; Max BT4–10d, maximum body temperature from 4 to 10 days after admission; STEMI, ST‐elevation myocardial infarction.
Discussion
The most important finding in the current study is that a max‐BT above 37.1°C during the second phase (but not the first phase) of post‐MI inflammation was associated with a more than doubled risk of subsequent cardiac events. The association between fever in the second phase of post‐MI inflammation and subsequent cardiac events was independent from coronary risk factors, infarct size, pericardial effusion, and medications on discharge. These findings suggest that post‐MI inflammation (especially the second phase of inflammation) plays a substantial role in the development of subsequent cardiac events. Thus, it might be important to consider the specific timing in order to develop anti‐inflammatory therapy after STEMI.
Post‐STEMI Inflammation
Fever is a common clinical feature in patients with STEMI as a nonspecific response to tissue necrosis. It develops within 24 to 48 hours of the onset of infarction and usually resolves by the fourth or fifth day after infarction.6, 7 Post‐MI inflammation consists of 2 phases. First, a specific pro‐inflammatory subset of monocytes (Ly‐6Chigh in mice, which resemble human CD16− monocytes) dominates in the first phase of inflammation. These monocytes release inflammatory mediators (ie, inducible nitric oxide synthase, reactive oxygen species, interferon‐γ, tumor necrosis factor‐α, interleukin‐1, interleukin‐6, and macrophage inflammatory protein 1α) and promote the digestion of infarcted tissue and the removal of necrotic debris.8 Approximately 4 days after infarction, pro‐inflammatory monocytes switch to another reparative subset of monocytes (Ly‐6Clow in mice, which resemble human CD16+ monocytes). Reparative monocytes play an important role in the resolution of inflammation (the second phase of inflammation after STEMI) and promote myofibroblast accumulation, collagen deposition, and angiogenesis, resulting in wound healing and regeneration.4 A well‐coordinated biphasic monocyte response is crucial for proper healing. In a study with mice, a persistently high level of Ly‐6Chigh monocytes disturbed the resolution of inflammation and consequently enhanced left ventricular remodeling.9 In the current study, we demonstrated that a prolonged fever lasting until the second phase of post‐STEMI inflammation rather than a fever during the first phase was important for the development of subsequent cardiac events, implying that prolonged fever might reflect insufficient switching from pro‐inflammatory to anti‐inflammatory monocytes and result in worse long‐term outcomes. Interestingly, monocyte/macrophage is also recruited in the noninfarcted remote myocardium, and the recruitment in the remote site occurs later (5–10 days after MI) than in the infarcted myocardium.10 Thus, inflammation during the second phase might be associated with inflammation and remodeling in the remote myocardium. Furthermore, as mentioned in the Introduction, MI‐induced monocytosis exacerbates atherosclerosis. A recent study reported that patients with STEMI had accelerated atherosclerosis progression in nonculprit coronary lesions, and higher peak total monocytes were observed in patients with rapid atherosclerosis progression compared with patients without progression.11, 12
Although many drugs have been shown to reduce post‐MI inflammation, none of these studies have been translated into clinical use because of issues such as impaired healing, an increased risk of cardiac rupture, or a failure to show any additional benefits.13 A therapeutic goal to prevent subsequent heart failure and atherothrombotic events might be to suppress excessive inflammation in an inappropriate phase and to allow necessary inflammation in an appropriate phase. Thus, we suggest that optimal timing and specific targeted signaling pathways (not broad suppression) should be considered in the development of anti‐inflammatory strategies for patients with STEMI.
Comparison to Previous Studies
Previously, 2 clinical studies have investigated the impact of fever post‐MI on cardiovascular outcomes. In the study reported by Naito et al in 2007, 156 patients with anterior STEMI were enrolled and followed for 20 months.14 The BT was measured for 7 days after STEMI, and reached its peak value 38±22 hours after infarction. Max‐BT was associated with left ventricular remodeling and rehospitalization but not with major adverse cardiovascular events. Cho et al reported another study with STEMI patients in 2014.15 The BT was measured until 5 days after admission and reached its maximum value on the second hospital day. The authors did not investigate the long‐term prognostic value of fever and concluded that max‐BT was an independent predictor for 1‐year major adverse cardiovascular events. In both of these studies, the maximum BT during the first phase of post‐MI inflammation was analyzed, and the follow‐up durations were too short (1–2 years). In the current study, we investigated fever during the first and second phases separately, and the follow‐up duration was longer than previous studies. Thus, this is the first study to demonstrate the impact of fever during the second phase of post‐MI inflammation on long‐term cardiac outcomes.
Strengths and Limitations
The strengths of this study include the availability of a long period (10 days) of BT data, which enabled separate analyses of fever in the first and second phases. Event data were collected by investigators blinded to the BT data. The number of patients was larger and the follow‐up duration was longer compared with previous studies. In the current study, we only observed serial change in BT. To clear the role of inflammation after STEMI, measurements of other markers including monocyte, C‐reactive protein, and cytokines are needed. Although some studies have demonstrated the effectiveness of anti‐inflammatory agents such as interleukin‐6 receptor antagonist and colchicine, further prospective randomized studies are needed to establish the anti‐inflammatory therapy for patients with STEMI. According to the current study, it may be important to consider proper timing of use of anti‐inflammatory agents. Our study has several limitations that may limit the generalizability of the results. This was a single‐center study. Although we only measured axillary temperature, which assesses peripheral BT, results could be affected if BT was measured by another way. It is known that core BT and peripheral BT can be divergent in some situations, for example, cold situations, low cardiac output syndrome, and peripheral circulation insufficiency. The generalizability of this study is limited because of the protocol that requires BT measurement for 10 days. However, the purpose of this study was to investigate the pathophysiologic relation of the post‐MI biphasic inflammation to long‐term cardiovascular outcomes. Although using fever to monitor inflammation is simple, it does not give much indication on pathways or mechanisms. This was an observational longitudinal study and thus could not assess causality. Although the maximum BT4–10d was more superior to median value in the current study, further studies are needed to elucidate the mechanism. Therefore, further studies are needed, including prospective interventional studies to investigate the association between second‐phase inflammation (fever and other inflammatory markers) and the progression of atherosclerosis, left ventricular remodeling, or arrhythmia. Although we conducted several multivariate models to mitigate bias with the adjustment of confounding factors, residual bias could remain.
Conclusion
The current study demonstrated that fever during the second phase but not the first phase of post‐MI inflammation was a significant and independent factor associated with future cardiac events in patients after STEMI. Patients with a max‐BT during the second phase >37.1°C had a 2‐fold higher risk compared with patients without this max‐BT. Our findings indicated that post‐MI inflammation (especially the second phase of inflammation) played a substantial role in the development of subsequent cardiac events in patients after STEMI.
Disclosures
None.
(J Am Heart Assoc. 2017;6:e005463 DOI: 10.1161/JAHA.116.005463.)28735289
References
- 1. Frangogiannis NG. The inflammatory response in myocardial injury, repair, and remodelling. Nat Rev Cardiol. 2014;11:255–265. [DOI] [PMC free article] [PubMed] [Google Scholar]
- 2. Nahrendorf M, Pittet MJ, Swirski FK. Monocytes: protagonists of infarct inflammation and repair after myocardial infarction. Circulation. 2010;121:2437–2445. [DOI] [PMC free article] [PubMed] [Google Scholar]
- 3. Tsujioka H, Imanishi T, Ikejima H, Kuroi A, Takarada S, Tanimoto T, Kitabata H, Okochi K, Arita Y, Ishibashi K, Komukai K, Kataiwa H, Nakamura N, Hirata K, Tanaka A, Akasaka T. Impact of heterogeneity of human peripheral blood monocyte subsets on myocardial salvage in patients with primary acute myocardial infarction. J Am Coll Cardiol. 2009;54:130–138. [DOI] [PubMed] [Google Scholar]
- 4. Dutta P, Courties G, Wei Y, Leuschner F, Gorbatov R, Robbins CS, Iwamoto Y, Thompson B, Carlson AL, Heidt T, Majmudar MD, Lasitschka F, Etzrodt M, Waterman P, Waring MT, Chicoine AT, van der Laan AM, Niessen HW, Piek JJ, Rubin BB, Butany J, Stone JR, Katus HA, Murphy SA, Morrow DA, Sabatine MS, Vinegoni C, Moskowitz MA, Pittet MJ, Libby P, Lin CP, Swirski FK, Weissleder R, Nahrendorf M. Myocardial infarction accelerates atherosclerosis. Nature. 2012;487:325–329. [DOI] [PMC free article] [PubMed] [Google Scholar]
- 5. Imai E, Matsuo S, Makino H, Watanabe T, Akizawa T, Nitta K, Iimuro S, Ohashi Y, Hishida A. Chronic Kidney Disease Japan Cohort (CKD‐JAC) study: design and methods. Hypertens Res. 2008;31:1101–1107. [DOI] [PubMed] [Google Scholar]
- 6. Mann DL, Zipes DP, Libby P, Bonow RO, Braunwald E. Braunwald's Heart Disease: A Textbook of Cardiovascular Medicine. 10th ed 2014: Saunders; USA:1086. [Google Scholar]
- 7. Lofmark R, Nordlander R, Orinius E. The temperature course in acute myocardial infarction. Am Heart J. 1978;96:153–156. [DOI] [PubMed] [Google Scholar]
- 8. Dutta P, Nahrendorf M. Monocytes in myocardial infarction. Arterioscler Thromb Vasc Biol. 2015;35:1066–1070. [DOI] [PMC free article] [PubMed] [Google Scholar]
- 9. Panizzi P, Swirski FK, Figueiredo JL, Waterman P, Sosnovik DE, Aikawa E, Libby P, Pittet M, Weissleder R, Nahrendorf M. Impaired infarct healing in atherosclerotic mice with Ly‐6C(hi) monocytosis. J Am Coll Cardiol. 2010;55:1629–1638. [DOI] [PMC free article] [PubMed] [Google Scholar]
- 10. Lee WW, Marinelli B, van der Laan AM, Sena BF, Gorbatov R, Leuschner F, Dutta P, Iwamoto Y, Ueno T, Begieneman MP, Niessen HW, Piek JJ, Vinegoni C, Pittet MJ, Swirski FK, Tawakol A, Di Carli M, Weissleder R, Nahrendorf M. PET/MRI of inflammation in myocardial infarction. J Am Coll Cardiol. 2012;59:153–163. [DOI] [PMC free article] [PubMed] [Google Scholar]
- 11. Han Y, Jing J, Tu S, Tian F, Xue H, Chen W, Chen J, Reiber JH, Chen Y. ST elevation acute myocardial infarction accelerates non‐culprit coronary lesion atherosclerosis. Int J Cardiovasc Imaging. 2014;30:253–261. [DOI] [PubMed] [Google Scholar]
- 12. Nozawa N, Hibi K, Endo M, Sugano T, Ebina T, Kosuge M, Tsukahara K, Okuda J, Umemura S, Kimura K. Association between circulating monocytes and coronary plaque progression in patients with acute myocardial infarction. Circ J. 2010;74:1384–1391. [DOI] [PubMed] [Google Scholar]
- 13. Seropian IM, Toldo S, Van Tassell BW, Abbate A. Anti‐inflammatory strategies for ventricular remodeling following ST‐segment elevation acute myocardial infarction. J Am Coll Cardiol. 2014;63:1593–1603. [DOI] [PubMed] [Google Scholar]
- 14. Naito K, Anzai T, Yoshikawa T, Maekawa Y, Sugano Y, Kohno T, Mahara K, Okabe T, Asakura Y, Ogawa S. Increased body temperature after reperfused acute myocardial infarction is associated with adverse left ventricular remodeling. J Card Fail. 2007;13:25–33. [DOI] [PubMed] [Google Scholar]
- 15. Cho HO, Nam CW, Lee HM, Shin HW, Cho YK, Yoon HJ, Park HS, Kim H, Chung IS, Hur SH, Kim YN, Kim KB. Fever after primary percutaneous coronary intervention in ST‐segment elevation myocardial infarction is associated with adverse outcomes. Int J Cardiol. 2014;170:376–380. [DOI] [PubMed] [Google Scholar]


