

Abstract
Background
The mechanisms underlying the possible contribution of chronic inflammation to the development of hypertension remain unclear. We examined the longitudinal association of inflammation with the progression of vascular and/or renal abnormalities in the development of hypertension.
Methods and Results
In 3274 middle‐aged Japanese men without hypertension at the study baseline, brachial‐ankle pulse wave velocity, blood pressure, estimated glomerular filtration rate, and serum CRP (C reactive protein) levels were measured annually during a 9‐year period. During this study period, 474 participants (14.5%) developed hypertension. Analysis of the repeated‐measures data revealed that sustained elevation of serum CRP levels was associated with a longitudinal increase of the brachial‐ankle pulse wave velocity. A linear mixed model analysis revealed that higher log‐transformed serum CRP values (log CRP) at each measurement were associated with a higher annual increase of the brachial‐ankle pulse wave velocity (estimate=32.553±11.635 cm/s per log CRP, P=0.018), and that higher values of the brachial‐ankle pulse wave velocity at each measurement were associated with a higher annual elevation of blood pressure (estimate=0.025±0.002 mm Hg per log CRP, P<0.001).
Conclusions
In middle‐aged Japanese men without hypertension at study baseline, long‐term active inflammation appears to be associated with a longitudinal increase of arterial stiffness. In turn, this longitudinal increase of arterial stiffness appears to be associated with longitudinal elevation of blood pressure to the hypertensive range. Thus, systemic inflammation may play a role in the pathogenesis of hypertension by the progression of arterial stiffness.
Keywords: arterial stiffness, C‐reactive protein, hypertension, inflammation
Subject Categories: Hypertension, Risk Factors, Blood Pressure
Clinical Perspective
What Is New?
The long‐term elevation of serum C‐reactive protein levels was associated with an accelerated increase of pulse wave velocity, and this accelerated increase was significantly associated with accelerated longitudinal elevation of blood pressure.
What Are the Clinical Implications?
The present study findings implicate the inflammation‐arterial stiffness axis in the development of hypertension.
This axis was significant and independent of the family history of hypertension; therefore, environmental factors could possibly affect this axis.
Lifestyle modifications such as exercise, weight control, and/or salt restriction reduce blood pressure and also exert beneficial effects on inflammation and arterial stiffness, and the present study provides a rationale for trials of potential therapeutic options targeted at inflammation and/or arterial stiffness to prevent the development of hypertension.
Introduction
It has been proposed from experimental research that inflammation contributes to the development of hypertension by inducing vascular damage, renal damage, and/or abnormal central neural regulation.1, 2, 3, 4 The prevalence of risk factors for cardiovascular disease such as obesity, diabetes mellitus, and dyslipidemia have also been reported to increase with the development of hypertension.5 Therefore, the long‐term variability of inflammation may have an influence on the progression of vascular/renal/central neural abnormalities involved in the development of hypertension. Clinical studies have suggested that elevated serum CRP (C reactive protein), a marker of inflammation, is a risk factor for the development of hypertension,6, 7 and several prospective clinical studies have reported that vascular/renal abnormalities are useful markers to predict the development of hypertension.8, 9, 10, 11 While some studies have reported that CRP is a marker to predict the progression of carotid atherosclerosis and renal damages,12, 13 no clinical study has yet demonstrated that inflammation contributes to the development of hypertension by inducing vascular/renal abnormalities. Thus, the longitudinal association of inflammation with accelerated progression of vascular/renal abnormalities needs to be clarified.
From the 2007 to 2015, Japanese employees of a construction company located in Tokyo (84% men) underwent annual measurements of brachial‐ankle pulse wave velocity (baPWV; a marker of arterial stiffness), radial augmentation index (rAI; a marker of central hemodynamics), and serum levels of creatinine and CRP as part of their annual health checkups.8, 14 By analysis of the repeated‐measures data of the men without hypertension at the start of the study period, the longitudinal associations of the serum CRP levels with the rates of increase of the baPWV, increase of the rAI, and decline of the creatinine‐based estimated glomerular filtration rate (eGFR) in relation to the development of hypertension were examined.
Methods
Design and Participants
The present study was conducted as part of a previously reported prospective observational study8, 14 conducted to examine the longitudinal association of arterial stiffness with cardiovascular risk status. The study was conducted in employees working at the headquarters of a single large Japanese construction company located in downtown Tokyo. According to the Occupational Health and Safety Law in Japan, it is mandatory for all company employees to undergo annual health checkups. Annual measurements of baPWV and rAI have been measured since 2007. Serum CRP was not measured in 2012. Verbal informed consent was obtained from all study participants before their participation in this study. The study was conducted with the approval of the Ethical Guidelines Committee of Tokyo Medical University (No. 209 and No. 210 in 2003).
We conducted the present study on the basis of health checkup data obtained from 2007 to 2015. Figure 1 shows a flow diagram of the participants enrolled in the study. Of the total 5857 persons working at the headquarters of the company, 834 had undergone measurement of baPWV only once during the study period (most of these were temporary employees). The remaining 5023 individuals, who had undergone at least 2 measurements of the baPWV, were enrolled in the study. Of these, 334 individuals were excluded because they fulfilled at least one of the following exclusion criteria: unreliable accuracy of the measured baPWV (ankle/brachial systolic blood pressure index <0.95 15, 16 and/or presence of atrial fibrillation15, 16) or history of hemodialysis, heart disease, and/or cerebrovascular disease. A further 788 persons who had a blood pressure (BP) of 140/90 mm Hg and/or were under antihypertensive drug therapy at the start of the study period were also excluded. Finally, data of the remaining 3274 men in whom the BP was categorized as being in the normal range (ie, <140/90 mm Hg) were included for our analysis (634 women were not included because their number was small). Participants in whom the measured values of rAI were considered to be unreliable (ie, those with an SD of the rAI ≥6%, calculated on the basis of 10 radial pressure waveform records) were excluded from the analysis.17
Figure 1.
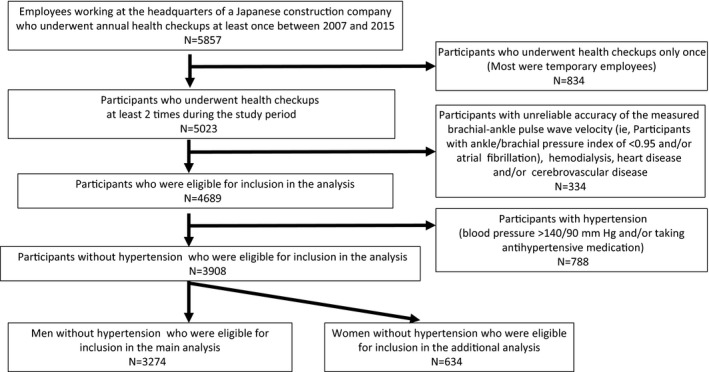
Flow diagram of the participants enrolled in the study.
BP Measurement
Brachial BP was measured as the mean of 2 measurements obtained in an office setting by the conventional cuff method using a mercury sphygmomanometer. These measurements were conducted by well‐trained nurses. Both measurements were performed on the same occasion with the participants in the seated position after they had rested for at least 5 minutes. The definition of hypertension included a systolic BP (SBP) ≥140 mm Hg and/or a diastolic BP (DBP) ≥90 mm Hg and/or a history of receiving antihypertensive drug therapy at the time of the annual health checkups.
Alcohol Use and Smoking Status
Habitual alcohol use was assessed using a self‐administered questionnaire. The alcohol consumption level was evaluated using 2 parameters: the average drinking frequency (days per week) and the average amount of alcohol consumed every week (mL). The average daily alcohol consumption level (g/d, ethanol equivalent) was then calculated for each participant. The smoking status of the participants (ie, never‐smoker/former smoker and current smoker) was also assessed using a questionnaire. The present study was a longitudinal study; therefore, we did not examine history of alcohol use or smoking status before the individuals’ participation in the present study.
Measurement of baPWV and rAI
baPWV was measured using a volume‐plethysmographic apparatus (Form/ABI, Omron Healthcare Co., Ltd), as previously described.9, 13, 14 Briefly, occlusion cuffs connected to both the plethysmographic and oscillometric sensors were applied around both the upper arms and ankles of the participants lying in the supine position. The brachial and post‐tibial arterial pressures were measured by oscillometric sensor. The measurements were conducted after the participants had rested for at least 5 minutes in the supine position in an air‐conditioned room (maintained at 24°C) designated exclusively for this study. The angle of rise of the pressure waveform and amplitude of the pressure waveform are diminished in inaccurate tracings of the pressure waveform. These phenomena were frequently observed in cases of ankle‐brachial index <0.95.15 The duration of sampling of the pressure waveform is 10 seconds, and in cases with atrial fibrillation, the pressure wave transit time is not constant during this sampling time. Therefore, participants with ankle‐brachial index <0.95 and those with atrial fibrillation were excluded from the analyses.
Measurements of BP and rAI were conducted after the participants had rested for at least 5 minutes in the seated position. The left radial arterial waveform was recorded using an arterial applanation tonometry probe equipped with an array of 40 micropiezo‐resistive transducers (HEM‐9010AI; Omron Healthcare Co, Ltd). Subsequently, the first and second peaks of the radial pressure waveform (SP1 and SP2) and brachial diastolic pressure (brDBP) were automatically detected using the fourth derivatives for each radial arterial waveform, and then averaged. The rAI was calculated as follows: (SP2–brDBP)/(SP1−brDBP)×100 (%).17 Acceptable reproducibility of both measurements has been reported elsewhere.16, 17
Laboratory Measurements and eGFR
Serum concentrations of triglyceride, low‐density lipoprotein cholesterol, high‐density lipoprotein cholesterol, creatinine, and CRP, as well as plasma glucose concentration and hemoglobin A1c were measured using standard enzymatic methods (Falco Biosystems Co Ltd). Serum CRP was measured by the latex‐aggregation method (Falco Biosystems Co Ltd).18
All blood samples were obtained in the morning after the participants had fasted overnight. eGFR was calculated from serum creatinine using the Modification of Diet in Renal Disease study equation19 and the Chronic Kidney Disease Epidemiology Collaboration equation (eGFRckep)20 for Japanese participants.
Statistical Analysis
Data are expressed as mean±SD, unless otherwise indicated. The serum CRP levels were skewed rightward; therefore, the values were log‐transformed for the analyses. The minimum value of the serum CRP was set at 0.5 mg/L.18 Then, the CRP values were multiplied by 10 for the log‐transformation (log [CRP×10]), to align all values in the positive range.
The differences in the measured values between the baseline and final examinations were assessed by the paired t test for continuous variables and by McNemar's nonparametric test for categorical variables. The variables at the start of the study period were compared with the values measured annually thereafter during the study period by general linear model univariate analysis. Student t test, Mann–Whitney test, or 1‐way ANOVA was applied for other group comparisons.
The Cox proportional‐hazards regression model was applied to assess the association of the log (CRP×10) levels at the start of the study period with the outcomes at the end of the study period. The relationships among the variables were assessed by linear regression analysis. Then, the direct and indirect effects of the log (CRP×10) levels on the BP were assessed by mediation analysis.
For determining the longitudinal associations among the outcome variables, linear mixed model (LMM) analysis was applied.21 The covariates entered in the analyses were those variables that are considered to potentially increase arterial stiffness and/or BP22, 23 (ie, for changes in the markers of vascular/renal abnormalities: age; body mass index; SBP; heart rate; serum levels of low‐density lipoprotein cholesterol, high‐density lipoprotein cholesterol, and triglycerides; hemoglobin A1c; smoking history; drinking history; family history of hypertension; history of medication for hypertension, dyslipidemia, and/or diabetes mellitus [not receiving medication=0, receiving medication=1]; and the time [years from baseline]. For changes of BP: the same covariates as for the changes in the markers of vascular/renal abnormalities, except for substitution of SBP with serum creatinine). In the LMM analysis models, the time effect was entered by the interaction term between the time (years from baseline) and each of the explanatory variables. β Estimates of the interaction between the time and each of the explanatory variables were regarded as the annual change of each outcome variable per unit annual increase of each of the explanatory variables. A repeated statement with a Toeplitz structure was used in the LMM analyses. LMM analyses were conducted using SAS software (PROC MIXED version 9.4; SAS Institute Inc), while all other analyses were conducted using SPSS software (version 24.0, IBM). P<0.05 was considered as denoting statistical significance in all of the statistical tests.
Results
Table 1 shows the clinical characteristics of the men at the start of the study and at the final observation. End of study period was defined by the last examination in the participants who underwent more than 2 annual examinations. Among the participants, 474 (14.5%) developed hypertension (SBP/DBP at the end of the study period ≥140/90 mm Hg) by the end of the study period (with 152 men taking medication for hypertension at the end of the study period). The mean number of measurements was 5.2±2.1, and the mean duration of follow‐up was 6.4±2.5 years. Table 2 summarizes the number of available data for each variable from each annual observation.
Table 1.
Clinical Characteristics of the Study Participants
| Parameter | Start of the Observation Period | End of the Observation Period | P Value |
|---|---|---|---|
| No. | 3274 | 3274 | |
| Age, y | 42±9 | 48±9 | |
| BMI, kg/m2 | 23.7±2.9 | 23.9±3.0 | <0.01 |
| Smoking (current), No. (%) | 1055 (32.2) | 843 (26.0) | <0.01 |
| Alcohol drinking (current), No. (%) | 2787 (85.1) | 2903 (88.7) | <0.01 |
| Ethanol, g/d | 12.2±10.8 | 14.2±11.7 | |
| SBP, mm Hg | 120±10 | 123±12 | <0.01 |
| DBP, mm Hg | 72±8 | 76±10 | <0.01 |
| Patients with hypertension, No. (%) | 0 | 474 (14.5) | |
| Heart rate, beats per min | 67±9 | 67±10 | 0.10 |
| baPWV, cm/s | 1244±143 | 1302±187 | <0.01 |
| rAI, % | 68±13 | 72±13 | <0.01 |
| LDL, mmol/L | 3.18±0.78 | 3.19±0.77 | <0.01 |
| HDL, mmol/L | 1.62±0.40 | 1.59±0.39 | <0.01 |
| Triglyceride, mmol/L | 1.35±0.95 | 1.33±0.91 | 0.29 |
| FPG, mmol/L | 5.00±0.69 | 4.91±0.81 | <0.01 |
| Hemoglobin A1c, % | 5.2±0.5 | 5.3±0.6 | <0.01 |
| Creatinine, μmol/L | 75±9 | 76±10 | <0.01 |
| eGFRmdrd, mL/min per 1.73 m2 | 81±12 | 78±12 | <0.01 |
| eGFRckep, mL/min per 1.73 m2 | 86±9 | 83±9 | <0.01 |
| Log (CRP×10) | 0.85±0.28 | 0.84±0.28 | 0.12 |
| Medications, No. (%) | |||
| Receiving medication for hypertension | 0 | 152 (4.6) | <0.01 |
| Receiving medication for dyslipidemia | 56 (1.7) | 160 (4.9) | <0.01 |
| Receiving medication for diabetes mellitus | 44 (1.3) | 90 (2.7) | <0.01 |
baPWV indicates brachial‐ankle pulse wave velocity; BMI, body mass index; DBP, diastolic blood pressure; eGFRckep, estimated glomerular filtration rate by the Chronic Kidney Disease Epidemiology Collaboration equation; eGFRmdrd, estimated glomerular filtration rate by the Modification of Diet in Renal Disease Study equation; FPG, fasting plasma glucose; HDL, high‐density lipoprotein cholesterol; LDL, low‐density lipoprotein cholesterol; log (CRP×10), log‐transformed serum C‐reactive protein level×10; rAI, radial augmentation index; SBP, systolic blood pressure.
Table 2.
Number of Available Data for Each Variable at Each Annual Observation
| Annual Observation | Total Participants (N=3274) | Annual Observation ≥5 Times (n=2066) | ||||||
|---|---|---|---|---|---|---|---|---|
| baPWV | rAI | SBP/DBP | eGFRmdrd/ckep | baPWV | rAI | SBP/DBP | eGFRmdrd/ckep | |
| Start | 3274 | 3169 | 3274 | 3274 | 2066 | 1993 | 2066 | 2066 |
| Second | 2543 | 2461 | 2550 | 2548 | 1631 | 1587 | 1636 | 1635 |
| Third | 2015 | 1954 | 2022 | 2019 | 1498 | 1452 | 1505 | 1502 |
| Fourth | 2303 | 2231 | 2317 | 2313 | 1877 | 1820 | 1884 | 1881 |
| Fifth | 1772 | 1722 | 1777 | 1775 | 1576 | 1535 | 1581 | 1579 |
| Sixth | 1443 | 1389 | 1448 | 1446 | 1355 | 1306 | 1361 | 1359 |
| Seventh | 1686 | 1640 | 1696 | 1692 | 1591 | 1549 | 1599 | 1596 |
| Eighth | 1224 | 1188 | 1227 | 1227 | 1174 | 1140 | 1177 | 1177 |
| Ninth | 877 | 822 | 879 | 879 | 845 | 792 | 847 | 847 |
baPWV indicates brachial‐ankle pulse wave velocity; DBP, diastolic blood pressure; eGFRckep, estimated glomerular filtration rate by the Chronic Kidney Disease Epidemiology Collaboration equation; eGFRmdrd, estimated glomerular filtration rate by the Modification of Diet in Renal Disease study equation; rAI, radial augmentation index; SBP, systolic blood pressure.
Figure 2A and 2B show the annual changes of the SBP, DBP, baPWV, rAI, and eGFRckep, which are plotted discontinuously, during the observation period in 2 groups divided by the value of the log (CRP×10) at the start of the study (ie, values in the lowest or intermediate tertile and those in the highest tertile) in all of the study participants included in the analyses and in the study participants who underwent the annual examinations more than 5 times. The SBP, DBP, baPWV, and rAI, but not the eGFRckep, were higher in the participants with log (CRP×10) values in the highest tertile at the start of the study than in those with values in the lowest or intermediate tertile (Figure 2A and 2B). The values of SBP, DBP, baPWV, and rAI showed significant longitudinal increases during the study period, while the value of eGFRckep decreased significantly during the study period in both groups (Figure 2A and 2B).
Figure 2.
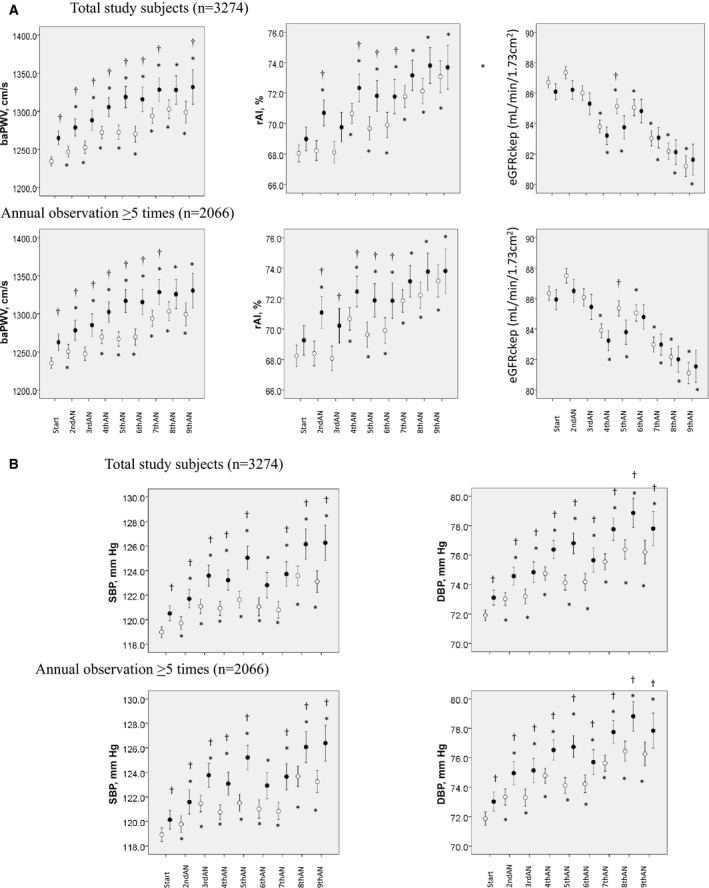
A, Annually measured values of the brachial‐ankle pulse wave velocity (baPWV), radial augmentation index (rAI), and estimated glomerular filtration rate during the observation period in participants with the log‐transformed serum C‐reactive protein levels in the lowest or intermediate tertile at the start of the study (open circles) and in those with levels in the highest tertile (closed circles). Because the measurements could not be conducted entirely continuously during the observation period, the annual changes of the data are plotted discontinuously for each of the participants. *=P<0.05 vs start; †=P<0.05 vs patients with log‐transformed serum C‐reactive protein levels in the lowest or intermediate tertile at the start of the study. B, Annually measured values of the systolic and diastolic blood pressure during the observation period in the participants with the log‐transformed serum C‐reactive protein levels in the lowest or intermediate tertile at the start of the study and those with the levels in the highest tertile. AN indicates annual observation; Annual observation ≥5 times, participants who underwent annual examinations more than 5 times; DBP, diastolic blood pressure; eGFRckep, estimated glomerular filtration rate by the Chronic Kidney Disease Epidemiology Collaboration study equation; SBP, systolic blood pressure; Start, start of the study period.
Figure 3A and 3B show the annual changes of the SBP and DBP during the observation period in 2 groups divided by the value of the baPWV or rAI at the start of the study (ie, values in the lowest or intermediate and those in the highest tertile) in all of the study participants included in the analyses, and in the study participants who underwent annual examinations more than 5 times. The SBP and DBP were higher in the participants with the values in the highest tertile at the start of the study than in those with values in the lowest or intermediate tertile (Figure 3A and 3B).
Figure 3.
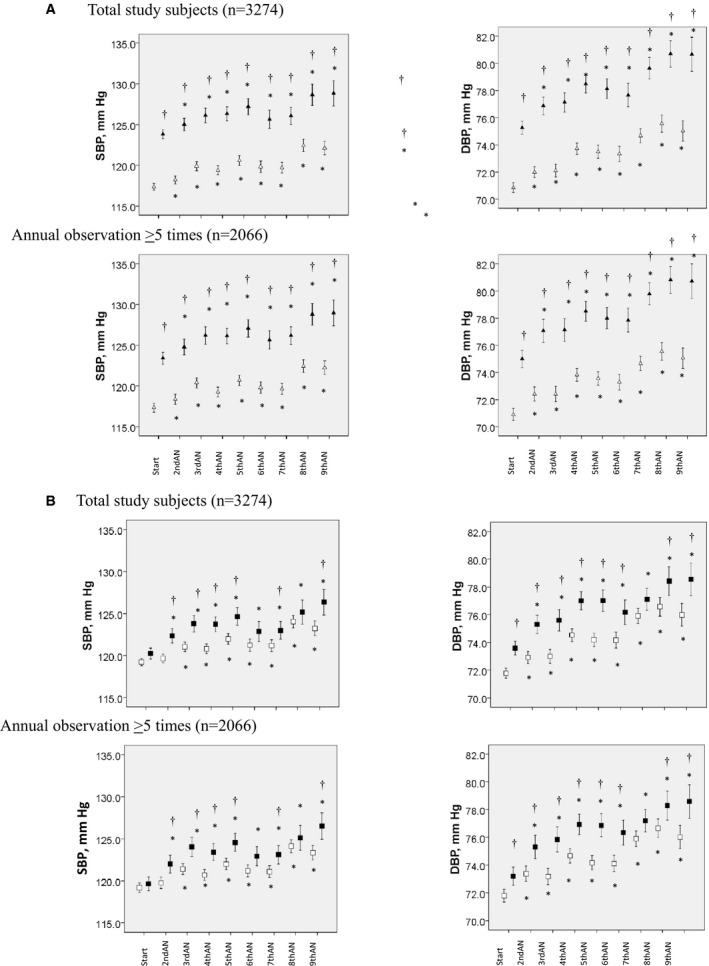
A, Annually measured values of systolic blood pressure (SBP) and diastolic blood pressure (DBP) during the observation period in participants with brachial‐ankle pulse wave velocity values in the lowest or intermediate tertile at the start of the study (open triangles) and in those with values in the highest tertile (closed triangles). †=P<0.05 vs patients with brachial‐ankle pulse wave velocity in the lowest/intermediate tertile at the start of the study. B, Annually measured values of SBP and DBP during the observation period in participants with radial augmentation index values in the lowest or intermediate tertile at the start of the study (open squares) and in those with values in the highest tertile (closed squares). AN indicates annual observation; Start, start of the study period. †=P<0.05 vs patients with radial augmentation index values in the lowest/intermediate tertile at the start of the study.
When development of hypertension, eGFR by the Modification of Diet in Renal Disease study equation <60 mL/min per 1.73 m2 and eGFRckep <60 mL/min per 1.73 m2, highest quintile of the baPWV, or rAI at the end of the study period were defined as the outcome variables, analysis using the Cox proportional‐hazards regression model without adjustments demonstrated that the log (CRP×10) at the start of the study period was a significant predictor of the development of hypertension (hazard ratio, 1.160; 95% CI, 1.073–1.255 [P<0.001]) and of increase of the baPWV to the highest quintile (hazard ratio, 1.102; 95% CI, 1.028–1.182 [P=0.006]) at the end of the study period. However, the analysis after adjustment for the covariates at the start of the study period (age, body mass index, heart rate, serum levels of low‐density lipoprotein cholesterol and high‐density lipoprotein cholesterol and triglycerides, hemoglobin A1c, smoking history, drinking history, family history of hypertension, history of medication for dyslipidemia and/or diabetes mellitus [not receiving medication=0, receiving medication=1]) revealed no significant predictors.
Linear regression analyses of the data at the start and at the end of the study period demonstrated that the log (CRP×10) levels were significantly associated with SBP, DBP, and baPWV (data not shown). Figure 4 shows the results of the mediation analyses. Both at the start and at the end of the study period, the log (CRP×10) showed direct and indirect (via baPWV) relationships with SBP and DBP.
Figure 4.
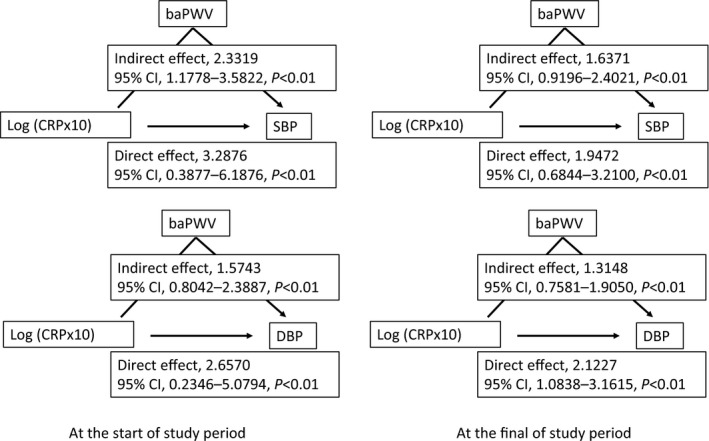
Mediation analyses to determine the association between log‐transformed serum C‐reactive protein levels and blood pressure. The mediation analyses describe the mediation of the relationship between the log‐transformed serum C‐reactive protein levels and blood pressure by the brachial‐ankle pulse wave velocity. baPWV indicates brachial‐ankle pulse wave velocity; DBP, diastolic blood pressure; log (CRP×10), log‐transformed serum C‐reactive protein level×10; SBP, systolic blood pressure.
Even after adjustments, higher values of the log (CRP×10) at each annual measurement after baseline were significantly associated with a higher annual increase of the baPWV, but not with a higher annual increase of the rAI or decline of the eGFR by the Modification of Diet in Renal Disease study equation or eGFRckep (Table 3). As subanalyses, the association of the log (CRP×10) with the annual increase of the baPWV was examined in subgroups of men (aged older than 40 years and those 40 years and younger [median of age]).
Table 3.
Results of Mixed Model Linear Regression Analysis to Examine the Associations of Annually Measured Log‐Transformed Serum CRP Levels With Annual Changes of the Markers of Vascular/Renal Abnormalities
| Outcome | Crude Estimate | SE | P Value | Adjusted Estimate | SE | P Value |
|---|---|---|---|---|---|---|
| baPWV, cm/s | 73.44 | 25.70 | <0.01 | 82.77 | 27.04 | <0.01 |
| rAI, % | −8.35 | 2.27 | <0.01 | −3.64 | 2.22 | 0.10 |
| eGFRmdrd, mL/min per 1.73 m2 | 1.78 | 1.81 | 0.98 | … | … | … |
| eGFRckep, mL/min per 1.73 m2 | −0.75 | 1.20 | 0.53 | … | … | … |
| Age ≤40 ya (n=1680) | ||||||
| baPWV, cm/s | 79.78 | 28.55 | <0.01 | 55.76 | 30.99 | 0.05 |
| Age >40 yb (n=1594) | ||||||
| baPWV, cm/s | 95.91 | 45.99 | 0.04 | 153.59 | 46.92 | <0.01 |
Participants whose age at the start of the study period was 40 years or younger.
Participants whose age at the start of the study period was older than 40 years. baPWV indicates brachial‐ankle pulse wave velocity; eGFRckep, estimated glomerular filtration rate by the Chronic Kidney Disease Epidemiology Collaboration equation; eGFRmdrd, estimated glomerular filtration rate by the Modification of Diet in Renal Disease Study equation; Estimate, β estimates of the interaction between time and each of the explanatory variables; Outcome, outcome variable; rAI, radial augmentation index. The covariates adjusted for were age; body mass index; systolic blood pressure; heart rate; serum levels of low‐density lipoprotein cholesterol, high‐density lipoprotein cholesterol, and triglycerides; hemoglobin A1c, smoking history; drinking history; family history of hypertension; history of medication for hypertension, dyslipidemia, and/or diabetes mellitus (not receiving medication=0, receiving medication=1); and time (years from baseline). The unit used for expressing the associations with the log‐transformed serum C‐reactive protein level×10 was per log (CRP×10).
In the analysis by the LMM approach, the crude analysis revealed that higher values of the baPWV and log (CRP×10) at each annual measurement were significantly associated with higher annual elevations of the SBP and/or DBP. After adjustments, however, the baPWV, but not the log (CRP×10), at each annual measurement was significantly associated with higher annual elevations of SBP and/or DBP (Table 4).
Table 4.
Results of the Mixed Model Linear Regression Analysis Conducted to Examine the Associations of Annually Measured Log‐Transformed Serum CRP Levels and baPWV Values to the Annual Changes of BP
| Outcome | Explanatory Variable | Crude Estimate | SE | P Value | Adjusted Estimate | SE | P Value |
|---|---|---|---|---|---|---|---|
| SBP, mm Hg | Log (CRP×10) | 7.44 | 2.70 | <0.01 | 4.08 | 2.97 | 0.17 |
| baPWV | 0.03 | 0.02×10⁻¹ | <0.01 | 0.03 | 0.02×10⁻¹ | <0.01 | |
| DBP, mm Hg | Log (CRP×10) | 8.33 | 2.18 | <0.01 | 5.46 | 2.34 | 0.02 |
| baPWV | 0.03 | 0.01×10⁻¹ | <0.01 | 0.02 | 0.01×10⁻¹ | <0.01 |
The covariates adjusted for included the same covariates as those for the changes in the markers of vascular/renal abnormalities, except that serum creatinine was substituted for systolic blood pressure. The unit used for expressing the associations with baPWV was per cm/s. baPWV indicates brachial‐ankle pulse wave velocity; BP, blood pressure; DBP, diastolic blood pressure; log (CRP×10), log‐transformed serum C‐reactive protein level×10; SBP, systolic blood pressure.
Discussion
The novelty of the present study was as follows. Long‐term elevation of serum CRP levels was associated with a longitudinal increase of baPWV, but not with a longitudinal increase of rAI or longitudinal decrease of eGFR. This longitudinal increase of baPWV was significantly associated with longitudinal elevation of SBP/DBP. These findings support the concept that inflammation plays a role in the development of hypertension by the progression of arterial stiffness in Japanese men. The strength of the present study lies in the fact that we analyzed repeated‐measurement data by the LMM approach to confirm these findings.
Some clinical studies have reported the existence of associations between elevated serum CRP levels and increase of arterial stiffness and/or abnormal central hemodynamics.24, 25, 26, 27 However, inflammation has been reported to show long‐term variability,4 which may have an influence on the progression of arterial stiffness and/or central hemodynamics. Our previous study, in which we examined the changes of variables at 2 time points (ie, the start and the end of the study period), failed to confirm any significant association between changes of serum CRP levels and changes of arterial stiffness over time.14 Thus, the longitudinal association of serum CRP levels with arterial stiffness and/or central hemodynamics has not yet been clearly demonstrated. In the present study, which was a cross‐sectional analysis, the baPWV and rAI were higher in the participants with log (CRP×10) values in the highest tertile than in those with the values in the lowest or intermediate tertile during the observation period. On the other hand, analysis using the Cox proportional‐hazards regression model demonstrated that the log (CRP×10) level at the start of the study was not a significant predictor of the development of hypertension or increased arterial stiffness at the end of the study period after the adjustments for the covariates. However, this study is the first to demonstrate a significant positive longitudinal association between sustained elevation of the serum CRP levels and increase of the baPWV, but not rAI, in participants without hypertension at the start of the study period. Thus, chronic active inflammation may be associated with longitudinal increase of arterial stiffness, rather than with abnormal central hemodynamics, in men with BP in the normotensive or prehypertensive range. While age affects the rate of progression of arterial stiffness and systemic inflammation,22, 28, 29 the age‐related heterogeneity in the association between chronic inflammation and longitudinal increase of arterial stiffness might not be significant.
Most previous clinical studies performed to examine the association of vascular abnormalities with BP elevation have been prospective 2‐point assessment studies.10, 11, 12, 13 A recent study using the MML approach revealed an association between increase of arterial stiffness and BP elevation to the hypertensive range.30 However, the number of measurements in that study was relatively small (2 or 3 times),30 and it is possible that the effects of time‐varying confounding factors were not fully excluded in this MML analysis. In the present study, the mediation analyses demonstrated that the log (CRP×10) showed significant direct and indirect (via baPWV) relationships with BP both at the start and at the end of the study period. Then, MML analysis was conducted of repeated‐measures data (the mean number of measurements was 5.2). In the crude analysis, the log (CRP×10) was significantly associated with elevations of SBP and DBP, but this was no longer the case after adjustment for baPWV, and only baPWV was significantly associated with SBP and DBP. These findings suggest that increased arterial stiffness is one of the key players in the development of hypertension associated with systemic inflammation. Increased arterial stiffness is thought to affect SBP by increasing the amplitude of the forward pressure wave caused by increased aortic impedance and that of the reflected pressure wave from the periphery.31, 32
In the present study, we found a significant longitudinal association of increased arterial stiffness with elevation of BP. Several mechanisms other than inflammation, such as sympathetic tone, oxidative stress, vascular growth factors, and advanced glycation end products,33 could also contribute to the increase of arterial stiffness. On the other hand, serum CRP is thought to have limited ability to fully reflect inflammation.34 The results of the present study indicate a significant longitudinal association of baPWV, rather than that of the CRP, with the elevation of BP over time.
The rAI reflects the degree of vascular damage of not only the large to medium arteries, as assessed by measurement of baPWV, but also of the peripheral arteries.31, 32 In the present study, serum CRP levels were associated with baPWV rather than rAI. Inflammation, as reflected by elevated serum CRP levels, might affect the stiffness of the large to medium arteries, rather than that of the peripheral arteries, to induce the development of hypertension. The plausible mechanisms underlying inflammation‐related arterial stiffening could involve endothelial dysfunction, vascular smooth muscle cell abnormalities, and/or increase in the collagen content of the vascular wall.31, 32, 33 Serum CRP is a known predictor of the rate of renal function decline with time.13 However, in the present study (eGFR in most participants was ≥60 mL/min per 1.73 m2), LMM analysis demonstrated no significant relationship between serum CRP levels and the rate of change of eGFR by the Modification of Diet in Renal Disease study equation or eGFRckep.
Clinical Implications
Recently, studies to examine the efficacies of therapies targeted at inflammation to prevent cardiovascular events have been initiated.35 The present study findings implicate the inflammation‐arterial stiffness axis in the development of hypertension. This axis was significant and independent of family history of hypertension; therefore, environmental factors could possibly affect this axis. Lifestyle modifications such as exercise, weight control, and/or salt restriction reduce BP and also exert beneficial effects on inflammation and arterial stiffness,36 and the present study provides a rationale for trials of potential therapeutic options targeted at inflammation and/or arterial stiffness to prevent the development of hypertension.37
Limitations
The present study has a number of limitations. First, while the reported rate of new‐onset hypertension according to previous prospective studies is 30% to 50%,8, 9, 10, 11, 12, 13 it was only 14.1% in the present study. This could be attributable to the selection bias possibly introduced by the study being conducted in middle‐aged employees of a Japanese construction company. It is possible that the participants were motivated to maintain a healthy lifestyle, because the mean BMI was 23.2 and the percentage of current smokers was ≈30% (Table 1). Thus, while interpreting the data, the profile of the study participants should also be taken into account. For example, while age‐related increase of serum CRP was demonstrated in an epidemiological study,29 the age‐related increase of serum CRP was attenuated in the present study, possibly as a consequence of the healthy profiles of the present study participants, as mentioned above. Also, further studies are needed to confirm the present findings in women, in other ethnicities, and/or in the general population. Second, among the 3274 men enrolled in the study, the measurements could be performed more than 5 times during the observation period in 2528 participants. Accordingly, a sensitivity analysis was conducted in these participants, and the LMM analysis demonstrated an independent longitudinal association of serum CRP with baPWV (β=23.393±11.405, P=0.040). Third, baPWV actually reflects the stiffness of the large to medium arteries,14, 16 and, therefore, the importance of aortic stiffness in BP elevation could not be examined precisely. Fourth, in the present study, BP was measured twice on the same day, not on different days. Fifth, the effect of habitual exercise, which is well known to affect BP and arterial stiffness,36 was not examined in the present study. Sixth, we could not definitely disprove the hypothesis that “small vessel damage caused by pulsatile stress activates inflammation.”38 Last, in the pooled analysis, the crude effect of CRP (per log(CRP×10)) on SBP was 73.44 on baPWV. In the subgroup of participants 40 years and younger, the effect estimate was 79.78, and, in the subgroup older than 40 years, the effect estimate was 95.91. Generally, the estimate from pooled analysis would be somewhere between those estimates from the 2 subgroups, but this “unusual” finding was likely caused by difference sample means among the 2 groups and the entire sample.
Conclusions
In middle‐aged Japanese men who did not have hypertension at baseline, long‐term persistence of active inflammation, as reflected by elevated serum CRP levels, appeared to be associated with a longitudinal increase of stiffness of the medium to large arteries (as reflected by an increase of the baPWV), but not with the abnormal changes of the central hemodynamics or decline of the glomerular filtration rate. In turn, the longitudinal increase of the arterial stiffness appeared to be associated with longitudinal elevation of systolic/diastolic BP to the hypertensive range. Thus, inflammation may play a role in the pathogenesis of hypertension via the progression of arterial stiffness.
Sources of Funding
This study was supported by Omron Health Care Company (Kyoto, Japan), which awarded a fund to Professor Akira Yamashina.
Disclosures
The sponsor (Omron Health Care Company) assisted in the data formatting (ie, the data of the baPWV stored in the hard disc in the equipment used for the measurement of the baPWV were transferred to an Excel sheet). Other than this, however, the company played no role in the design or conduct of the study, ie, in the data collection, management, analysis, or interpretation of the data, or in the preparation, review, or approval of the manuscript. Other authors have no disclosure.
Acknowledgments
The authors offer many thanks and wish to express their gratitude to Professor Stéphane Laurent, MD, PhD, FESC (Hôpital Européen Georges Pompidou, Department of Pharmacology) for his fruitful suggestions.
(J Am Heart Assoc. 2017;6:e005729 DOI: 10.1161/JAHA.117.005729.)28666991
References
- 1. Rodríguez‐Iturbe B, Pons H, Quiroz Y, Lanaspa MA, Johnson RJ. Autoimmunity in the pathogenesis of hypertension. Nat Rev Nephrol. 2014;10:56–62. [DOI] [PubMed] [Google Scholar]
- 2. Caillon A, Schiffrin EL. Role of inflammation and immunity in hypertension: recent epidemiological, laboratory, and clinical evidence. Curr Hypertens Rep. 2016;18:21. [DOI] [PubMed] [Google Scholar]
- 3. McMaster WG, Kirabo A, Madhur MS, Harrison DG. Inflammation, immunity, and hypertensive end‐organ damage. Circ Res. 2015;116:1022–1033. [DOI] [PMC free article] [PubMed] [Google Scholar]
- 4. Chen TH, Gona P, Sutherland PA, Benjamin EJ, Wilson PW, Larson MG, Vasan RS, Robins SJ. Long‐term C‐reactive protein variability and prediction of metabolic risk. Am J Med. 2009;122:53–61. [DOI] [PMC free article] [PubMed] [Google Scholar]
- 5. Egan BM, Zhao Y, Axon RN. US trends in prevalence, awareness, treatment, and control of hypertension, 1988–2008. JAMA. 2010;303:2043–2050. [DOI] [PubMed] [Google Scholar]
- 6. Sesso HD, Buring JE, Rifai N, Blake GJ, Gaziano JM, Ridker PM. C‐reactive protein and the risk of developing hypertension. JAMA. 2003;290:2945–2951. [DOI] [PubMed] [Google Scholar]
- 7. Wang TJ, Gona P, Larson MG, Levy D, Benjamin EJ, Tofler GH, Jacques PF, Meigs JB, Rifai N, Selhub J, Robins SJ, Newton‐Cheh C, Vasan RS. Multiple biomarkers and the risk of incident hypertension. Hypertension. 2007;49:432–438. [DOI] [PubMed] [Google Scholar]
- 8. Tomiyama H, Townsend RR, Matsumoto C, Kimura K, Odaira M, Yoshida M, Shiina K, Yamashina A. Arterial stiffness/central hemodynamics, renal function, and development of hypertension over the short term. J Hypertens. 2014;32:90–99. [DOI] [PubMed] [Google Scholar]
- 9. Takase H, Dohi Y, Toriyama T, Okado T, Tanaka S, Sonoda H, Kimura G. Evaluation of risk for incident hypertension using glomerular filtration rate in the normotensive general population. J Hypertens. 2012;30:505–512. [DOI] [PubMed] [Google Scholar]
- 10. Kaess BM, Rong J, Larson MG, Hamburg NM, Vita JA, Levy D, Benjamin EJ, Vasan RS, Mitchell GF. Aortic stiffness, blood pressure progression, and incident hypertension. JAMA. 2012;308:875–881. [DOI] [PMC free article] [PubMed] [Google Scholar]
- 11. Chen W, Li S, Fernandez C, Sun D, Lai CC, Zhang T, Bazzano L, Urbina EM, Deng HW. Temporal relationship between elevated blood pressure and arterial stiffening among middle‐aged black and white adults: The Bogalusa Heart Study. Am J Epidemiol. 2016;183:599–608. [DOI] [PMC free article] [PubMed] [Google Scholar]
- 12. Hashimoto H, Kitagawa K, Hougaku H, Etani H, Hori M. C‐reactive protein predicts carotid atherosclerosis progression in mild to moderate risk and middle‐aged patients. Clin Invest Med. 2006;29:77–82. [PubMed] [Google Scholar]
- 13. Fried L, Solomon C, Shlipak M, Seliger S, Stehman‐Breen C, Bleyer AJ, Chaves P, Furberg C, Kuller L, Newman A. Inflammatory and prothrombotic markers and the progression of renal disease in elderly individuals. J Am Soc Nephrol. 2004;15:3184–3191. [DOI] [PubMed] [Google Scholar]
- 14. Tomiyama H, Hashimoto H, Tanaka H, Matsumoto C, Odaira M, Yamada J, Yoshida M, Shiina K, Nagata M, Yamashina A. Continuous smoking and progression of arterial stiffening: a prospective study. J Am Coll Cardiol. 2010;55:1979–1987. [DOI] [PubMed] [Google Scholar]
- 15. Motobe K, Tomiyama H, Koji Y, Yambe M, Gulinisa Z, Arai T, Ichihashi H, Nagae T, Ishimaru S, Yamashina A. Cut‐off value of the ankle‐brachial pressure index at which the accuracy of brachial‐ankle pulse wave velocity measurement is diminished. Circ J. 2005;69:55–60. [DOI] [PubMed] [Google Scholar]
- 16. Yamashina A, Tomiyama H, Takeda K, Tsuda H, Arai T, Hirose K, Koji Y, Hori S, Yamamoto Y. Validity, reproducibility, and clinical significance of noninvasive brachial‐ankle pulse wave velocity measurement. Hypertens Res. 2002;25:359–364. [DOI] [PubMed] [Google Scholar]
- 17. Tomiyama H, Yamazaki M, Sagawa Y, Teraoka K, Shirota T, Miyawaki Y, Yamashina A. Synergistic effect of smoking and blood pressure on augmentation index in men, but not in women. Hypertens Res. 2009;32:122–126. [DOI] [PubMed] [Google Scholar]
- 18. Ockene IS, Matthews CE, Rifai N, Ridker PM, Reed G, Stanek E. Variability and classification accuracy of serial high‐sensitivity C‐reactive protein measurements in healthy adults. Clin Chem. 2001;47:444–450. [PubMed] [Google Scholar]
- 19. Matsuo S, Imai E, Horio M, Yasuda Y, Tomita K, Nitta K, Yamagata K, Tomino Y, Yokoyama H, Hishida A. Collaborators developing the Japanese equation for estimated GFR. Revised equations for estimated GFR from serum creatinine in Japan. Am J Kidney Dis. 2009;53:982–992. [DOI] [PubMed] [Google Scholar]
- 20. Horio M, Imai E, Yasuda Y, Watanabe T, Matsuo S. Modification of the CKD epidemiology collaboration (CKD‐EPI) equation for Japanese: accuracy and use for population estimates. Am J Kidney Dis. 2010;56:32–38. [DOI] [PubMed] [Google Scholar]
- 21. Yang J, Zaitlen NA, Goddard ME, Visscher PM, Price AL. Advantages and pitfalls in the application of mixed‐model association methods. Nat Genet. 2014;46:100–106. [DOI] [PMC free article] [PubMed] [Google Scholar]
- 22. Cecelja M, Chowienczyk P. Dissociation of aortic pulse wave velocity with risk factors for cardiovascular disease other than hypertension: a systematic review. Hypertension. 2009;54:1328–1336. [DOI] [PubMed] [Google Scholar]
- 23. Echouffo‐Tcheugui JB, Batty GD, Kivimäki M, Kengne AP. Risk models to predict hypertension: a systematic review. PLoS ONE. 2013;8:e67370. [DOI] [PMC free article] [PubMed] [Google Scholar]
- 24. Pietri P, Vyssoulis G, Vlachopoulos C, Zervoudaki A, Gialernios T, Aznaouridis K, Stefanadis C. Relationship between low‐grade inflammation and arterial stiffness in patients with essential hypertension. J Hypertens. 2006;24:2231–2238. [DOI] [PubMed] [Google Scholar]
- 25. Vlachopoulos C, Dima I, Aznaouridis K, Vasiliadou C, Ioakeimidis N, Aggeli C, Toutouza M, Stefanadis C. Acute systemic inflammation increases arterial stiffness and decreases wave reflections in healthy individuals. Circulation. 2005;112:2193–2200. [DOI] [PubMed] [Google Scholar]
- 26. Kullo IJ, Seward JB, Bailey KR, Bielak LF, Grossardt BR, Sheedy PF II, Peyser PA, Turner ST. C‐reactive protein is related to arterial wave reflection and stiffness in asymptomatic subjects from the community. Am J Hypertens. 2005;18:1123–1129. [DOI] [PubMed] [Google Scholar]
- 27. Nakhai‐Pour HR, Grobbee DE, Bots ML, Muller M, van der Schouw YT. C‐reactive protein and aortic stiffness and wave reflection in middle‐aged and elderly men from the community. J Hum Hypertens. 2007;21:949–955. [DOI] [PubMed] [Google Scholar]
- 28. Tomiyama H, Yamashina A, Arai T, Hirose K, Koji Y, Chikamori T, Hori S, Yamamoto Y, Doba N, Hinohara S. Influences of age and gender on results of noninvasive brachial‐ankle pulse wave velocity measurement—a survey of 12 517 subjects. Atherosclerosis. 2003;166:303–309. [DOI] [PubMed] [Google Scholar]
- 29. Woloshin S, Schwartz LM. Distribution of C‐reactive protein values in the United States. N Engl J Med. 2005;352:1611–1613. [DOI] [PubMed] [Google Scholar]
- 30. AlGhatrif M, Strait JB, Morrell CH, Canepa M, Wright J, Elango P, Scuteri A, Najjar SS, Ferrucci L, Lakatta EG. Longitudinal trajectories of arterial stiffness and the role of blood pressure: the Baltimore Longitudinal Study of Aging. Hypertension. 2013;62:934–941. [DOI] [PMC free article] [PubMed] [Google Scholar]
- 31. Tomiyama H, Yamashina A. Non‐invasive vascular function tests: their pathophysiological background and clinical application. Circ J. 2010;74:24–33. [DOI] [PubMed] [Google Scholar]
- 32. Mitchell GF. Arterial stiffness and hypertension: chicken or egg? Hypertension. 2014;64:210–214. [DOI] [PMC free article] [PubMed] [Google Scholar]
- 33. Zieman SJ, Melenovsky V, Kass DA. Mechanisms, pathophysiology, and therapy of arterial stiffness. Arterioscler Thromb Vasc Biol. 2005;25:932–943. [DOI] [PubMed] [Google Scholar]
- 34. Kaysen GA, Levin NW, Mitch WE, Chapman AL, Kubala L, Eiserich JP. Evidence that C‐reactive protein or IL‐6 are not surrogates for all inflammatory cardiovascular risk factors in hemodialysis patients. Blood Purif. 2006;24:508–516. [DOI] [PubMed] [Google Scholar]
- 35. Ridker PM, Lüscher TF. Anti‐inflammatory therapies for cardiovascular disease. Eur Heart J. 2014;35:1782–1791. [DOI] [PMC free article] [PubMed] [Google Scholar]
- 36. Lavie CJ, Arena R, Swift DL, Johannsen NM, Sui X, Lee DC, Earnest CP, Church TS, O'Keefe JH, Milani RV, Blair SN. Exercise and the cardiovascular system: clinical science and cardiovascular outcomes. Circ Res. 2015;117:207–219. [DOI] [PMC free article] [PubMed] [Google Scholar]
- 37. Fok H, Cruickshank JK. Future treatment of hypertension: shifting the focus from blood pressure lowering to arterial stiffness modulation? Curr Hypertens Rep. 2015;17:67. [DOI] [PubMed] [Google Scholar]
- 38. Hashimoto J, O'Rourke MF. C‐reactive protein and cardiovascular disease: are we looking in the right direction? J Hypertens. 2006;24:2115. [DOI] [PubMed] [Google Scholar]