

Abstract
A fluorescence microscopy technique has been developed to visualize the behavior of individual DNA and protein molecules. Real-time direct observation of a single DNA molecule can be used to investigate the dynamics of DNA–protein interactions, such as the DNA digestion reaction by λ exonuclease. In conventional methods it is impossible to analyze the dynamics of an individual λ exonuclease molecule on a DNA because they can only observe the average behavior of a number of exonuclease molecules. Observation of a single molecule, on the other hand, can reveal processivity and binding rate of an individual exonuclease molecule. To evaluate the dynamics of λ exonuclease, a stained λ DNA molecule with one biotinylated terminal was fixed on an avidin-coated coverslip and straightened using a d.c. electric field. Microscopic observation of digestion of a straightened DNA molecule by λ exonuclease revealed that the DNA digestion rate was ∼1000 bases/s and also demonstrated high processivity.
INTRODUCTION
The DNA exonuclease encoded by bacteriophage λ, λ exonuclease, is involved in phage DNA recombination and repair (1–4). In the presence of Mg2+ and a 5′-terminal phosphate group, λ exonuclease releases 5′-monodeoxyribonucleotides and produces non-hydrolyzed single-stranded DNA by digesting the other strand of double-stranded DNA in the 5′→3′ direction (2–4).
In recent years X-ray diffraction analysis revealed that λ exonuclease forms homotrimers of toroidal structure (5,6). It is reported that the substrate DNA is held by passing through the center of the toroid during DNA digestion, which accounts for the high processivity (>3000 bp) of λ exonuclease (7). The digestion rate of λ exonuclease has been estimated by several methods. Little (4) measured the amount of deoxyribonucleotide released by λ exonuclease. He estimated that the digestion rate of λ exonuclease was >10 nt/s. This result, however, was obtained from indirect observation of an averaged phenomenon across a large number of DNA molecules. This method can determine only ‘overall’ digestion rate. On the other hand, observation of a single molecule can analyze processivity and the binding rate of exonuclease individually. Therefore, direct observation of a single DNA molecule is essential to determine the proper digestion rate.
In real-time observations based on fluorescence microscopy DNA molecules are stained with a fluorescent dye. Some fluorescent dyes, however, notably inhibit several interactions between DNA and protein involved in transcription, replication, repair and digestive enzyme reactions, etc. (8–10). Therefore, the effect of the fluorescent dye on DNA digestion by λ exonuclease should be examined.
It is essential for a single molecule direct observation system to control the position of the DNA molecules in solution. Several combing techniques for fixation and stretching of DNA molecules have been developed. For example, DNA molecules can be straightened by solution flow on 3-aminopropyl-triethoxysilanated (11) or polylysine-coated glass surfaces (12), by dielectrophoresis (13) and by optical trapping of avidin-coated beads conjugated to both biotinylated termini of DNA (14). To observe one-way DNA digestion by λ exonuclease under a fluorescence microscope, we used a λ DNA molecule with one biotinylated terminus fixed on an avidin-coated coverslip surface and straightened by applying a d.c. electric field.
MATERIALS AND METHODS
Electrophoretic analysis
Bacteriophage λ DNA was purchased from Nippon Gene. λ DNA molecules (48.5 kb) were stained with the bis-intercalating fluorescent dye YOYO-1 iodide (YOYO-1, the dimer of the asymmetrical cyanine dye oxazole yellow, YO) (Y-3601; Molecular Probes Inc.) at several concentrations (YOYO-1:nucleotide pair ∼ 1:200–2:1). The stained DNA molecules (784 ng) were incubated in 67 mM glycine–KOH, pH 9.4, 2.5 mM MgCl2, 50 µg/ml bovine serum albumin with 7.84 U λ exonuclease (Gibco BRL Life Technologies) for 5 min at 37°C in 16 µl. An aliquot of 4 µl of CH3COONa buffer, pH 4.0, containing 7.84 U mung bean nuclease (Takara), NaCl, (CH3COO)2Zn and glycerol was added to adjust the final pH and concentrations to 40 mM CH3COONa, pH 5.0, 100 mM NaCl, 1 mM (CH3COO)2Zn, 10% glycerol. Incubation was for 10 min at 37°C. The reaction was terminated by adding 2.2 µl of the gel loading buffer containing EDTA (0.1% Bromophenol Blue, 1% SDS, 50% glycerol, 0.1 M EDTA, pH 7.5). The digestion products were analyzed by 0.8% agarose gel electrophoresis in 1× TAE.
Preparation of terminal biotin-labeled λ concatemers
Concatemers of λ DNA were constructed with T4 ligase (Nippon Gene) in ligation buffer. The sample was incubated overnight at 16°C, heated to 65°C for 5 min and then chilled on ice. The construction of λ concatemers was confirmed by pulsed field gel electrophoresis (data not shown). One terminus of the λ concatemer was biotinylated as follows. The recessed end of the DNA (r-strand) was filled-in with three deoxyribonucleoside triphosphates, dATP, dGTP and biotin-21-dUTP (Clontech), using T4 DNA polymerase (Takara). Biotinylation was performed for 30 min at 37°C, heated to 65°C for 10 min and then chilled on ice. Biotinylated DNA was dialyzed against TE buffer (10 mM Tris–HCl, pH 8.0, 1 mM EDTA) three times to remove free biotin (15).
Preparation of the avidin–biotin coverslips
Avidin-coated coverslips were prepared as reported by Lee and Swaisgood (16) with some modifications. A coverslip (18 × 18 mm; Matsunami) was soaked in 1% (w/v) contaminon alkaline detergent (Wako) overnight at room temperature and then washed with acetone and then deionized water. The coverslip was rinsed in 30% hydrogen peroxide for at least 3 h and then washed with deionized water and blown with dry air. After cleaning of the glass surface as described above, the coverslip was soaked in 10% 3-aminopropyltriethoxysilane (A3648; Sigma) for 1 h at room temperature, washed with deionized water and then baked overnight at 100°C after blowing off the water with dry air. The aminosilanized coverslip was biotinylated with 0.5 mg/ml sulfosuccinimidyl N-[N′-(d-biotinyl)-6-aminohexanoyl]-6′-aminohexanoate (Suifo-Osu, Dojindo) dissolved in 50 mM sodium bicarbonate buffer, pH 8.6. Biotinylation was performed gently overnight at 4°C on a shaker and washed first with 2 M urea, 2 M sodium chloride and then 50 mM sodium phosphate buffer, pH 7.0, containing 0.02% (w/v) sodium azide. The biotinylated coverslip was treated with 20 µg/ml streptavidin (Sigma) in 50 mM sodium phosphate buffer, pH 6.0, containing 0.9% (w/v) sodium chloride overnight at 4°C on a gentle shaker. The avidin–biotin-coated coverslip was rinsed by the same washing procedure as the biotinylated coverslip and stored in 50 mM sodium phosphate buffer, pH 7.0, containing 0.02% (w/v) sodium azide at 4°C.
DNA straightening using a d.c. electric field
A terminally biotinylated λ concatemer fixed on a streptavidin-coated coverslip can be straightened along an electric flux line as shown in Figure 1 (17). Since the phosphoribose backbone of DNA molecules is negatively charged, one-way DNA straightening can be achieved by applying a d.c. electric field. A d.c. voltage <10 V was applied to aluminum electrodes with a gap of 10 mm. The application of low voltage d.c. prevented bubbling due to electrolysis in the reaction buffer.
Figure 1.

Schematic illustration of fixation and straightening of a single DNA molecule on a coverslip. The biotinylated coverslip was coated with streptavidin. One biotinylated terminus of λ DNA was fixed on the glass surface and then the DNA was straightened in a d.c. electric field (E).
Optical system for visualization of DNA molecules
Figure 2 shows the optical set-up. DNA molecules were observed using a fluorescence microscope (Axioplan; Carl Zeiss) equipped with a 100×, 1.3 numerical aperture (NA) oil immersion objective lens and with a high sensitivity silicon-intensified target (SIT) camera (C2400-8; Hamamatsu Photonics). Fluorescent images of DNA molecules stained with YOYO-1, which can be excited by light at 491 nm wavelength and emits at 509 nm, were recorded by a digital video cassette recorder (WV-D700; Sony). The DNA solution was supplemented with an anti-fade agent containing 2.3 mg/ml d-(+)-glucose, 0.1 mg/ml glucose oxidase, 18 µg/ml catalase and 20 mM 2-mercaptoethanol to suppress photobleaching. The digest length of the DNA molecules was measured with an image processor (Argus-10; Hamamatsu Photonics).
Figure 2.

Schematic diagram of the optical system equipped with a d.c. power supply for straightening a single DNA molecule. Aluminum tapes were used as electrodes. Excitation light (491 nm) was selected by an excitation filter and then introduced through a dichroic mirror. The emission signal was selected by an emission filter and then introduced into a high sensitivity SIT camera. To protect the SIT camera from excitation light leakage, a barrier filter was also installed in front of the SIT camera. A single DNA molecule was stretched and fixed on a coverslip by a d.c. electric field.
DNA digestion by λ exonuclease under a fluorescence microscope field
The reaction mixture contained 560 ng/ml terminally biotin-labeled λ concatemers, 17 nM DNA staining dye YOYO-1, 67 mM glycine–KOH, pH 9.4, 50 µg/ml bovine serum albumin, 49 U/µl λ exonuclease and the anti-fade agent described above. After loading the reaction mixture on a 24 × 60 mm coverslip (Matsunami), the mixture was covered with an avidin-coated glass. λ concatemers were straightened by applying a d.c. voltage between aluminum electrodes. Digestion of DNA molecules by λ exonuclease was started by adding a solution of magnesium chloride to 1 mM final concentration. The reaction was carried out at room temperature.
RESULTS
Effect of the fluorescent dye YOYO-1 on DNA digestion by λ exonuclease
Figure 3 shows the effects of the intercalating dye YOYO-1 on digestion of λ DNA molecules by λ exonuclease. An increase in concentration of the fluorescent dye brought about a marked inhibition of DNA digestion compared with a non-dye control. DNA digestion was inhibited when the YOYO-1 concentration was higher than a dye:nucleotide pair molar ratio of 1:10 (Fig. 3, lanes 1–3). In addition, the digested molecules migrated in the opposite direction when the YOYO-1 concentration was higher than a dye:nucleotide pair molar ratio of 1:1 (Fig. 3, lanes 1 and 2). In the preliminary experiments we observed reverse migration of DNA fragments in the presence of high concentrations of YOYO-1 even if λ exonuclease was not included (data not shown). On the other hand, when the YOYO-1 concentration was lower than a dye:nucleotide pair molar ratio of 1:20 (Fig. 3, lanes 4–7), smeared digestion products were observed, as for unstained DNA, showing that DNA digestion was not inhibited under these conditions.
Figure 3.
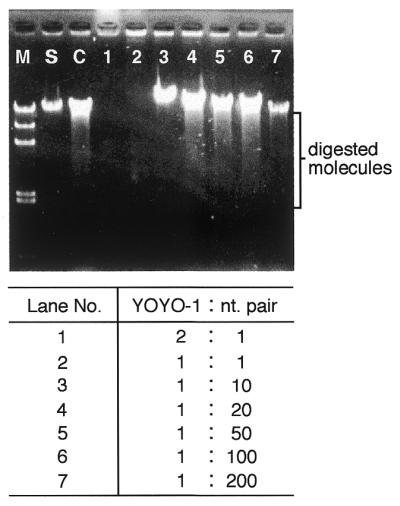
Effect of YOYO-1 dye on DNA digestion by λ exonuclease. The digested molecules were analyzed using agarose gel electrophoresis. Different YOYO-1 dye concentrations were tested in increasing order from lane 7 to lane 1 and are shown in molar ratio as YOYO-1:nt pair. M, λ/HindIII digest (kb), 0.6, 2.0, 2.3, 4.4, 6.6, 9.4 and 23.1; S, λ DNA marker, 48.5 kb; C, digested molecules in the absence of YOYO-1 dye.
Direct observation of the digestion of a single DNA molecule by λ exonuclease
Sequential photographs of the real-time observation of DNA digestion by λ exonuclease are shown in Figure 4. λ DNA molecules were stained with YOYO-1 at a dye:nucleotide pair molar ratio of 1:50, under which condition DNA digestion by λ exonuclease was not inhibited (Fig. 3, lane 5) and DNA molecules were clearly visualized (data not shown). A terminally biotinylated λ concatemer was fixed on a coverslip and straightened in the right to left direction under a d.c. electric field (Fig. 4a). The length of the straightened DNA molecule was >16.5 µm. Digestion of the DNA molecule by λ exonuclease was started by adding a solution of magnesium chloride (Fig. 4b). Fluorescently stained DNA shortening was observed in real time (Fig. 4b–e). The fluorescent DNA image gradually reduced in length with time and finally disappeared (Fig. 4f).
Figure 4.

Real-time visualization of a fluorescently stained DNA digest by λ exonuclease. The single λ DNA molecule was straightened by applying a d.c. voltage (a). Sequential photographs of DNA digestion at 0 (b), 10 (c), 30 (d), 40 (e) and 50 s (f). Crosses indicate the original position of the free terminus of DNA straightened before starting the DNA digestion reaction.
Figure 5 shows the time course of shortening of the digested DNA molecule for two samples. The length of the digested DNA molecule in Figure 4 shortened in proportion to reaction time (closed circles). The calculated digestion rate of λ exonuclease hydrolysis of the DNA molecule was ∼1000 bases/s. Although the other sample indicated a similar digestion rate, the length of the digested DNA molecule was constant after 35 s (open circles).
Figure 5.

Time course of digest length of the DNA molecule. Two typical DNA samples are shown. The data in Figure 4 correspond to the closed circles.
DISCUSSION
We have developed a new direct observation system for analyzing the interaction between a single DNA molecule and λ exonuclease under a fluorescence microscope. The conventional analysis of DNA digestion rate by λ exonuclease was based on determination of the number of nucleotides released from DNA fragments labeled uniformly with 32P (4). It should be noted that, for example, if binding of λ exonuclease to the DNA molecule is a rate-determining factor, DNA digestion rate must be underestimated by the conventional method. This is one possible reason for the high digestion rate observed in our study.
In this report we first present the effect of the intercalating fluorescent dye YOYO-1 on DNA digestion by λ exonuclease (Fig. 3). At a high concentration of the dye, DNA digestion was inhibited. This may be attributed to an alteration in the DNA conformation due to binding of the intercalating dye. Moreover, the electrophoretic mobility of the DNA decreased with increasing the amount of YOYO-1. It is known that DNA molecules stained with a larger amount of dye show slower migration (18). When the YOYO-1 concentration was higher than a dye:nucleotide pair molar ratio of 1:1, the digested molecules migrated toward the negative electrode, because the positive charge of YOYO-1 canceled out the negative charge of the phosphoribose backbone with excess YOYO-1. On the other hand, when the YOYO-1 concentration was lower than a dye:nucleotide pair molar ratio of 1:20, we showed that λ exonuclease digested the DNA molecules in the same way as unstained DNA. In recent years an inhibitory effect of an intercalating dye (8) in microscopic observations (19) on DNA digestion by exonuclease III has been reported. However, the efficient dye concentration for visualizing digestion of fluorescently stained DNA has not yet been studied. Furthermore, fluorescent dyes can interfere with stable observation by photocleavage of DNA. Individual DNA molecules stained with YOYO-1 can be clearly visualized due to the extremely low background fluorescence in comparison with ethidium bromide; however, YOYO-1 sometimes causes strand breakage of DNA in collaboration with photogenerated active oxygen species. Akerman and Tuite (20) have demonstrated that excess dye on DNA molecules can cause efficient photocleavage. This photocleavage was attributed to attack by the dye on the phosphoribose backbone. In our investigation we found that a YOYO-1:nucleotide pair molar ratio of 1:50 was suitable for observation of DNA digestion by λ exonuclease. Individual DNA molecules stained at the above dye concentrations were clearly observed and were digested by λ exonuclease without apparent inhibition.
λ concatemers fixed at one end on coverslips showed various lengths as a consequence of shearing of the DNA during pipetting. It seems that the DNA shown in Figure 4 was sheared in advance or, probably, that the λ monomer was extended by intercalation of YOYO-1. Since digestion of DNA by λ exonuclease caused dissociation of the dye from single-stranded DNA, fluorescently stained DNA shortening was observed. Recoil of the DNA molecule may bring about shortening of the fluorescent image (21), but in this case DNA can be straightened by applying a d.c. voltage. However, no further straightening of the DNA was observed. Consequently, it can be said that shortening of the DNA image was completely attributable to DNA length shortening. In our experiment the length of the digested λ DNA was proportional to the reaction time, as shown in Figure 5. This is consistent with high processivity of λ exonuclease. Interestingly, digestion of certain single DNA molecules by λ exonuclease was stopped halfway through the direct observations (Fig. 5, open circles). λ exonuclease is unable to initiate digestion of λ DNA at nicks, even though it could bind to them (7). Therefore, the enzyme might be inactivated or released from the DNA at the position of a nick. We in fact observed more DNA samples, but they were incomplete in the sense that, for instance, they had been expelled of the microscope field during observation due to unavoidable bubbling caused by electrolysis and for other reasons. The new technique we propose for real-time observation of the interaction between a single DNA molecule and an enzyme based on in situ fluorescence microscopy has elucidated the dynamic behavior of an individual enzyme molecule on a single DNA molecule.
Acknowledgments
ACKNOWLEDGEMENTS
We would like to thank Dr M. Ishikawa of the Joint Research Center for Atom Technology (JRCAT). This research was partially supported by the Angstrom Technology Partnership of JRCAT and a Grant-in-Aid for Scientific Research (no. 10638) from the Japan Society for the Promotion of Science (JSPS) Research Fellowships for Young Scientists.
References
- 1.Linn S.M., Lloyd,R.S. and Roverts,R.J. (1993) Nucleases, 2nd Edn. Cold Spring Harbor Laboratory Press, Cold Spring Harbor, NY.
- 2.Radding C.M. (1966) Regulation of λ exonuclease: I. Properties of λ exonuclease purified from lysogens of λ T11 and wild type. J. Mol. Biol., 18, 235–250. [DOI] [PubMed] [Google Scholar]
- 3.Little J.W., Lehman,I.R. and Kaiser,A.D. (1967) An exonuclease induced by bacteriophage λ: I. Preparation of the crystalline enzyme. J. Biol. Chem., 242, 672–678. [PubMed] [Google Scholar]
- 4.Little J.W., (1967) An exonuclease induced by bacteriophage λ: II. Nature of the enzymatic reaction. J. Biol. Chem., 242, 679–686. [PubMed] [Google Scholar]
- 5.Kovall R. and Matthews,B.W. (1998) Toroidal structure of λ-exonuclease. Science, 277, 1824–1827. [DOI] [PubMed] [Google Scholar]
- 6.Kovall R.A. and Matthews,B.W. (1998) Structural, functional and evolutionary relationships between λ-exonuclease and the type II restriction endonucleases. Proc. Natl Acad. Sci. USA, 95, 7893–7897. [DOI] [PMC free article] [PubMed] [Google Scholar]
- 7.Carter D.M. and Radding,C.M. (1971) The role of exonuclease and β protein of phage λ in genetic recombination. J. Mol. Biol., 246, 2502–2512. [PubMed] [Google Scholar]
- 8.Parolin C., Montecucco,A., Ciarrocchi,G., Pedrali-Noy,G., Valisena,S., Palumbo,M. and Palu,G. (1990) The effect of the minor groove binding agent DAPI (2-amidino-diphenyl-indole) on DNA-directed enzymes: an attempt to explain inhibition of plasmid expression in Escherichia coli. FEMS Microbiol. Lett., 68, 341–346. [DOI] [PubMed] [Google Scholar]
- 9.Meng X., Cai,W. and Schwartz,D.C. (1996) Inhibition of restriction endonuclease activity by DNA binding fluorochromes. J. Biomol. Struct. Dyn., 13, 945–951. [DOI] [PubMed] [Google Scholar]
- 10.Hirano K., Matsuura,S., Matsuzawa,Y., Katsura,S. and Mizuno,A. (1999) Restriction enzyme reaction in µm-sized area using local temperature control technique by laser irradiation. Thermal Sci. Eng., 7, 11–21. [Google Scholar]
- 11.Yokota H., Johnson,F., Lu,H., Robinson,R.M., Belu,A.M., Garrison,M.D., Ratner,B.D., Trask,B.J. and Miller,D.L. (1997) A new method for straightening DNA molecules for optical restriction mapping. Nucleic Acids Res., 25, 1064–1070. [DOI] [PMC free article] [PubMed] [Google Scholar]
- 12.Lyon W.A., Fang,M.M., Haskins,W.E. and Nie,S. (1998) A dual-beam optical microscope for observation and cleavage of single DNA molecules. Anal. Chem., 70, 1743–1748. [DOI] [PubMed] [Google Scholar]
- 13.Kabata H., Kurosawa,O., Arai,I., Washizu,M., Magarson,S.A., Glass,R.E. and Shimamoto,N. (1993) Visualization of single molecules of RNA polymerase sliding along DNA. Science, 262, 1561–1563. [DOI] [PubMed] [Google Scholar]
- 14.Harada Y., Funatsu,T., Murakami,K., Nonoyama,Y., Ishihama,A. and Yanagida,T. (1999) Single-molecule imaging of RNA polymerase–DNA interactions in real time. Biophys. J., 76, 709–715. [DOI] [PMC free article] [PubMed] [Google Scholar]
- 15.Zimmermann R.M. and Cox,E.C. (1994) DNA stretching on functionalized gold surfaces. Nucleic Acids Res., 22, 492–497. [DOI] [PMC free article] [PubMed] [Google Scholar]
- 16.Lee P. and Swaisgood,H.E. (1997) Characterization of a chemically conjugated lipase bioreactor. J. Agric. Food Chem., 45, 3350–3356. [Google Scholar]
- 17.Hirano K., Matsuzawa,Y., Yasuda,H., Katsura,S. and Mizuno,A. (1999) Orientation control, cutting in order and recovery of single DNA molecules using the electric effect inside channels on a glass substrate. J. Capillary Electrophor. Microchip Technol., 6, 13–17. [Google Scholar]
- 18.Carlsson C., Jonsson,M. and Akerman,B. (1995) Double bands in DNA gel electrophoresis caused by bis-intercalating dyes. Nucleic Acids Res., 23, 2413–2420. [DOI] [PMC free article] [PubMed] [Google Scholar]
- 19.Tachiri Y., Ishikawa,M. and Hirano,K. (2000) Investigation of the hydrolysis of single DNA molecules using fluorescence video microscopy. Anal. Chem., 72, 1649–1656. [DOI] [PubMed] [Google Scholar]
- 20.Akerman B. and Tuite,E. (1996) Single- and double-strand photocleavage of DNA by YO, YOYO and TOTO. Nucleic Acids Res., 24, 1080–1090. [DOI] [PMC free article] [PubMed] [Google Scholar]
- 21.Perkins T.T., Quake,S.R., Smith,D.E. and Chu,S. (1994) Relaxation of a single DNA molecule observed by optical microscopy. Science, 264, 822–826. [DOI] [PubMed] [Google Scholar]