

Abstract
Background
Obesity may increase heart failure risk through cardiac remodeling. Cross‐sectional associations between adiposity and cardiac structure and function have been elucidated, but the impact of longitudinal changes in adiposity on cardiac remodeling is less well understood.
Methods and Results
Participants in the Dallas Heart Study without cardiovascular disease or left ventricular dysfunction underwent assessment of body weight, anthropometrics, and cardiac magnetic resonance imaging at baseline and 7 years later. Associations between changes in indices of generalized and central adiposity with changes in left ventricular mass, volume, mass/volume ratio (concentricity), wall thickness, and ejection fraction were assessed using multivariable linear regression. The study cohort (n=1262) mean age was 44 years with 57% women, 44% black, and 36% obese participants. At follow‐up, 41% had ≥5% weight gain, and 15% had ≥5% weight loss. Greater weight gain was associated with younger age, lower risk factor burden, and lower body mass index at baseline. In multivariable models adjusting for age, sex, race, comorbid conditions at baseline and follow‐up, baseline adiposity, and cardiac measurement, increasing weight was associated with increases in left ventricular mass (β=0.10, P<0.0001), wall thickness (β=0.10, P<0.0001), and concentricity (β=0.06, P=0.002), with modest effects on end‐diastolic volume (β=0.04, P=0.044) and ejection fraction (β=0.05, P=0.046). Similar results were seen with other adiposity indices.
Conclusions
Concentric left ventricular remodeling is the predominant phenotype linked to increasing adiposity in middle age. Our findings support the importance of weight management to prevent secular changes in adiposity, concentric remodeling, and eventual heart failure over time.
Keywords: adipose tissue, body mass index, cardiac remodeling, dual x‐ray absorptiometry, magnetic resonance imaging, obesity, visceral adipose tissue, waist circumference
Subject Categories: Obesity, Magnetic Resonance Imaging (MRI), Remodeling, Epidemiology, Risk Factors
Clinical Perspective
What Is New?
This study investigates the impact of longitudinal changes in several indices of adiposity and their association with measures of cardiac remodeling assessed by magnetic resonance imaging in a large, multiethnic cohort of adults over 7 years of follow‐up.
What Are the Clinical Implications?
Both increasing generalized and central adiposity over time were associated with concentric cardiac remodeling independent of baseline adiposity, suggesting that maintaining weight stability and avoidance of weight gain may be an important preventative strategy to prevent pathologic cardiac remodeling.
Introduction
The relationship of obesity with cardiovascular diseases (CVDs) is well established,1, 2, 3 but the cardiac structural changes underlying the disease processes are less well understood. Historically, obesity was thought to result in increased left ventricle (LV) mass and cavity size as a compensatory response to volume overload, leading to eventual eccentric remodeling.4 However, more recent data have suggested that increased adiposity is associated with concentric LV remodeling characterized by increased mass‐to‐volume ratio (concentricity), LV wall thickness, and eventual diastolic dysfunction.5 These structural abnormalities may lead to an increased risk for symptomatic heart failure (HF), especially HF from concentric LV remodeling and diastolic dysfunction, which is strongly associated with excess adiposity and is increasing in prevalence.6, 7, 8
Traditionally, body mass index (BMI) has been the recommended adiposity‐related biomarker for identifying individuals at increased risk for CVD, type 2 diabetes mellitus, and all‐cause mortality.1 However, there are several limitations of BMI that have been recently described.9 Although higher BMI clearly identifies individuals at increased risk of mortality, those who are only mildly obese may have lower or similar mortality compared with normal‐weight individuals.10, 11 Additionally, BMI has never been incorporated into traditional CVD risk scores including Framingham12 or the Pooled Cohort Equation because it has not been shown to identify increased risk over traditional risk factors.13 We previously found stronger correlations between waist circumference (WC) and index of central obesity with abdominal visceral adipose tissue (VAT) in a randomized trial.14 In the Dallas Heart Study, the correlation between BMI and a direct imaging‐based assessment of VAT is ρ=0.58 compared with WC and VAT (ρ=0.73). Among those with obesity, the correlation between BMI and VAT is even lower (ρ=0.12). Further studies have shown that WC is a better predictor than BMI of total body fat, which is correlated with multiple metabolic risk factors.15 Because of the limitations of BMI, it is imperative to evaluate the relationship between alternative indices representing centralized adiposity and cardiac morphology and function.
Previous studies have primarily examined the cross‐sectional relationship between measures of adiposity and cardiac morphology.2, 5, 16, 17 These static measurements do not permit evaluation of the dynamic impact of body mass and fat distribution changes on alterations in cardiac structure and function over time, which may be critical determinants for HF risk. Although weight loss has been associated with decreases in LV mass and concentricity by cardiac magnetic resonance imaging,18 data on longitudinal changes in broader metrics of adiposity and their effects on multiple aspects of cardiac remodeling remain limited. Therefore, we investigated the longitudinal impact of changes in multiple indices of adiposity (both generalized and central) with magnetic resonance imaging (MRI) measures of LV mass and end‐diastolic volume, concentricity (mass‐to‐volume), wall thickness, and ejection fraction (EF) over ≈7 years of follow‐up in a large, multiethnic cohort of adults without clinical heart failure or LV dysfunction.
Methods
Study Population
The Dallas Heart Study (DHS) is a multiethnic population‐based cohort study of Dallas county adults with intentional oversampling of blacks. Detailed methods of the DHS have been described previously.19 A participant flow diagram for the current study is provided in Figure 1. Briefly, between 2000 and 2002, participants underwent multimodality imaging including detailed assessments of body composition, indices of fat distribution, and measures of cardiac structure and function. All measures were repeated between 2007 and 2008. For the present study, participants with prevalent CVD (defined as self‐reported coronary heart disease, ischemic stroke, transient ischemic attack, or clinical HF), asymptomatic LV dysfunction (LVEF <50%), human immunodeficiency virus infection, cancer diagnosis, chronic kidney disease at baseline, or missing imaging data at baseline or follow‐up were excluded, yielding a final sample size of 1262. There were no significant differences in age, sex, or race between those included and those excluded in this study. Participants provided written informed consent, and the protocol was approved by the Institutional Review Board of the University of Texas Southwestern Medical Center.
Figure 1.
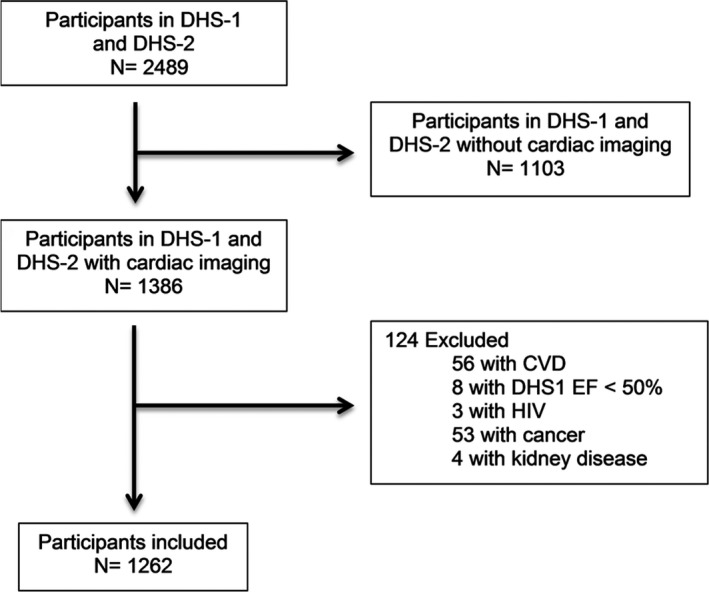
Flow diagram of selection of study participants. CVD indicates cardiovascular disease; DHS, Dallas Heart Study; HIV, human immunodeficiency virus.
Demographics, lifestyle, and other risk factors were determined from a baseline questionnaire. Ethnicity was self‐assigned in accordance with US census categories. Hypertension was defined as BP ≥140/90 mm Hg or taking antihypertensive medication(s). Diabetes mellitus was defined as a fasting serum glucose ≥126 mg/dL, self‐reported diabetes mellitus, or taking hypoglycemic medication. Hypercholesterolemia was defined as a calculated low‐density lipoprotein cholesterol ≥160 mg/dL on a fasting sample, direct low‐density lipoprotein cholesterol ≥160 mg/dL on a nonfasting sample, total cholesterol ≥240 mg/dL, or use of statin medication. Smoking was defined as cigarette use within the previous 30 days and/or a lifetime history of having smoked ≥100 cigarettes. Alcohol use was determined in grams/week by self‐report. Physical activity was derived using self‐reported frequency and type of leisure‐time physical activity and a standard conversion for metabolic equivalence units. The homeostasis model assessment of insulin resistance index was calculated with the following: (fasting insulin [μIU/mL]×fasting glucose [mmol/L]) divided by 22.5.20 High‐sensitivity C‐reactive protein, cardiac troponin T, and N‐terminal pro‐B‐type natriuretic peptide were measured as previously described.21 Interval development of comorbid conditions was determined from self‐report, medication history, clinical assessment, and hospital records reporting and was adjudicated by a clinical end point committee.
Body Weight and Indices of Fat Distribution
Weight and height were measured by standard scales. BMI was calculated as weight (kilograms) divided by the square of height (meters). WC was measured 1 cm above the iliac crest, and hip circumference was measured at the widest circumference of the buttocks at the area of the greater trochanters. Waist‐hip ratio was calculated as the ratio of WC/hip circumference. The index of central obesity, constructed to account for race‐ and sex‐specific cutoffs for WC reflecting variability in average heights in these populations, was calculated as WC (cm) divided by height (cm).22 Visceral adiposity index was calculated by (WC/39.68)+(1.88×BMI)×(Triglycerides/1.03)×(1.31/high‐density lipoprotein cholesterol) for men and (WC/36.58)+(1.89×BMI)×(TG/0.81)×(1.52/high‐density lipoprotein cholesterol) for women.23 Obesity was defined as a BMI ≥30 kg/m2. Allometric height was defined as height (m)2.7.
Measures of Cardiac Structure and Function
Details of cardiac magnetic resonance imaging have been previously described for baseline imaging24, 25 and more recently described for follow‐up imaging.26 In brief, cardiac magnetic resonance imaging was performed using 1 of 2 comparable 1.5‐Tesla systems (Philips Medical System, Best, The Netherlands) at baseline and a 3‐Tesla system (Achieva, Philips Medical Systems, Best, The Netherlands) at follow‐up. At both time points, cine images were acquired using short‐axis, breath‐hold, prospective electrocardiogram‐gated turbo field echo. Baseline and follow‐up mass and volume measurements were normalized to a phantom, which was imaged on the 1.5‐T and 3‐T MRI systems. All images taken from both baseline and follow‐up time points were analyzed during the same period with a standardized analysis protocol using QMass software (Medis, Medical Imaging Systems, Leiden, The Netherlands). LV mass, LV end‐diastolic volume, LV wall thickness, and LVEF reported here were calculated from short‐axis sequences, where papillary muscles were included in LV mass and excluded from LV volume.26 There was no difference in interstudy reproducibility (test/retest) between the baseline and follow‐up studies done at different field strengths.27 Concentricity was defined as LV mass (g) divided by LV volume (mL).
Statistical Analysis
Participants were stratified into 5 categories based on clinically meaningful thresholds of weight change1 defined as net change in weight from baseline to follow‐up: >10% weight loss, 5% to 10% weight loss, <5% weight loss or gain, 5% to 10% weight gain, and >10% weight gain. Baseline characteristics were compared across groups using chi‐squared tests for dichotomous variables and Wilcoxon rank‐sum tests for continuous variables. Histograms were constructed to assess the distribution of change in measures of cardiac structure and function from baseline to follow‐up across categories of weight and waist circumference change. Multivariable linear regression modeling was performed with the cardiac measurement at follow‐up as the dependent variable and baseline cardiac measurement and change in the adiposity measurement as the independent variables. Standardized β coefficients were used to allow comparability of the magnitude of the association across models. The standardized β coefficient represents the standard‐deviation unit change in cardiac structure or function per 1 standard deviation increase in the adiposity parameter. Adiposity change exposure variables were categorized into those representing generalized obesity (body weight and BMI) and those representing central obesity (waist circumference, waist/hip ratio, index of central obesity, and visceral adiposity index). Outcome variables included change in LV mass and LV end‐diastolic volume (indexed to height), concentricity index, LV wall thickness, and LVEF. Models were sequentially adjusted for the baseline cardiac variable, then additionally for age, sex, race, prevalent hypertension and diabetes mellitus, physical activity, smoking status, alcohol use, and the baseline adiposity variable, and then additionally for the interim development of hypertension, diabetes mellitus, hyperlipidemia, new smoking, or incident CVD. Heterogeneity of effect by sex, race (black/nonblack), obesity status, baseline adiposity, and other factors in the models was assessed. Sensitivity analyses were performed after substituting systolic blood pressure and antihypertensive medication use for hypertension status, separately excluding those with antihypertension medication use, an interim weight loss intervention such as bariatric surgery, and excluding the 2.5% tails of distribution of each outcome. For all statistical testing, a 2‐sided P<0.05 was considered statistically significant. All statistical analyses were performed using SAS version 9.4 software (SAS Institute, Cary, NC).
Results
Among the 1262 participants meeting study criteria, mean age was 44 years, and 57% were women, 44% black, and 36% obese at baseline. Baseline characteristics stratified by weight change category are presented in Table 1. Over a median 6.8 years of follow‐up (IQR 6.3‐7.3), 41% of participants gained clinically significant (>5%) weight, in contrast with 15% of participants who lost clinically significant (>5%) weight over the follow‐up period. Those who gained >10% of body weight gained a median of 11 kg, whereas those who lost >10% of body weight lost a median of 14 kg. Greater weight gain was associated with younger age, fewer prevalent risk factors, less baseline adiposity, lower systolic blood pressure, triglycerides, homeostasis model assessment of insulin resistance, and higher high‐density lipoprotein cholesterol at baseline and with lower LV mass, wall thickness, and concentricity at baseline (P<0.05 for each, Table 1). Gain in WC was associated with similar characteristics (Table 2). Changes in BMI were only modestly correlated with changes in WC over the study period both in the overall population and when restricted to those with obesity (ρ=0.61, P<0.0001).
Table 1.
Baseline Characteristics of the Study Population at Baseline Stratified by Change in Body Weight (N=1262)
| Variable | >10% Weight Loss (N=85) | 5% to 10% Weight Loss (N=108) | <5% Weight Change (N=551) | 5% to 10% Weight Gain (N=248) | >10% Weight Gain (N=270) | P Trend |
|---|---|---|---|---|---|---|
| Weight, kg | 88.9 (77.8, 111.8) | 87.5 (73.7, 100.7) | 82.1 (70.5, 93.4) | 78.1 (64.6, 89.6) | 72.5 (63.1, 84.6) | <0.0001 |
| Age, y | 44.0 (37.0, 51.0) | 46.0 (39.5, 54.0) | 45.0 (38.0, 53.0) | 41.5 (35.0, 49.0) | 39.0 (33.0, 47.0) | <0.0001 |
| Male, % | 28.2 | 38.9 | 49.4 | 46.8 | 33.7 | 0.5311 |
| Race/ethnicity, % | ||||||
| White | 34.1 | 34.3 | 40.7 | 41.1 | 36.3 | 0.8020 |
| Black | 55.3 | 47.2 | 42.6 | 39.1 | 46.7 | 0.2914 |
| Hispanic | 8.2 | 16.7 | 14.0 | 17.7 | 15.6 | 0.1627 |
| Hypertension, % | 47 | 40.6 | 26.5 | 21.7 | 18.2 | <0.0001 |
| Diabetes mellitus, % | 18.8 | 17.6 | 6.5 | 5.3 | 4.1 | <0.0001 |
| Hypercholesterolemia, % | 15.3 | 13.0 | 11.8 | 12.1 | 7.8 | 0.0421 |
| Current smoker, % | 40.0 | 25.9 | 19.1 | 25.1 | 22.2 | 0.0710 |
| Heart rate, bpm | 77.0 (70.7, 84.3) | 75.3 (67.8, 82.3) | 74.7 (66.3, 82.3) | 73.0 (65.7, 80.2) | 74.8 (66.7, 81.7) | 0.2943 |
| Systolic blood pressure, mm Hg | 129.7 (115.7, 136.3) | 128.0 (120.5, 139.3) | 123.7 (115.0, 133.0) | 120.5 (112.0, 129.5) | 117.5 (110.0, 128.0) | <0.0001 |
| Diastolic blood pressure, mm Hg | 78.7 (73.7, 86.7) | 80.5 (73.8, 85.5) | 77.7 (71.3, 84.0) | 76.6 (70.0, 82.0) | 75.0 (68.7, 80.7) | <0.0001 |
| Mean arterial pressure, mm Hg | 96.1 (87.8, 102.4) | 96.7 (90.0, 102.9) | 92.8 (85.9, 100.3) | 90.7 (84.1, 97.6) | 89.3 (83.0, 95.7) | <0.0001 |
| Triglycerides, mg/dL | 96.0 (64.0, 139.0) | 111.0 (83.0, 161.5) | 100.0 (66.0, 150.0) | 93.0 (67.5, 148.0) | 81.0 (58.0, 116.0) | <0.0001 |
| High density lipoprotein cholesterol, mg/dL | 46.0 (38.0, 58.0) | 46.0 (39.5, 56.5) | 48.0 (40.0, 59.0) | 48.5 (41.5, 58.5) | 50.0 (42.0, 61.0) | 0.0050 |
| Triglyceride/high‐density lipoprotein cholesterol ratio | 2.1 (1.3, 3.3) | 2.3 (1.6, 3.9) | 2.0 (1.2, 3.5) | 1.9 (1.2, 3.3) | 1.6 (1.0, 2.7) | <0.0001 |
| Low‐density lipoprotein cholesterol, mg/dL | 108.0 (84.0, 127.0) | 113.5 (93.5, 135.5) | 108.0 (86.0, 128.0) | 106.0 (84.0, 132.5) | 100.0 (79.0, 122.0) | 0.0041 |
| Total cholesterol, mg/dL | 180.0 (148.0, 202.0) | 192.0 (166.0, 211.0) | 180.0 (157.0, 206.0) | 180.0 (158.0, 207.0) | 171.0 (149.0, 197.0) | 0.0010 |
| Glucose, mg/dL | 95.0 (87.0, 109.0) | 96.5 (86.5, 110.5) | 92.0 (85.0, 100.0) | 91.0 (85.0, 97.0) | 89.5 (82.0, 97.0) | <0.0001 |
| Insulin, mIU/L | 15.2 (8.5, 22.3) | 14.4 (8.8, 21.8) | 10.7 (6.8, 17.6) | 10.3 (6.3, 17.7) | 9.8 (6.0, 15.9) | <0.0001 |
| HOMA‐IR | 3.8 (2.0, 6.8) | 3.7 (2.0, 6.4) | 2.5 (1.5, 4.2) | 2.4 (1.4, 4.2) | 2.2 (1.2, 3.7) | <0.0001 |
| N‐Terminal pro B‐type natriuretic peptide, pg/mL | 32.5 (18.4, 63.7) | 25.0 (9.7, 66.8) | 24.9 (11.0, 51.0) | 25.9 (13.1, 55.2) | 30.2 (3.4, 58.9) | 0.5433 |
| High‐sensitivity C‐reactive protein, mg/L | 4.3 (2.1, 8.2) | 3 (1.5, 6.5) | 2.4 (1, 5.2) | 1.8 (0.9, 4.3) | 1.6 (0.7, 4.6) | <0.0001 |
| High‐sensitivity cardiac troponin T, ng/L | 1.5 (1.5, 1.5) | 1.5 (1.5, 4.6) | 1.5 (1.5, 3.1) | 1.5 (1.5, 1.5) | 1.5 (1.5, 1.5) | 0.0010 |
| Adiposity measures | ||||||
| Body mass index, kg/m2 | 33.4 (28.0, 39.3) | 30.8 (27.1, 35.1) | 28.3 (25.2, 32.3) | 27.4 (24.0, 31.2) | 26.3 (23.4, 29.5) | <0.0001 |
| Waist circumference, cm | 104.0 (92.0, 120.0) | 101 (91.0, 111.3) | 96.5 (87.5, 105.0) | 92.0 (82.5, 101.8) | 89.0 (80.0, 98.0) | <0.0001 |
| Waist/hip ratio | 0.9 (0.8, 0.9) | 0.9 (0.9, 1.0) | 0.9 (0.8, 1.0) | 0.9 (0.8, 0.9) | 0.9 (0.8, 0.9) | <0.0001 |
| Index of central obesity | 0.6 (0.6, 0.7) | 0.6 (0.6, 0.7) | 0.6 (0.5, 0.6) | 0.5 (0.5, 0.6) | 0.5 (0.5, 0.6) | <0.0001 |
| Visceral adiposity index | 235.6 (129.9, 387.0) | 236.7 (144.6, 371.9) | 170.6 (102.6, 303.6) | 159.8 (95.6, 289.0) | 134.8 (87.8, 225.8) | <0.0001 |
| Cardiac MRI measures | ||||||
| LV mass/allometric height, g/m2.7 | 33.5 (28.9, 42.9) | 33.6 (29.0, 37.2) | 31.3 (26.6, 36.0) | 30.5 (26.0, 34.9) | 29.4 (25.0, 34.1) | <0.0001 |
| LV end‐diastolic volume/allometric height, mL/m2.7 | 32.2 (27.3, 38.0) | 28.7 (25.9, 33.3) | 28.8 (25.5, 32.5) | 28.7 (25.2, 32.1) | 29.2 (25.5, 32.5) | 0.0351 |
| LV wall thickness, mm | 7.9 (6.7, 9.2) | 8.0 (7.0, 8.9) | 7.7 (6.7, 8.7) | 7.5 (6.5, 8.4) | 7.3 (6.1, 8.1) | <0.0001 |
| Concentricity, g/mL | 1.1 (0.9, 1.3) | 1.1 (1.0, 1.3) | 1.1 (1.0, 1.3) | 1.1 (0.9, 1.3) | 1.0 (0.9, 1.2) | <0.0001 |
| Stroke volume, mL | 83.4 (76.6, 94.5) | 81.8 (75.1, 90.8) | 81.2 (72.6, 90.3) | 77.2 (69.5, 88.6) | 79.4 (67.5, 87.4) | <0.0001 |
| Ejection fraction, % | 67.7 (64.5, 70.5) | 69.3 (64.7, 72.7) | 68.2 (64.3, 72.7) | 67.9 (64.2, 72.7) | 68.0 (63.7, 71.9) | 0.3528 |
Data are presented as median (interquartile range) or proportion (%) as appropriate. HOMA‐IR indicates homeostatic model assessment‐insulin resistance; LV, left ventricular; MRI, magnetic resonance imaging.
Table 2.
Baseline Characteristics of the Study Population at Baseline Stratified by Change in Waist Circumference (N=1259)
| Variable | >10% Weight Loss (N=193) | 5% to 10% Weight Loss (N=209) | <5% Weight Change (N=578) | 5% to 10% Weight Gain (N=144) | >10% Weight Gain (N=135) | P Trend |
|---|---|---|---|---|---|---|
| Weight, kg | 84.7 (73.5, 99.3) | 82.3 (70.0, 95.5) | 81.1 (69.0, 93.0) | 76.2 (65.21, 88.4) | 69.8 (59.4, 80.0) | <0.0001 |
| Age, y | 45 (37, 51) | 45 (38, 53) | 44 (37, 52) | 41 (35, 48) | 40.(33, 48) | <0.0001 |
| Male, % | 35.75 | 43.06 | 51.73 | 37.50 | 22.96 | 0.1804 |
| Race/ethnicity, % | ||||||
| White | 33.7 | 37.807 | 41.007 | 40.3 | 35.6 | 0.3832 |
| Black | 52.3 | 46.9 | 40.8 | 42.4 | 44.4 | 0.0401 |
| Hispanic | 11.4 | 13.4 | 15.7 | 16.0 | 17.8 | 0.0724 |
| Hypertension, % | 33.5 | 32.8 | 26.0 | 21.7 | 13.4 | <0.0001 |
| Diabetes mellitus, % | 12.4 | 9.1 | 7.1 | 4.9 | 3.0 | 0.0004 |
| Hypercholesterolemia, % | 15.0 | 8.6 | 11.8 | 10.4 | 9.6 | 0.3505 |
| Current smoker, % | 26.4 | 18.7 | 21.7 | 19.4 | 32.6 | 0.4348 |
| Heart rate, bpm | 76.3 (69.9, 83.3) | 75.0 (66.3, 82.7) | 74.7 (66.0, 81.7) | 73.5 (65.3, 80.7) | 74.3 (66.7, 83.0) | 0.0520 |
| Systolic blood pressure, mm Hg | 126.3 (114.3, 133.3) | 127.0 (115.3, 138.7) | 122.5 (114.0, 130.7) | 121.8 (112.3, 133.0) | 116.0 (108.3, 123.7) | <0.0001 |
| Diastolic blood pressure, mm Hg | 78.3 (72.0, 84.7) | 78.3 (73.3, 86.3) | 77.0 (71.0, 82.3) | 77.0 (70.3, 81.5) | 73.7 (67.3, 79.3) | <0.0001 |
| Mean arterial pressure, mm Hg | 94.7 (85.6, 100.6) | 95.0 (87.4, 104.0) | 92.1 (85.4, 98.4) | 91.7 (85.2, 97.9) | 87.6 (81.4, 93.9) | <0.0001 |
| Triglycerides, mg/dL | 104.0 (71.0, 146.0) | 98.0 (68.0, 159.0) | 99.0 (67.0, 151.0) | 86.0 (60.0, 128.0) | 71.0 (54.0, 103.0) | <0.0001 |
| High‐density lipoprotein cholesterol, mg/dL | 48.0 (39.0, 58.0) | 46.0 (41.0, 58.0) | 47.0 (40.0, 58.0) | 48.0 (40.0, 59.5) | 56.0 (46.0, 65.0) | 0.0010 |
| Triglyceride/high‐density lipoprotein cholesterol ratio | 2.1 (1.30, 3.3) | 2.1 (1.31, 3.7) | 2.1 (1.3, 3.4) | 1.8 (1.1, 2.9) | 1.2 (0.9, 2.1) | <0.0001 |
| Low‐density lipoprotein cholesterol, mg/dL | 114.0 (86.0, 133.0) | 108.0 (88.0, 129.0) | 107.0 (85.0, 130.0) | 101.0 (81.0, 122.0) | 97.0 (74.0, 122.0) | 0.0011 |
| Total cholesterol, mg/dL | 187.0 (157.0, 209.0) | 182.0 (161.0, 204.0) | 179.0 (157.0, 206.0) | 171.5 (152.0, 197.0) | 171.0 (149.0, 198.0) | 0.0002 |
| Glucose, mg/dL | 93.0 (86.0, 102.0) | 92.0 (86.0, 102.0) | 92.0 (84.0, 100.0) | 92.0 (85.0, 98.0) | 87.0 (81.0, 93.0) | <0.0001 |
| Insulin, μU/mL | 13.1 (8.0, 20.2) | 12.0 (7.2, 19.3) | 11.3 (6.9, 18.0) | 10.5 (6.9, 18.3) | 7.3 (5.3, 11.3) | <0.0001 |
| HOMA‐IR | 3.4 (1.7, 5.2) | 2.7 (1.6, 4.5) | 2.6 (1.5, 4.3) | 2.3 (1.5, 4.3) | 1.5 (1.1, 2.7) | <0.0001 |
| N‐Terminal pro B‐type natriuretic peptide, pg/mL | 27.0 (13.2, 62.3) | 26.1 (10.1, 51.6) | 24.9 (12.1, 55.2) | 28.2 (13.2, 55.0) | 30.4 (15.5, 62.7) | 0.5634 |
| High‐sensitivity C‐reactive protein, mg/L | 3.3 (1.7, 7.6) | 2.6 (1.1, 5.4) | 2.2 (0.9, 5.1) | 2.2 (0.9, 5.0) | 1.5 (0.6, 3.1) | <0.0001 |
| High‐sensitivity troponin, ng/L | 1.5 (1.5, 1.5) | 1.5 (1.5, 3.1) | 1.5 (1.5, 3.1) | 1.5 (1.5, 1.5) | 1.5 (1.5, 1.5) | 0.1146 |
| Adiposity measures | ||||||
| Body mass index, kg/m2 | 30.2 (26.1, 35.7) | 28.7 (25.5, 32.9) | 28.1 (24.8, 32.2) | 27.6 (24.2, 31.6) | 25.0 (23.0, 28.2) | <0.0001 |
| Waist circumference, cm | 100.0 (91.5, 112.0) | 99.0 (90.0, 108.0) | 95.0 (87.5, 104.0) | 90.3 (81.5, 100.5) | 82 (74.5, 89.5) | <0.0001 |
| Waist/hip ratio | 0.9 (0.8, 1.0) | 0.9 (0.9, 1.0) | 0.9 (0.8, 1.0) | 0.9 (0.8, 0.9) | 0.8 (0.8, 0.9) | <0.0001 |
| Index of central obesity | 0.6 (0.5, 0.7) | 0.6 (0.5, 0.6) | 0.6 (0.5, 0.6) | 0.5 (0.5, 0.6) | 0.5 (0.5, 0.5) | <0.0001 |
| Visceral adiposity index | 210.6 (121.9, 346.0) | 187.7 (107.7, 324.8) | 172.9 (102.6, 293.3) | 155.1 (82.0, 287.8) | 114.(74.7, 174.9) | <0.0001 |
| Cardiac MRI measures | ||||||
| LV mass/allometric height, g/m2.7 | 32.8 (27.6, 38.3) | 31.0 (26.1, 36.8) | 31.1 (26.5, 35.6) | 30.6 (26.0, 35.4) | 28.5 (25.0, 33.6) | <0.0001 |
| LV end‐diastolic volume/allometric height, mL/m2.7 | 30.0 (26.1, 34.3) | 28.4 (25.4, 32.8) | 28.9 (25.2, 32.4) | 29.5 (26.0, 32.5) | 28.7 (25.2, 32.2) | 0.1044 |
| LV wall thickness, mm | 7.7 (6.6, 8.8) | 7.8 (6.7, 8.7) | 7.6 (6.6, 8.6) | 7.5 (6.4, 8.4) | 7.0 (6.2, 8.1) | 0.0003 |
| Concentricity, g/mL | 1.1 (0.9, 1.3) | 1.1 (0.9, 1.3) | 1.1 (1.0, 1.2) | 1.1 (0.9, 1.2) | 1.1 (0.9, 1.2) | 0.0026 |
| Stroke volume, mL | 81.8 (72.6, 91.4) | 79.6 (71.7, 88.8) | 81.6 (70.9, 91.0) | 80.8 (70.1, 89.1) | 76.6 (67.3, 85.6) | 0.0192 |
| Ejection fraction, % | 0.7 (0.6, 0.7) | 0.7 (0.7, 0.7) | 0.7 (0.6, 0.7) | 0.7 (0.6, 0.7) | 0.7 (0.7, 0.7) | 0.6862 |
Values presented as median (25%,75%) or percentiles as appropriate. HOMA‐IR indicates homeostatic model assessment‐insulin resistance; LV, left ventricular; MRI, magnetic resonance imaging.
Changes in characteristics of the study population from baseline to follow‐up, stratified by weight change category, are presented in Table 3. Greater weight gain was associated with greater increases in systolic and mean blood pressure, triglycerides, low‐density lipoprotein cholesterol, total cholesterol, homeostasis model assessment of insulin resistance, and C‐reactive protein; and greater decreases in high‐density lipoprotein cholesterol and N‐terminal pro‐B‐type natriuretic peptide over time (P<0.05 for each, Table 3). Among those with significant weight loss, there was a general decrease in LV mass over time that lessened in magnitude among those with minimal weight change or weight gain; in contrast, those who gained >10% of their baseline body weight had ≈3% increase in LV mass (P‐trend<0.0001, Figure 2A). Similarly, LV wall thickness and concentricity index increased across categories of weight and WC change (P‐trend<0.0001 and P‐trend=0.0026, respectively, Figure 2B and 2C).
Table 3.
Changes in Characteristics of the Study Population Stratified by Change in Body Weight (N=1262)
| Variable | >10% Weight Loss (N=85) | 5% to 10% Weight Loss (N=108) | <5% Weight Change (N=551) | 5% to 10% Weight Gain (N=248) | >10% Weight Gain (N=270) | P Trend |
|---|---|---|---|---|---|---|
| Weight, kg | −14.1 (−20.2, −10.2) | −6.2 (−7.6, −4.8) | 0.3 (−1.4, 2.3) | 5.4 (4.5, 6.5) | 10.9 (8.6, 13.8) | <0.0001 |
| Incident hypertension, % | 9.4 | 19.4 | 22.1 | 17.7 | 20.7 | 0.3944 |
| Incident diabetes mellitus, % | 2.4 | 7.4 | 5.8 | 5.6 | 6.7 | 0.3936 |
| Incident hypercholesterolemia, % | 9.4 | 23.1 | 20.1 | 16.5 | 17.8 | 0.9114 |
| Incident smoker, % | 5.9 | 3.7 | 3.6 | 2.4 | 4.1 | 0.5575 |
| Heart rate, bpm | −11.7 (−18.7, −4.0) | −10.2 (−16.3, −4.5) | −8.7 (−15.7, −1.7) | −6.2 (−13.0, −1.0) | −6.3 (−11.7, −0.7) | <0.0001 |
| Systolic blood pressure, mm Hg | 1.0 (−8.0, 15.0) | 2.0 (−8.2, 15.0) | 5.8 (−4.0, 15.0) | 4.7 (−3.3, 16.7) | 8.0 (−0.7, 18.0) | 0.0001 |
| Diastolic blood pressure, mm Hg | −2.3 (−9.7, 5.0) | −1.0 (−5.8, 6.2) | 2.3 (−3.3, 8.7) | 3.7 (−1.8, 9.3) | 6.0 (0.7, 11.0) | <0.0001 |
| Mean arterial pressure, mm Hg | −2.4 (−7.3, 7.9) | 0.4 (−6.2, 9.5) | 3.9 (−3.0, 10.2) | 3.9 (−1.8, 10.9) | 6.6 (0.9, 12.0) | <0.0001 |
| Triglycerides, mg/dL | −14.0 (−49.0, 10.0) | −4.5 (−37.0, 20.5) | 6.0 (−24.0, 34.0) | 12.5 (−12.0, 47.0) | 18.0 (−6.0 55.0) | <0.0001 |
| High‐density lipoprotein cholesterol, mg/dL | 8.0 (2.0, 14.0) | 5.0 (−2.5, 10.5) | 3.0 (−3.0, 9.0) | 1.0 (−5.0, 8.0) | −1.0 (−8.0, 4.0) | <0.0001 |
| Triglyceride/high‐density lipoprotein cholesterol ratio | −0.6 (−1.4, 0.02) | −0.3 (−1.2, 0.3) | 0.02 (−0.6, 0.7) | 0.2 (−0.4, 1.0) | 0.3 (−0.2, 1.2) | <0.0001 |
| Low‐density lipoprotein cholesterol, mg/dL | 6.0 (−22.0, 19.0) | −3.5 (−21.0, 19.5) | 11.0 (−7.5, 29.0) | 15.0 (−6.0, 34.0) | 18.0 (2.0, 39.0) | <0.0001 |
| Total cholesterol, mg/dL | 9.0 (−15.0, 28.0) | −0.5 (−20.0, 27.5) | 16.5 (−7.0, 34.5) | 17.0 (−5.0, 41.0) | 25.5 (2.0, 43.0) | <0.0001 |
| Glucose, mg/dL | −3.0 (−11.0, 3.0) | 0.0 (−9.5, 7.0) | 2.0 (−5.0, 10.0) | 4.0 (−4.0, 12.0) | 5.0 (−4.0, 11.0) | <0.0001 |
| Insulin, μU/mL | −5.6 (−11.9, −0.5) | −3.4 (−8.4, 1.6) | 0.5 (−2.9, 3.5) | 1.4 (−1.8, 6.1) | 3.3 (−0.7, 7.2) | <0.0001 |
| HOMA‐IR | −1.6 (−3.4, −0.4) | −0.8 (−2.2, 0.4) | 0.2 (−0.7, 1.0) | 0.5 (−0.3, 1.7) | 0.8 (−0.1, 1.8) | <0.0001 |
| N‐Terminal pro B‐type natriuretic peptide, pg/mL | 27.3 (4.2, 81.5) | 18.1 (2.7, 52.5) | 13.5 (−0.3, 32.4) | 10.4 (−5.6, 25.5) | 8.9 (−8.2, 25.7) | <0.0001 |
| High‐sensitivity C‐reactive protein, mg/L | −2.1 (−4.8, −0.3) | −1.1 (−3.3, 0.2) | −0.2 (−1.5, 0.7) | 0.3 (−0.5, 1.4) | 0.5 (−0.2, 2.1) | <0.0001 |
| High‐sensitivity troponin, ng/L | 2.4 (0.0, 5.3) | 2.3 (0.0, 5.1) | 2.6 (0.0, 5.3) | 2.8 (0.0, 5.3) | 2.5 (0.0, 5.2) | 0.5876 |
| Adiposity measures | ||||||
| Body mass index, kg/m2 | −5.1 (−7.3, −3.7) | −2.3 (−2.9, −1.6) | −0.01 (−0.8, 0.8) | 1.6 (1.1, 2.3) | 3.6 (2.8, 4.8) | <0.0001 |
| Waist circumference, cm | −14.2 (−20.7, −10.3) | −8.1 (−11.6, −4.21) | −2.4 (−6.3, 1.0) | 1.7 (−2.2, 6.1) | 6.1 (1.7, 10.7) | <0.0001 |
| Waist/hip ratio | −0.04 (−0.06, −0.02) | −0.03 (−0.07, 0.01) | −0.01 (−0.04, 0.02) | 0 (−0.03, 0.03) | 0.02 (−0.01, 0.05) | <0.0001 |
| Index of central obesity | −0.1 (−0.1, −0.1) | −0.05 (−0.1, −0.02) | −0.01 (−0.04, 0.01) | 0.01 (−0.02, 0.03) | 0.03 (0.01, 0.06) | <0.0001 |
| Visceral adiposity index | −71.8 (−213.8, −23.5) | −37.6 (−136.0, 17.9) | 1.7 (−55.8, 55.2) | 24.9 (−25.3, 87.8) | 48.8 (5.1, 142.1) | <0.0001 |
| Cardiac MRI measures | ||||||
| LV mass/allometric height, g/m2.7 | −2.0 (−3.9, −0.1) | −1.3 (−4.0, 1.0) | −0.8 (−2.7, 1.2) | −0.6 (−2.5, 1.7) | 0.6 (−1.4, 3.0) | <0.0001 |
| LV end‐diastolic volume/allometric height, mL/m2.7 | −2.2 (−5.0, 1.2) | −0.6 (−3.2, 1.6) | −0.4 (−2.9, 1.7) | −0.5 (−2.9, 1.8) | 0.1 (−1.9, 2.0) | 0.0021 |
| LV wall thickness, mm | −0.19 (−0.59, 0.59) | −0.23 (−0.72, 0.17) | −0.10 (−0.58, 0.42) | −0.03 (−0.42, 0.53) | 0.23 (−0.28, 0.66) | <0.0001 |
| Concentricity, g/mL | −0.0036 (−0.090, 0.065) | −0.024 (−0.14, 0.066) | −0.00018 (−0.095, 0.075) | −0.011 (−0.092, 0.095) | 0.027 (−0.062, 0.12) | 0.0007 |
| Stroke volume, mL | −5.6 (−14.3, 3.2) | −1.2 (−8.9, 6.8) | −0.7 (−8.4, 5.9) | 0.1 (−7.2, 7.2) | 1.5 (−5.0, 6.6) | 0.0001 |
| Ejection fraction, % | 0.00 (−0.040, 0.040) | 0.00 (−0.020, 0.030) | 0.010 (−0.030, 0.040) | 0.020 (−0.030, 0.050) | 0.020 (−0.020, 0.050) | 0.0247 |
Values presented as median (25%,75%) or percentiles as appropriate. HOMA‐IR indicates homeostatic model assessment‐insulin resistance; LV, left ventricular; MRI, magnetic resonance imaging.
Figure 2.
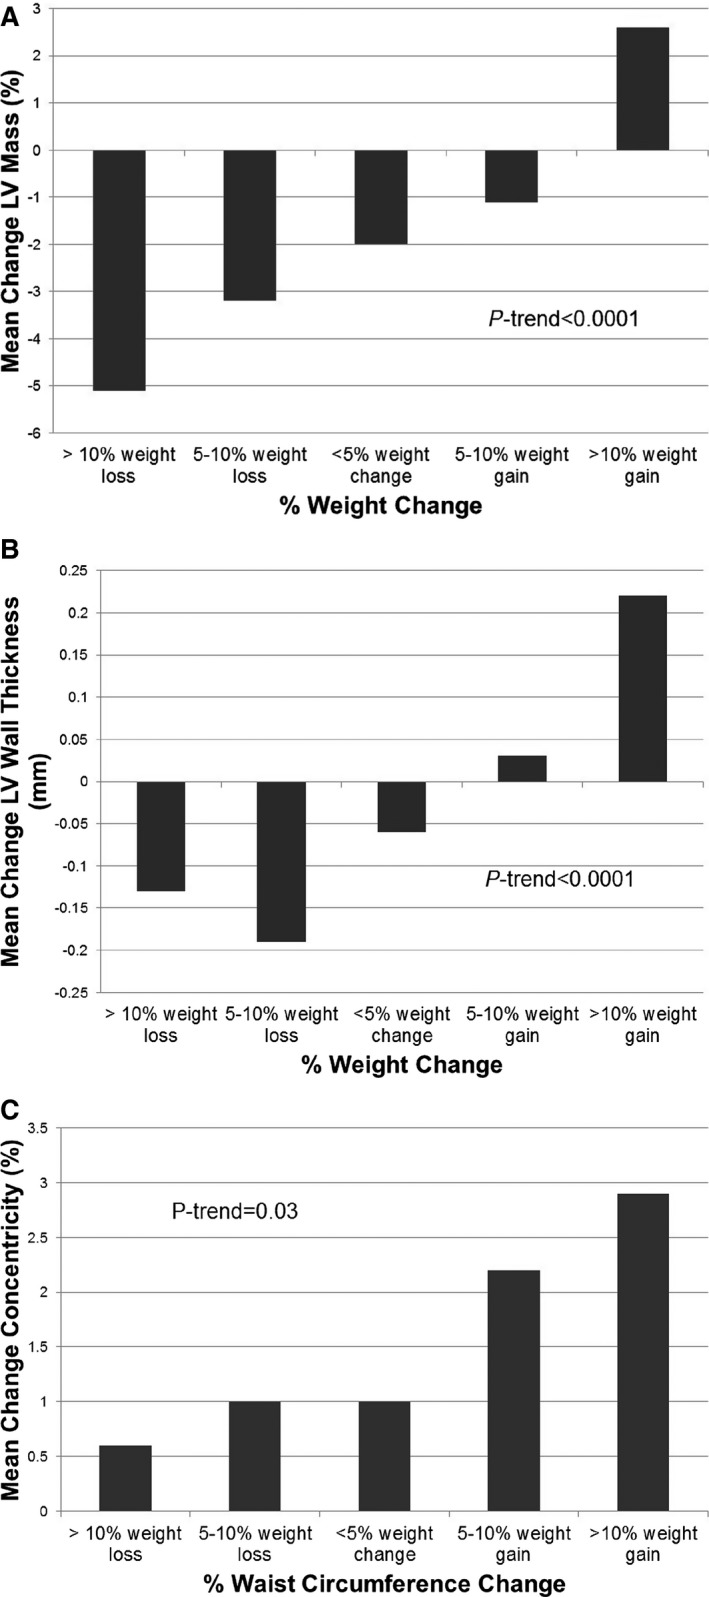
Changes in left ventricular mass (%) and left ventricular wall thickness (mm) by body weight change categories (A and B) and changes in left ventricular concentricity (mass/volume ratio, %) by waist circumference change categories (C).
In multivariable linear regression analyses adjusting for baseline age, sex, race, hypertension, diabetes mellitus, physical activity, smoking, alcohol use, weight, and the baseline cardiac variable, increasing weight remained significantly associated with larger LV mass (β=0.10, P<0.0001), LV wall thickness (β=0.10, P<0.0001), and LV concentricity (β=0.07, P=0.0010), with more modest effects on LV end‐diastolic volume (LVEDV) (β=0.04, P=0.0454) and EF (β=0.05, P=0.0438) (Table 4). Further adjustment for interim comorbidities did not materially alter the results. Similar results were seen for BMI (Table 5). Among all analyzed model covariates, the baseline cardiac parameter and change in body weight were the only variables independently associated with all measures of cardiac structural and functional changes over time. Further analysis to investigate the possibility of a clinical threshold of weight change on changes in concentricity using continuous, adjusted‐splines modeling showed that any weight loss was associated with a decrease in concentricity and that any weight gain up to ≈20% was associated with increased concentricity (Figure 3). Because there were very few data points beyond a 20% weight change, it is unclear if further increases in weight would impact additional concentricity change.
Table 4.
Multivariable‐Adjusted Association Between Change in Body Weight and Waist Circumference and Cardiac Structure and Function at Follow‐Up
| Change in Body Weight (kg) | Change in Waist Circumference (cm) | |||||||
|---|---|---|---|---|---|---|---|---|
| Model 1 | Model 2 | Model 1 | Model 2 | |||||
| β | P Value | β | P Value | β | P Value | β | P Value | |
| LV mass/allometric height, g/m2.7 | 0.10 | <0.0001 | 0.10 | <0.0001 | 0.07 | <0.0001 | 0.07 | <0.0001 |
| LVEDV/allometric height, mL/m2.7 | 0.04 | 0.0454 | 0.04 | 0.0439 | 0.02 | 0.4439 | 0.02 | 0.2990 |
| LV wall thickness, mm | 0.10 | <0.0001 | 0.10 | <0.0001 | 0.08 | <0.0001 | 0.08 | <0.0001 |
| Concentricity, g/mL | 0.07 | 0.0010 | 0.06 | 0.002 | 0.07 | 0.0007 | 0.06 | 0.0030 |
| Ejection fraction, % | 0.05 | 0.0438 | 0.05 | 0.0458 | 0.01 | 0.6038 | 0.01 | 0.7185 |
Models constructed with change in adiposity parameter as the independent variable and the change in cardiac parameter as the dependent variable. Model 1 adjusted for age, sex, race, hypertension, type 2 diabetes mellitus, exercise dose, smoking, alcohol use, baseline cardiac variable, and baseline adiposity variable. Model 2 adjusted for all covariates from model 1 plus interim development of hypertension, type 2 diabetes mellitus, hyperlipidemia, smoking, and cardiovascular disease. EDV indicates end‐diastolic volume; LV, left ventricular.
Table 5.
Multivariable‐Adjusted Association Between Change in Alternative Adiposity Metrics and Cardiac Structure and Function at Follow‐Up
| Body Mass Index | Visceral Adiposity Index | Index of Central Obesity | Waist‐Hip Ratio | |||||
|---|---|---|---|---|---|---|---|---|
| β | P Value | β | P Value | β | P Value | β | P Value | |
| LV mass/allometric height, g/m2.7 | 0.10 | <0.0001 | 0.03 | 0.1036 | 0.08 | <0.0001 | 0.02 | 0.3610 |
| LVEDV/allometric height, mL/m2.7 | 0.06 | 0.0019 | −0.02 | 0.4051 | 0.03 | 0.0933 | −0.01 | 0.5769 |
| LV wall thickness, mm | 0.11 | <0.0001 | 0.06 | 0.0013 | 0.08 | <0.0001 | 0.02 | 0.1893 |
| Concentricity, g/mL | 0.07 | 0.0019 | 0.06 | 0.0050 | 0.06 | 0.0025 | 0.03 | 0.1192 |
| Ejection fraction, % | 0.04 | 0.0751 | −0.002 | 0.9306 | 0.02 | 0.5267 | 0.02 | 0.4805 |
Adjusted for age, sex, race, hypertension, diabetes mellitus, exercise dose, smoking, alcohol use, baseline cardiac variable, and baseline adiposity variable plus interim development of hypertension, diabetes mellitus, hyperlipidemia, smoking, and cardiovascular disease. EDV indicates end diastolic volume; LV, left ventricular.
Figure 3.
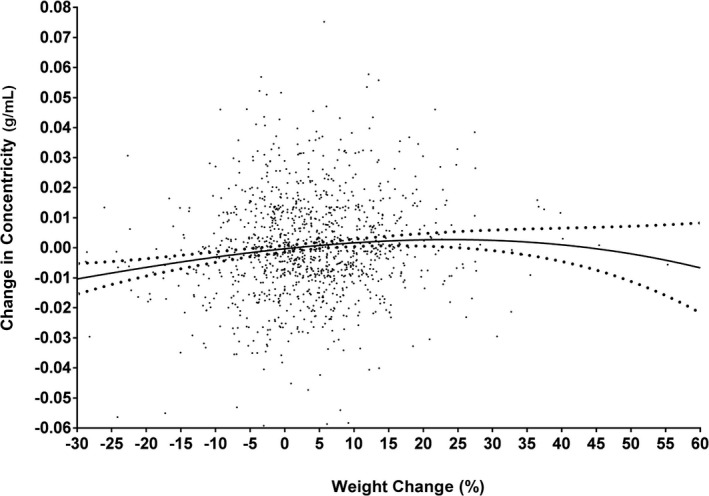
Multivariable‐adjusted changes in concentricity by percentage weight change. Continuous, adjusted splines show that any weight loss was associated with a decrease in concentricity and that any weight gain up to ≈20% was associated with increased concentricity. Since there were very few data points beyond a 20% weight change, it is unclear if further increases in weight would impact additional concentricity change. Model adjusted for all covariates included in model 2 in Table 2.
In separate models assessing changes in WC, increasing WC was also associated with higher LV mass (β=0.07, P<0.0001), LV wall thickness (β=0.08, P<0.0001), and concentricity (β=0.07, P=0.0007) over time; however, no relation was seen between WC change and change in LVEDV (P=0.4439) or EF (P=0.6038) (Table 4). Results were similar with index of central obesity and visceral adiposity index (Table 5). Changes in waist‐hip ratio were not independently associated with change in any cardiac parameters (Table 5). Results remained significant even after adjustment for multiple testing using the Bonferroni correction, except for those between adiposity and LV volumes and EF. Additional adjustment for BMI change in models of waist circumference change attenuated the relationship between changes in waist circumference and cardiac parameters. Results were insensitive to substituting systolic blood pressure and antihypertensive medication use for hypertension status, to excluding participants taking antihypertension medications at baseline or follow‐up, to excluding individuals who had a medical weight loss intervention such as bariatric surgery between baseline and follow‐up (n=20), and to excluding the 2.5% tails of distribution for each outcome to exclude an outlier effect. Additional sensitivity analyses were performed by indexing LV mass and end‐diastolic volume to body surface area instead of allometric height, and results were unchanged.
When multivariable models evaluating the relationship of changes in body weight with changes in cardiac structure and function were stratified by sex, results were directionally consistent. However, the magnitude of effect appeared greater among women compared with men for LV mass (β [95%CI]: 0.11 [0.06, 0.15] for women versus 0.07 [0.02, 0.12] for men), with no statistically significant interactions seen by sex or race (black/nonblack). A significant interaction was seen by obesity status such that the association of weight change on LV wall thickness was greater among nonobese compared with obese individuals at baseline (β=0.11, P<0.0001 versus β=0.08, P=0.0090; respectively; P‐interaction=0.0129). There were no statistically significant interactions seen by age, hypertension or diabetes mellitus status, physical activity, smoking, or alcohol use. Furthermore, we did not find a statistical interaction between baseline adiposity and adiposity change on the cardiac MRI outcomes. This suggests that the association of adiposity change on cardiac MRI parameters is consistent across all groups irrespective of the baseline adiposity/relative obesity.
Discussion
Principal Findings
In a large, multiethnic cohort of adults, we observed a dynamic relationship between changes in multiple indices of adiposity and LV remodeling over 7 years of follow‐up. Both increasing generalized and central adiposity over time were associated with pathologic cardiac remodeling independent of baseline adiposity. There did not appear to be a threshold for concentricity change by weight change: any amount of weight loss was associated with a decrease in concentricity, and any weight gain up to ≈20% was associated with increased concentricity. Sensitivity analysis across subgroups of sex, race, and obesity status showed directionally consistent results. We did observe minor differences in the subphenotype of adiposity change: increasing generalized obesity, represented by body weight and BMI, was associated with increased LV mass, LV wall thickness, and concentricity, with a more modest effect on LVEDV and EF; whereas increasing central adiposity over time, represented by WC, index of central obesity, and visceral adiposity index was associated with concentric remodeling but not with volume or EF. These results suggest that concentric remodeling is the predominant phenotype linked to increasing adiposity in middle aged adults, and extends prior cross‐sectional data in a similar population that found that obesity was associated with concentric LV remodeling without much change in EF.5
In Context of Current Literature
Previous studies in community‐based cohorts examining the relationship between longitudinal changes in adiposity and LV morphology have primarily focused on limited measures of adiposity and used echocardiography as the imaging modality. In general, studies have shown a positive correlation between increased adiposity and certain aspects of cardiac remodeling. For example, in a substudy of the CARDIA (Coronary Artery Risk Development in Young Adults) Study with 1358 participants, increasing BMI longitudinally over 10 years was associated with increased LV mass by 2‐dimensionally guided M‐mode echocardiography.17 A larger study from CARDIA using echocardiography showed that change in BMI over 25 years was consistently associated with increased LV mass, LVEDV, and LV end‐systolic volume.28 Two studies from the Framingham Heart Study using over 4000 participants also showed that BMI change over a 16‐year period was associated with increased LV mass, LV wall thickness, LV systolic and diastolic dimensions with 2‐dimensional echocardiography.29, 30 Although 2‐dimensional echocardiography is the most commonly used method for these assessments in clinical practice, the accuracy and reproducibility of this technique have significant limitations.31, 32 Standard 2‐dimensional echocardiography may underestimate LVEDV compared with contrast‐enhanced and 3‐dimensional echocardiography and MRI,32 making MRI the standard for accurate for volumetric assessments. A recent study from MESA (Multi‐Ethnic Study of Atherosclerosis) with 2351 participants showed that weight loss over 9 years was associated with decreases in LV mass and concentricity using MRI; however, outcomes did not include LV volume, wall thickness, or EF; and exposures did not included indices of centralized obesity such as waist circumference.18 Although many different cardiac structural phenotypes are inter‐related, in many circumstances, heterogeneity of phenotypes allows for more precise identification of pathologic remodeling and associates with varying outcomes. For example, in the 4‐tiered classification of LV hypertrophy, classification by differing LV wall thickness, volumes, and concentricity stratifies LV hypertrophy into subgroups with differential risk for adverse cardiovascular outcomes.33 Therefore, we believe that describing the associations of adiposity changes with multiple measures of cardiac remodeling is important and novel. Although the variability of EF in a normal population varies minimally when measured in a cross‐sectional fashion, longitudinal changes in EF may occur and provide additional information on change in cardiac function over time. Our study extends the observations from prior studies to additional cardiac phenotypes and is the first study to our knowledge to report the relationships between longitudinal changes in both generalized and central adiposity with dynamic changes in multiple measures of cardiac remodeling over time using MRI.
In contrast to our study and a prior study from MESA5 in which a concentric remodeling phenotype was predominant for all adiposity measures, the Bogalusa Heart Study concluded that increases in indices of both generalized and central adiposity were associated with eccentric LV hypertrophy but not concentric remodeling using echocardiography.34 One possible explanation for the disparate findings between studies may be due to the different demographics of the study populations: mean age 22 years and majority white participants in the Bogalusa Heart study compared with mean age 44 years and ≈50% black in the DHS. Moreover, in our study and in MESA, participants had higher rates of hypertension, an established driver of concentric remodeling. However, associations with higher concentricity remained after adjustment for hypertension or systolic blood pressure. Differences in pubertal and hormonal status in the Bogalusa study compared with the current study may also contribute to the differences in cardiac remodeling patterns observed. It is also possible that the effects of obesity are conditioned on time such that excess adiposity early in life leads to eccentric LV enlargement due to higher circulating blood volume and cardiac output but that there is a subsequent shift toward concentric remodeling/hypertrophy with increasing age and vascular remodeling. In fact, concentric remodeling/hypertrophy is the most prevalent LV structural abnormality among obese patients with heart failure35 and is associated with a high risk for adverse cardiovascular events and death.36
Excess adiposity may influence LV remodeling by a variety of mechanisms including endothelial dysfunction,37 inflammatory cytokines,38 neurohormonal alterations,39 and myocardial fibrosis.40 These mechanisms lead to pathologic LV remodeling,4, 11 and eventually heart failure.2 Variation in body fat distribution may be an important determinant of cardiac remodeling,41 and excess fat storage in the visceral depot may expose the heart to a different inflammatory and metabolic milieu than fat stored in the subcutaneous depot.42 We previously reported that visceral adiposity was independently associated with concentric LV remodeling, whereas lower‐body subcutaneous fat was linked to a more eccentric phenotype.41 Although the cardiac remodeling phenotypes were generally similar between body weight and WC in this study, it is possible that WC is an insufficient surrogate for detecting changes in cardiac risk related to visceral adiposity.43 As mentioned above, in the DHS, the correlation between WC and visceral fat was highly variable: the WC–visceral fat correlation among all DHS participants was 0.73, and among obese participants the WC–visceral fat correlation was lower at 0.46. Furthermore, WC measures include both VAT and abdominal subcutaneous adipose tissue compartments, which are anatomically and physiologically distinct and are associated with a different cardiometabolic risk profile.42 Visceral fat, but not abdominal subcutaneous tissue, has been associated with type 2 diabetes mellitus,44 hypertension,45 and alterations in left ventricular structure and function.41 Moreover, when visceral fat was replaced with WC in a predictive model of type 2 diabetes mellitus, WC was not significantly associated with the outcome.44 In summary, although we did not find major differences between the effects of generalized versus central adiposity in this study, more detailed and precise imaging‐based assessments of adipose depots are required to further delineate the independent effects of varying depots on cardiac structure and function over time.
Strengths and Limitations
Strengths of the current study include phenotyping with multiple indices of adiposity, using a more accurate method of imaging for cardiac structure with MRI, a racially diverse sample of adults applicable to the general population, and serial assessment of body fat distribution and LV morphology. Several limitations merit comment. Because all of our participants were free of clinically apparent CVD at baseline, participants represent a relatively healthy population‐based sample, and results may not be applicable to those with established CVD. Second, we were unable to report on more precise imaging phenotypes of adiposity such as visceral or abdominal subcutaneous fat. Further studies are needed to examine the effects of longitudinal changes in precise imaging based assessments of fat depots on LV remodeling. Third, because our study cohort did not include South or East Asians, the results may not be generalizable to these racial/ethnic groups. Fourth, there may have been other factors/unmeasured confounders that could have influenced both adiposity and cardiac structural changes over time such as dietary habits that we are unable to account for in this study.
Clinical Implications
Our findings may have potential important implications for the prevention and treatment of cardiac hypertrophy and heart failure. They may be particularly important for individuals at higher risk for diastolic dysfunction because concentric remodeling and hypertrophy are central to the pathophysiology of impaired LV relaxation and failure.46 Avoidance of weight gain may delay or prevent progression of diastolic dysfunction. Furthermore, counseling to maintain weight stability, even in the absence of weight loss, may be an important preventive strategy among high‐risk individuals. Our findings further support the importance of preventing obesity as primary prevention for concentric remodeling and eventual HF.
Conclusion
In a multiethnic cohort of adults without heart failure, we observed that increasing adiposity over time was associated with pathologic cardiac remodeling assessed by MRI, independent of baseline adiposity. Concentric remodeling was the predominant phenotype linked to increasing adiposity. Further studies are needed to determine whether aggressive weight management strategies can improve adverse cardiac remodeling, diastolic dysfunction, and heart failure in individuals at high risk for weight gain.
Sources of Funding
The Dallas Heart Study was supported by a grant from the Reynolds Foundation and grant UL1TR001105 from the National Center for Advancing Translational Sciences of the National Institutes of Health. Dr Neeland is supported by grant K23 DK106520 from the National Institute of Diabetes and Digestive and Kidney Diseases of the National Institutes of Health and by the Dedman Family Scholarship in Clinical Care from UT Southwestern.
Disclosures
None.
(J Am Heart Assoc. 2017;6:e005897 DOI: 10.1161/JAHA.117.005897.)28724650
References
- 1. Jensen MD, Ryan DH, Apovian CM, Ard JD, Comuzzie AG, Donato KA, Hu FB, Hubbard VS, Jakicic JM, Kushner RF, Loria CM, Millen BE, Nonas CA, Pi‐Sunyer FX, Stevens J, Stevens VJ, Wadden TA, Wolfe BM, Yanovski SZ. 2013 AHA/ACC/TOS guideline for the management of overweight and obesity in adults: a report of the American College of Cardiology/American Heart Association Task Force on Practice Guidelines and The Obesity Society. J Am Coll Cardiol. 2014;63:2985–3023. [DOI] [PubMed] [Google Scholar]
- 2. Kenchaiah S, Evans JC, Levy D, Wilson PW, Benjamin EJ, Larson MG, Kannel WB, Vasan RS. Obesity and the risk of heart failure. N Engl J Med. 2002;347:305–313. [DOI] [PubMed] [Google Scholar]
- 3. Abbasi F, Brown BW Jr, Lamendola C, McLaughlin T, Reaven GM. Relationship between obesity, insulin resistance, and coronary heart disease risk. J Am Coll Cardiol. 2002;40:937–943. [DOI] [PubMed] [Google Scholar]
- 4. Lauer MS, Anderson KM, Kannel WB, Levy D. The impact of obesity on left ventricular mass and geometry. The Framingham Heart Study. JAMA. 1991;266:231–236. [PubMed] [Google Scholar]
- 5. Turkbey EB, McClelland RL, Kronmal RA, Burke GL, Bild DE, Tracy RP, Arai AE, Lima JA, Bluemke DA. The impact of obesity on the left ventricle: the Multi‐Ethnic Study of Atherosclerosis (MESA). JACC Cardiovasc Imaging. 2010;3:266–274. [DOI] [PMC free article] [PubMed] [Google Scholar]
- 6. Redfield MM, Jacobsen SJ, Borlaug BA, Rodeheffer RJ, Kass DA. Age‐ and gender‐related ventricular‐vascular stiffening: a community‐based study. Circulation. 2005;112:2254–2262. [DOI] [PubMed] [Google Scholar]
- 7. Lee DS, Gona P, Vasan RS, Larson MG, Benjamin EJ, Wang TJ, Tu JV, Levy D. Relation of disease pathogenesis and risk factors to heart failure with preserved or reduced ejection fraction: insights from the Framingham Heart Study of the National Heart, Lung, and Blood Institute. Circulation. 2009;119:3070–3077. [DOI] [PMC free article] [PubMed] [Google Scholar]
- 8. Shah AM, Shah SJ, Anand IS, Sweitzer NK, O'Meara E, Heitner JF, Sopko G, Li G, Assmann SF, McKinlay SM, Pitt B, Pfeffer MA, Solomon SD. Cardiac structure and function in heart failure with preserved ejection fraction: baseline findings from the echocardiographic study of the Treatment of Preserved Cardiac Function Heart Failure with an Aldosterone Antagonist Trial. Circ Heart Fail. 2014;7:104–115. [DOI] [PMC free article] [PubMed] [Google Scholar]
- 9. Neeland IJ, de Lemos JA. Time to retire the BMI? Evaluating abdominal adipose tissue imaging as novel cardiovascular risk biomarker. J Am Coll Cardiol. 2016;68:1522–1524. [DOI] [PubMed] [Google Scholar]
- 10. Flegal KM, Kit BK, Orpana H, Graubard BI. Association of all‐cause mortality with overweight and obesity using standard body mass index categories: a systematic review and meta‐analysis. JAMA. 2013;309:71–82. [DOI] [PMC free article] [PubMed] [Google Scholar]
- 11. Lavie CJ, Milani RV, Ventura HO. Obesity and cardiovascular disease: risk factor, paradox, and impact of weight loss. J Am Coll Cardiol. 2009;53:1925–1932. [DOI] [PubMed] [Google Scholar]
- 12. Wilson PW, D'Agostino RB, Levy D, Belanger AM, Silbershatz H, Kannel WB. Prediction of coronary heart disease using risk factor categories. Circulation. 1998;97:1837–1847. [DOI] [PubMed] [Google Scholar]
- 13. Goff DC Jr, Lloyd‐Jones DM, Bennett G, Coady S, D'Agostino RB Sr, Gibbons R, Greenland P, Lackland DT, Levy D, O'Donnell CJ, Robinson JG, Schwartz JS, Shero ST, Smith SC Jr, Sorlie P, Stone NJ, Wilson PW. 2013 ACC/AHA guideline on the assessment of cardiovascular risk: a report of the American College of Cardiology/American Heart Association Task Force on Practice Guidelines. J Am Coll Cardiol. 2014;63:2935–2959. [DOI] [PMC free article] [PubMed] [Google Scholar]
- 14. Neeland IJ, McGuire DK, Eliasson B, Ridderstrale M, Zeller C, Woerle HJ, Broedl UC, Johansen OE. Comparison of adipose distribution indices with gold standard body composition assessments in the EMPA‐REG H2H SU Trial: a body composition sub‐study. Diabetes Ther. 2015;6:635–642. [DOI] [PMC free article] [PubMed] [Google Scholar]
- 15. Vega GL, Adams‐Huet B, Peshock R, Willett D, Shah B, Grundy SM. Influence of body fat content and distribution on variation in metabolic risk. J Clin Endocrinol Metab. 2006;91:4459–4466. [DOI] [PubMed] [Google Scholar]
- 16. Wong CY, O'Moore‐Sullivan T, Leano R, Byrne N, Beller E, Marwick TH. Alterations of left ventricular myocardial characteristics associated with obesity. Circulation. 2004;110:3081–3087. [DOI] [PubMed] [Google Scholar]
- 17. Lorber R, Gidding SS, Daviglus ML, Colangelo LA, Liu K, Gardin JM. Influence of systolic blood pressure and body mass index on left ventricular structure in healthy African‐American and white young adults: the CARDIA study. J Am Coll Cardiol. 2003;41:955–960. [DOI] [PubMed] [Google Scholar]
- 18. Shah RV, Murthy VL, Abbasi SA, Eng J, Wu C, Ouyang P, Kwong RY, Goldfine A, Bluemke DA, Lima J, Jerosch‐Herold M. Weight loss and progressive left ventricular remodelling: the Multi‐Ethnic Study of Atherosclerosis (MESA). Eur J Prev Cardiol. 2015;11:1408–1418. [DOI] [PMC free article] [PubMed] [Google Scholar]
- 19. Victor RG, Haley RW, Willett DL, Peshock RM, Vaeth PC, Leonard D, Basit M, Cooper RS, Iannacchione VG, Visscher WA, Staab JM, Hobbs HH. The Dallas Heart Study: a population‐based probability sample for the multidisciplinary study of ethnic differences in cardiovascular health. Am J Cardiol. 2004;93:1473–1480. [DOI] [PubMed] [Google Scholar]
- 20. Matthews DR, Hosker JP, Rudenski AS, Naylor BA, Treacher DF, Turner RC. Homeostasis model assessment: insulin resistance and beta‐cell function from fasting plasma glucose and insulin concentrations in man. Diabetologia. 1985;28:412–419. [DOI] [PubMed] [Google Scholar]
- 21. Neeland IJ, Drazner MH, Berry JD, Ayers CR, deFilippi C, Seliger SL, Nambi V, McGuire DK, Omland T, de Lemos JA. Biomarkers of chronic cardiac injury and hemodynamic stress identify a malignant phenotype of left ventricular hypertrophy in the general population. J Am Coll Cardiol. 2013;61:187–195. [DOI] [PMC free article] [PubMed] [Google Scholar]
- 22. Parikh RM, Joshi SR, Menon PS, Shah NS. Index of central obesity—a novel parameter. Med Hypotheses. 2007;68:1272–1275. [DOI] [PubMed] [Google Scholar]
- 23. Amato MC, Giordano C, Galia M, Criscimanna A, Vitabile S, Midiri M, Galluzzo A. Visceral adiposity index: a reliable indicator of visceral fat function associated with cardiometabolic risk. Diabetes Care. 2010;33:920–922. [DOI] [PMC free article] [PubMed] [Google Scholar]
- 24. Chung AK, Das SR, Leonard D, Peshock RM, Kazi F, Abdullah SM, Canham RM, Levine BD, Drazner MH. Women have higher left ventricular ejection fractions than men independent of differences in left ventricular volume: the Dallas Heart Study. Circulation. 2006;113:1597–1604. [DOI] [PubMed] [Google Scholar]
- 25. Drazner MH, Dries DL, Peshock RM, Cooper RS, Klassen C, Kazi F, Willett D, Victor RG. Left ventricular hypertrophy is more prevalent in blacks than whites in the general population: the Dallas Heart Study. Hypertension. 2005;46:124–129. [DOI] [PubMed] [Google Scholar]
- 26. Garg S, de Lemos JA, Matulevicius S, Ayers CR, Pandey A, Neeland IJ, Berry JD, McColl R, Maroules C, Peshock RM, Drazner MH. Association of concentric left ventricular hypertrophy with subsequent increase in left ventricular end‐diastolic volume, the Dallas Heart Study. Circ Heart Fail. 2017. DOI: 10.1161/CIRCHEARTFAILURE.117.003959. In Press. [DOI] [PubMed] [Google Scholar]
- 27. Maroules CD, McColl R, Khera A, Peshock RM. Interstudy reproducibility of SSFP cine magnetic resonance: impact of magnetic field strength and parallel imaging. J Magn Reson Imaging. 2008;27:1139–1145. [DOI] [PubMed] [Google Scholar]
- 28. Kishi S, Armstrong AC, Gidding SS, Colangelo LA, Venkatesh BA, Jacobs DR Jr, Carr JJ, Terry JG, Liu K, Goff DC Jr, Lima JA. Association of obesity in early adulthood and middle age with incipient left ventricular dysfunction and structural remodeling: the CARDIA Study (Coronary Artery Risk Development in Young Adults). JACC Heart Fail. 2014;2:500–508. [DOI] [PMC free article] [PubMed] [Google Scholar]
- 29. Lieb W, Xanthakis V, Sullivan LM, Aragam J, Pencina MJ, Larson MG, Benjamin EJ, Vasan RS. Longitudinal tracking of left ventricular mass over the adult life course: clinical correlates of short‐ and long‐term change in the Framingham Offspring Study. Circulation. 2009;119:3085–3092. [DOI] [PMC free article] [PubMed] [Google Scholar]
- 30. Cheng S, Xanthakis V, Sullivan LM, Lieb W, Massaro J, Aragam J, Benjamin EJ, Vasan RS. Correlates of echocardiographic indices of cardiac remodeling over the adult life course: longitudinal observations from the Framingham Heart Study. Circulation. 2010;122:570–578. [DOI] [PMC free article] [PubMed] [Google Scholar]
- 31. Bellenger NG, Burgess MI, Ray SG, Lahiri A, Coats AJ, Cleland JG, Pennell DJ. Comparison of left ventricular ejection fraction and volumes in heart failure by echocardiography, radionuclide ventriculography and cardiovascular magnetic resonance; are they interchangeable? Eur Heart J. 2000;21:1387–1396. [DOI] [PubMed] [Google Scholar]
- 32. Jenkins C, Moir S, Chan J, Rakhit D, Haluska B, Marwick TH. Left ventricular volume measurement with echocardiography: a comparison of left ventricular opacification, three‐dimensional echocardiography, or both with magnetic resonance imaging. Eur Heart J. 2009;30:98–106. [DOI] [PubMed] [Google Scholar]
- 33. Garg S, de Lemos JA, Ayers C, Khouri MG, Pandey A, Berry JD, Peshock RM, Drazner MH. Association of a 4‐tiered classification of LV hypertrophy with adverse CV outcomes in the general population. JACC Cardiovasc Imaging. 2015;8:1034–1041. [DOI] [PMC free article] [PubMed] [Google Scholar]
- 34. Hu T, Yao L, Gustat J, Chen W, Webber L, Bazzano L. Which measures of adiposity predict subsequent left ventricular geometry? Evidence from the Bogalusa Heart Study. Nutr Metab Cardiovasc Dis. 2015;25:319–326. [DOI] [PMC free article] [PubMed] [Google Scholar]
- 35. Lavie CJ, Milani RV, Ventura HO, Cardenas GA, Mehra MR, Messerli FH. Disparate effects of left ventricular geometry and obesity on mortality in patients with preserved left ventricular ejection fraction. Am J Cardiol. 2007;100:1460–1464. [DOI] [PubMed] [Google Scholar]
- 36. Verma A, Meris A, Skali H, Ghali JK, Arnold JM, Bourgoun M, Velazquez EJ, McMurray JJ, Kober L, Pfeffer MA, Califf RM, Solomon SD. Prognostic implications of left ventricular mass and geometry following myocardial infarction: the VALIANT (Valsartan In Acute Myocardial Infarction) Echocardiographic Study. JACC Cardiovasc Imaging. 2008;1:582–591. [DOI] [PubMed] [Google Scholar]
- 37. Caballero AE. Endothelial dysfunction in obesity and insulin resistance: a road to diabetes and heart disease. Obes Res. 2003;11:1278–1289. [DOI] [PubMed] [Google Scholar]
- 38. Pou KM, Massaro JM, Hoffmann U, Vasan RS, Maurovich‐Horvat P, Larson MG, Keaney JF Jr, Meigs JB, Lipinska I, Kathiresan S, Murabito JM, O'Donnell CJ, Benjamin EJ, Fox CS. Visceral and subcutaneous adipose tissue volumes are cross‐sectionally related to markers of inflammation and oxidative stress: the Framingham Heart Study. Circulation. 2007;116:1234–1241. [DOI] [PubMed] [Google Scholar]
- 39. Engeli S, Sharma AM. The renin‐angiotensin system and natriuretic peptides in obesity‐associated hypertension. J Mol Med (Berl). 2001;79:21–29. [DOI] [PubMed] [Google Scholar]
- 40. Quilliot D, Alla F, Bohme P, Bruntz JF, Hammadi M, Dousset B, Ziegler O, Zannad F. Myocardial collagen turnover in normotensive obese patients: relation to insulin resistance. Int J Obes (Lond). 2005;29:1321–1328. [DOI] [PubMed] [Google Scholar]
- 41. Neeland IJ, Gupta S, Ayers CR, Turer AT, Rame JE, Das SR, Berry JD, Khera A, McGuire DK, Vega GL, Grundy SM, de Lemos JA, Drazner MH. Relation of regional fat distribution to left ventricular structure and function. Circ Cardiovasc Imaging. 2013;6:800–807. [DOI] [PMC free article] [PubMed] [Google Scholar]
- 42. Neeland IJ, Ayers CR, Rohatgi AK, Turer AT, Berry JD, Das SR, Vega GL, Khera A, McGuire DK, Grundy SM, de Lemos JA. Associations of visceral and abdominal subcutaneous adipose tissue with markers of cardiac and metabolic risk in obese adults. Obesity (Silver Spring). 2013;21:E439–E447. [DOI] [PMC free article] [PubMed] [Google Scholar]
- 43. Sperling LS, Mechanick JI, Neeland IJ, Herrick CJ, Despres JP, Ndumele CE, Vijayaraghavan K, Handelsman Y, Puckrein GA, Araneta MR, Blum QK, Collins KK, Cook S, Dhurandhar NV, Dixon DL, Egan BM, Ferdinand DP, Herman LM, Hessen SE, Jacobson TA, Pate RR, Ratner RE, Brinton EA, Forker AD, Ritzenthaler LL, Grundy SM. The Cardiometabolic Health Alliance: working toward a new care model for the metabolic syndrome. J Am Coll Cardiol. 2015;66:1050–1067. [DOI] [PubMed] [Google Scholar]
- 44. Neeland IJ, Turer AT, Ayers CR, Powell‐Wiley TM, Vega GL, Farzaneh‐Far R, Grundy SM, Khera A, McGuire DK, de Lemos JA. Dysfunctional adiposity and the risk of prediabetes and type 2 diabetes in obese adults. JAMA. 2012;308:1150–1159. [DOI] [PMC free article] [PubMed] [Google Scholar]
- 45. Chandra A, Neeland IJ, Berry JD, Ayers CR, Rohatgi A, Das SR, Khera A, McGuire DK, de Lemos JA, Turer AT. The relationship of body mass and fat distribution with incident hypertension: observations from the Dallas Heart Study. J Am Coll Cardiol. 2014;64:997–1002. [DOI] [PubMed] [Google Scholar]
- 46. Vasan RS, Larson MG, Benjamin EJ, Evans JC, Levy D. Left ventricular dilatation and the risk of congestive heart failure in people without myocardial infarction. N Engl J Med. 1997;336:1350–1355. [DOI] [PubMed] [Google Scholar]