Figure 1.
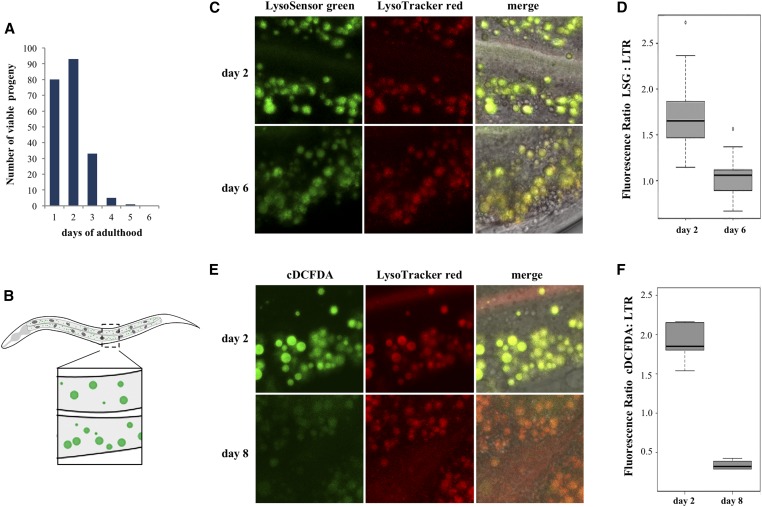
In vivo assessment of lysosomal acidity in C. elegans intestines. (A) Representative reproduction timeline of wild-type hermaphrodites grown at 20°. (B) Diagram of a worm illustrating the midbody region in the intestine considered for subsequent image analysis of lysosomes (green spots in inset). (C) Representative images of intestines of day 2 (reproductive) and day 6 (postreproductive) worms costained with LSG DND-189 and LTR DND-99. (D) LSG/LTR average ratios for day 2 and day 6 animals. (E) Representative images of intestines of day 2 and day 6 worms costained with cDCFDA and LTR DND-99. (F) cDCFDA/LTR average ratios for day 2 and day 6 animals.

