

Abstract
Background
Non‐high‐density lipoprotein cholesterol (non‐HDL‐C) and apolipoprotein (apo) B are better predictors of atherosclerotic cardiovascular disease risk than low‐density lipoprotein cholesterol alone. US and European lipid management guidelines support non‐HDL‐C and apoB as targets for lipid‐lowering therapy.
Methods and Results
This analysis evaluated the efficacy of alirocumab, a proprotein convertase subtilisin/kexin type 9 inhibitor, on non‐HDL‐C and apoB. Data were derived from 4983 patients enrolled in 10 randomized, placebo‐ or ezetimibe‐controlled Phase 3 ODYSSEY trials. Primary end point for this pooled analysis was percent reduction in non‐HDL‐C and apoB at Week 24; secondary end points included the percentage of patients achieving guideline‐directed treatment goals (National Lipid Association guidelines: non‐HDL‐C <100 or <130 mg/dL for patients at very high and high cardiovascular risk, respectively; European Society of Cardiology/European Atherosclerosis Society guidelines: apoB <80 mg/dL for patients at very‐high cardiovascular risk). Data were grouped according to comparator, alirocumab starting dose, and concomitant statin use. Compared with controls, alirocumab produced significantly greater reductions in non‐HDL‐C and apoB at Week 24 (P<0.0001), an effect extending up to 78 weeks. More alirocumab‐treated patients achieved levels of non‐HDL‐C <100 mg/dL and apoB <80 mg/dL (P≤0.0001 versus control). By Week 24, >70% of alirocumab‐treated patients on background statin achieved non‐HDL‐C <100 or <130 mg/dL, and apoB <80 mg/dL. Safety was comparable across pooled groups and in line with previous reports.
Conclusions
Alirocumab produced significant, sustained reductions in non‐HDL‐C and apoB, allowing more patients to achieve lipid goals compared with placebo or ezetimibe and irrespective of maximally tolerated statin use.
Keywords: alirocumab, apolipoprotein B, cholesterol‐lowering, hypercholesterolemia, non‐high‐density lipoprotein cholesterol, PCSK9
Subject Categories: Clinical Studies, Lipids and Cholesterol, Cardiovascular Disease
Clinical Perspective
What Is New?
Non‐high‐density lipoprotein cholesterol (non‐HDL‐C) and apolipoprotein B (apoB) are specified as treatment targets by some international lipid guidelines.
Alirocumab produced significant, sustained reductions in non‐HDL‐C and apoB, allowing more patients to achieve lipid goals.
What Are the Clinical Implications?
Non‐HDL‐C and apoB are better predictors of atherosclerotic cardiovascular disease risk than calculated low‐density lipoprotein cholesterol alone.
Alirocumab effectively reduces non‐HDL‐C and apoB levels, allowing for better achievement of non‐HDL‐C and apoB levels corresponding to guideline treatment goals.
Introduction
Guidelines for the management of dyslipidemia have traditionally recommended reductions in the level of low‐density lipoprotein cholesterol (LDL‐C) as the primary lipid target of therapy to reduce the risk of atherosclerotic cardiovascular disease (ASCVD). However, LDL‐C has limitations as a predictor of ASCVD risk, particularly in patients with elevated triglyceride levels.1
Additional pro‐atherogenic lipid parameters, such as non‐high‐density lipoprotein cholesterol (non‐HDL‐C) and apolipoprotein (apo) B, may provide important diagnostic information to guide the assessment and management of dyslipidemia and ASCVD risk.2 Current US National Lipid Association recommendations and European Society of Cardiology/European Atherosclerosis Society guidelines have recognized the importance of these lipid parameters. The National Lipid Association recommends non‐HDL‐C as a co‐primary therapy target alongside LDL‐C, and apoB as a secondary target, whereas European guidelines recommend both non‐HDL‐C and apoB as secondary targets.3, 4 Although the 2013 American College of Cardiology/American Heart Association guidelines do not specify non‐HDL‐C treatment thresholds,5 recent recommendations from the 2016 American College of Cardiology Consensus Decision Pathway on the role of nonstatin therapies for LDL‐C‐lowering have introduced non‐HDL‐C thresholds in certain high‐risk patient groups.6
Alirocumab is a monoclonal proprotein convertase subtilisin/kexin type 9 inhibitor that helps prevent LDL receptor degradation, thus increasing clearance of LDL‐C and decreasing LDL‐C blood levels. Alirocumab was evaluated in the ODYSSEY global Phase 3 clinical trial program comprising a comprehensive set of clinical studies in various patient populations. Individual studies7, 8, 9, 10, 11, 12, 13, 14 and a pooled analysis of 8 studies in patients receiving background statin therapy15 have shown that alirocumab produces significant reductions in LDL‐C compared with placebo or ezetimibe in patients at high cardiovascular risk.
The data for this analysis included 10 completed ODYSSEY studies in a broad range of patients with hypercholesterolemia: 8 studies including alirocumab administered to patients treated with background statin, the majority of whom received maximally tolerated statin, or other lipid‐lowering therapies, and 2 studies involving alirocumab administered to patients without background statin. The main aim of the analysis was to investigate the effect of alirocumab on levels of non‐HDL‐C and apoB.
Methods
Study Designs and Participants
In this analysis, data were pooled from 10 Phase 3 trials in the ODYSSEY program, involving 4983 patients with hypercholesterolemia. Detailed methods for each of the 10 studies were previously published elsewhere.7, 8, 9, 10, 11, 12, 13, 14
In 8 trials (pools 1, 3, and 4; total n=2535 patients), the alirocumab starting dose was 75 mg every 2 weeks (Q2W). If pre‐defined ASCVD risk‐based LDL‐C goals were not achieved at Week 8, the alirocumab dose was increased in a blinded manner to 150 mg Q2W at Week 12.7, 8, 9, 10, 11, 12 The alirocumab dose in these pooled groups is referred to herein as alirocumab 75/150 mg. In 2 trials (pool 2; total n=2448 patients), patients received alirocumab 150 mg Q2W from the outset.13, 14
As described above, trials were pooled into 1 of 4 groups: (1) alirocumab 75/150 mg Q2W versus placebo, on background statins (COMBO I, FH I, and FH II)8, 10; (2) alirocumab 150 mg Q2W versus placebo, on background statins (LONG TERM and HIGH FH)13, 14; (3) alirocumab 75/150 mg Q2W versus ezetimibe 10 mg daily, on background statins (COMBO II, OPTIONS I, and OPTIONS II)7, 8, 9; and (4) alirocumab 75/150 mg Q2W versus ezetimibe 10 mg daily, without background statins (ALTERNATIVE and MONO)11, 12 (Table S1).
Trial length ranged from 24 to 104 weeks. Efficacy analyses within each pool were performed to the time point for which data were available for all trials in that pool. For safety analyses, treatment‐emergent adverse events (TEAEs) were defined as events occurring from the first dose of study treatment and up to 70 days after the last dose. All subcutaneous injections (alirocumab 75, 150 mg, or placebo) used a 1 mL injection volume. Patients provided written informed consent before their participation. The trial protocols were reviewed and approved by institutional review boards and independent ethics committees.
The primary efficacy end point for each of these trials was the percent change in calculated LDL‐C levels from baseline to Week 24. Secondary end points included percent change in LDL‐C at Week 12 and percent change from baseline in non‐HDL‐C, apoB, HDL‐C, and triglyceride levels. Given their importance as highlighted in recent guidelines,3, 4 the present analysis focuses on the reduction of non‐HDL‐C and apoB. As well as evaluating percent change from baseline, an additional end point was the percentage of patients achieving levels of these lipoproteins corresponding to guideline‐directed treatment goals (non‐HDL‐C <100 or <130 mg/dL for patients at very‐high and high cardiovascular risk, respectively; apoB <80 mg/dL for patients at very‐high cardiovascular risk, and <100 mg/dL for those at high risk).3, 4
The definition of cardiovascular risk in the Phase 3 studies included in this analysis varied by study. Detailed definitions can be found within Data S1. Given that the specified non‐HDL‐C goals are defined in guidelines according to the estimated degree of ASCVD risk for a given individual, our analysis of non‐HDL‐C goal attainment was performed for the entire population regardless of individual risk as well as stratification by very‐high and high cardiovascular risk (the vast majority of patients in the present analysis were at very‐high or high cardiovascular risk). Analysis of apoB goal attainment was performed for the entire population regardless of individual risk.
Statistical analyses were based on intention‐to‐treat (ITT) principles (including all data regardless of adherence to treatment) and the on‐treatment (modified ITT) population. The modified ITT population was defined as all randomized and treated patients with a baseline non‐HDL‐C value and with on‐treatment non‐HDL‐C values during at least 1 of the planned postbaseline time points. The on‐treatment window was defined as the period up to 21 days after last injection. Patients who discontinued the study drug were required to return for further clinic visits and assessments until the scheduled final visits. Patients with missing data were accounted for using a mixed effect model with repeated measures. The model included fixed categorical effects of treatment group, study, randomization strata as per interactive voice system, time point, treatment‐by‐time point interaction, study‐by‐time point interaction, and strata‐by‐time point interaction, as well as the continuous fixed covariates of baseline lipid value and baseline lipid value‐by‐time point interaction.
For analysis of safety, data were pooled into 2 groups according to the comparator in the individual trials, comprising (1) 5 placebo‐controlled trials; and (2) 5 ezetimibe‐controlled trials.
Results
Participants and Baseline Characteristics
A total of 4983 patients with inadequately managed hypercholesterolemia were randomized across the 10 trials. Baseline characteristics for the pool of patients analyzed here were reported previously16 and were generally similar between alirocumab and control patients within each pooled group (Table S1).
Pool 1 included the COMBO I study, which evaluated patients at high risk of ASCVD, and the FH I and FH II studies, which evaluated patients with heterozygous familial hypercholesterolemia (HeFH). This pool thus included a higher proportion of patients receiving additional nonstatin lipid‐lowering therapies and a higher proportion with familial hypercholesterolemia compared with the other pooled groups (Table S1).
Baseline mean LDL‐C, non‐HDL‐C, and apoB levels exceeded National Lipid Association and European Society of Cardiology/European Atherosclerosis Society recommended goals for high‐risk hypercholesterolemia patients (100, 130, and 100 mg/dL, respectively) in all pooled groups. Of note, mean baseline levels for these lipid parameters were considerably higher in the group not receiving statin therapy (pool 4) compared with those on statins (pools 1–3; Table S1). Median fasting triglyceride levels at baseline ranged from 111.0 to 147.5 mg/dL across all pooled groups.
Alirocumab dose was increased from 75 mg Q2W to 150 mg Q2W at Week 12 in 34.5% of patients in pool 1 (placebo‐controlled, receiving background statins), 17.7% of patients in pool 3 (ezetimibe‐controlled, receiving background statins), and 43.9% of patients in pool 4 (ezetimibe‐controlled, no background statins). All alirocumab‐treated patients in pool 2 received alirocumab 150 mg Q2W from the outset.
Efficacy
Changes in lipid parameters across pooled groups
The baseline levels of each lipid parameter for each of the pools are given in Table S1. Both alirocumab and ezetimibe reduced non‐HDL‐C and apoB levels from baseline. Patients allocated to placebo (ie, receiving background statin treatment with or without other lipid‐lowering therapy only) experienced mild increases in these lipid parameters (Figure 1). In all 4 pools, alirocumab produced superior reductions in non‐HDL‐C and apoB at 12 and 24 weeks compared with placebo or ezetimibe, irrespective of alirocumab dose or background statin therapy (P<0.0001; Figure 1; Table S2). The benefit of alirocumab was apparent from the first lipid measurement (Week 4 for non‐HDL‐C; Week 12 for apoB) and was sustained throughout the trial periods for both lipid parameters in both the modified ITT (Figure 1) and ITT (Figure S1) population.
Figure 1.
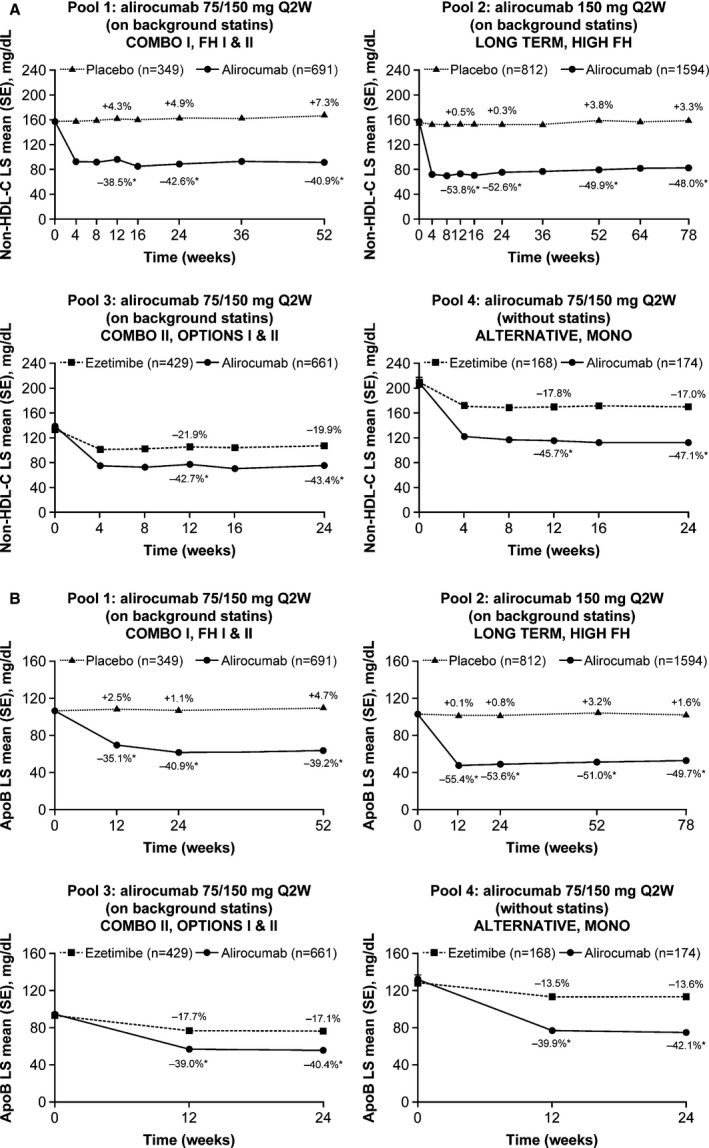
Change in non‐HDL‐C and apoB levels over time (on‐treatment [mITT] population). A, Non‐HDL‐C. B, ApoB. The percent values represent the percent change from baseline at each time point. *P<0.0001 vs control group. ApoB indicates apolipoproteinB; LS, least squares; mITT, modified intention‐to‐treat; non‐HDL‐C, non‐high‐density lipoprotein cholesterol; Q2W, every 2 weeks; SE, standard error.
Data on other lipid parameters (calculated LDL‐C, HDL‐C, and fasting triglyceride) from pools 1 to 3 (patients receiving background statins) were reported previously.15 Briefly, treatment with alirocumab 75/150 mg Q2W or 150 mg Q2W added to statins resulted in significantly reduced LDL‐C levels at Week 24 compared with both placebo and ezetimibe in all patient pools (P<0.0001; Table S2). In pool 4, in which patients did not receive statins, LDL‐C was significantly reduced in the alirocumab 75/150 mg Q2W group versus ezetimibe (P<0.0001; Table S2). Alirocumab also produced a significant increase in HDL‐C and decrease in fasting triglyceride compared with placebo at Week 24 (P<0.0001; Table S2).
Combined data from all patients in all 10 trials showed that average LDL‐C, non‐HDL‐C, and apoB levels were highly correlated with one another throughout the treatment period (Pearson correlation coefficients ≥0.922 for the 3 pairwise comparisons comparing LDL‐C with either non‐HDL‐C or apoB and comparing non‐HDL‐C with apoB; all P<0.0001).
Achievement of non‐HDL‐C and apoB levels corresponding to treatment goals
At 12 and 24 weeks, in all patients pooled regardless of cardiovascular risk categorization, alirocumab allowed a significantly higher percent of patients to achieve levels of non‐HDL‐C <100 mg/dL, non‐HDL‐C <130 mg/dL (except for pool 3 at Week 12), and apoB <80 mg/dL compared with placebo or ezetimibe (P≤0.0001; Figures 2A, 3A, and 4).
Figure 2.
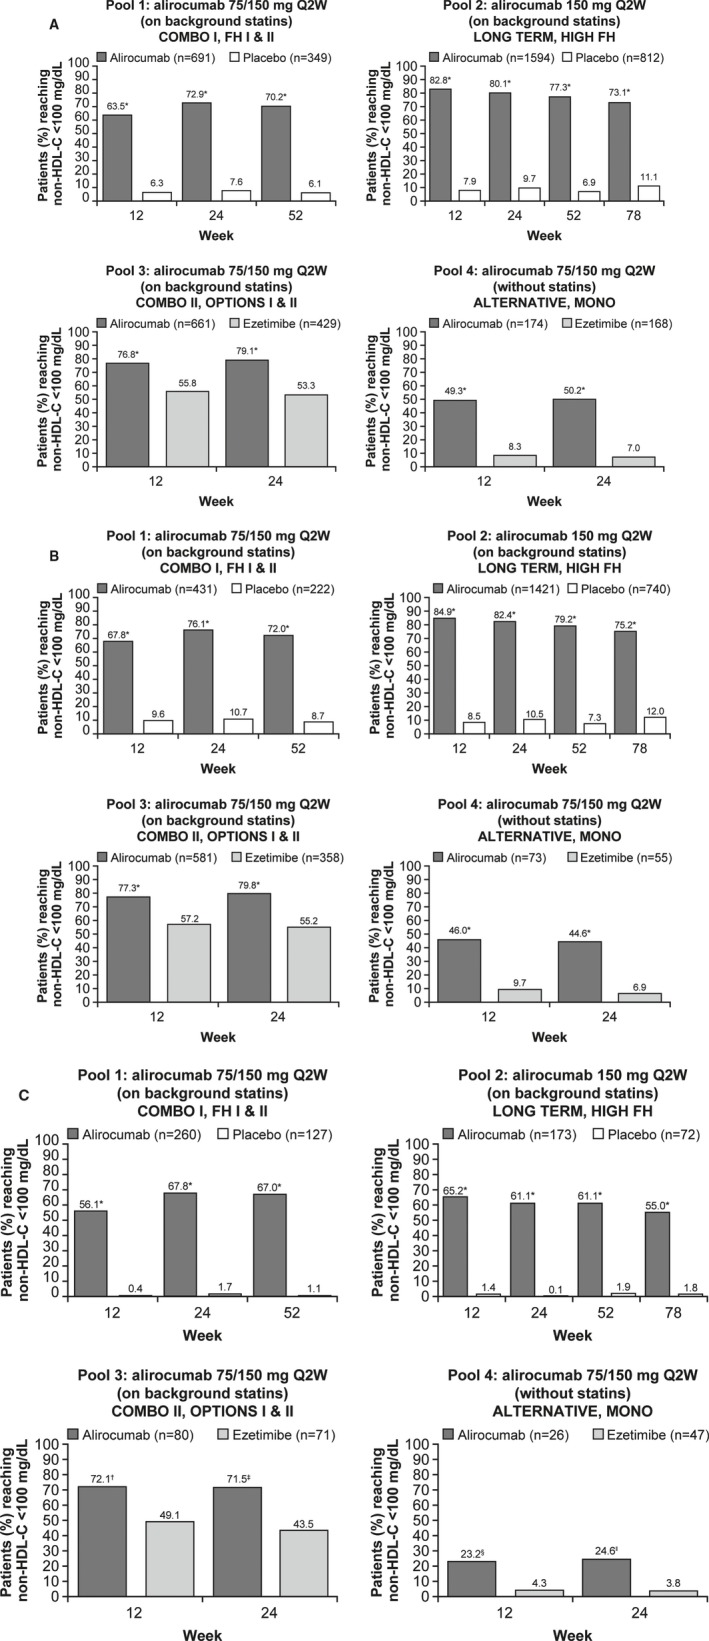
Percent of patients achieving non‐HDL‐C levels of <100 mg/dL during the studies, overall and by cardiovascular risk (on‐treatment [mITT] population). A, All patients (regardless of cardiovascular risk). B, Patients with very‐high cardiovascular risk. C, Patients with high cardiovascular risk. *P<0.0001 vs control group at all time points in all study pools and patient categories, except for pool 3 and pool 4 of the “high cardiovascular risk” category where † P=0.0030, ‡ P=0.0008, § P=0.0159, and ‖ P=0.0220. mITT, modified intention‐to‐treat; non‐HDL‐C, non‐high‐density lipoprotein cholesterol; Q2W, every 2 weeks.
Figure 3.
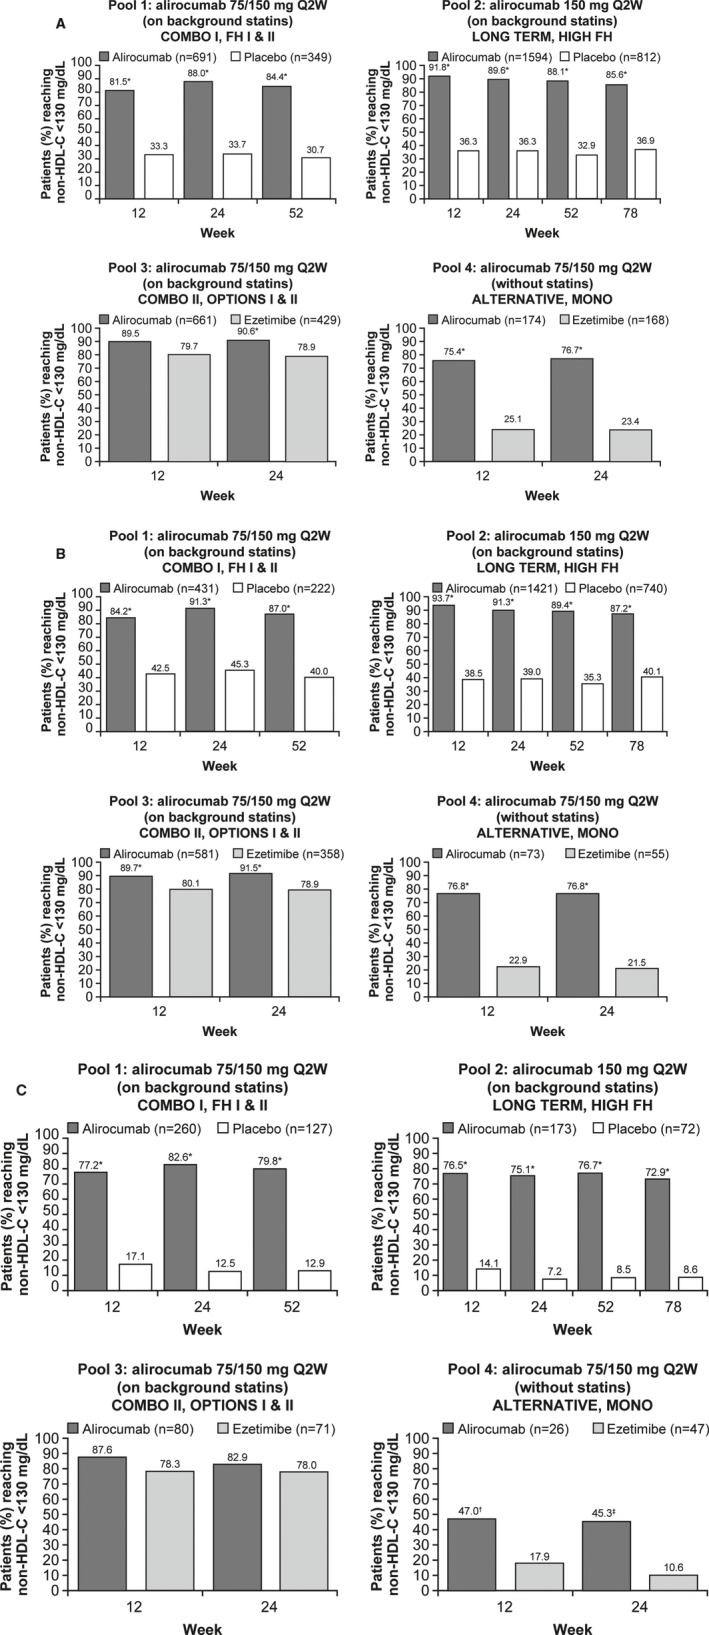
Percent of patients achieving non‐HDL‐C levels of <130 mg/dL during the studies, overall and by cardiovascular risk (on‐treatment [mITT] population). A, All patients (regardless of cardiovascular risk). B, Patients with very‐high cardiovascular risk. C, Patients with high cardiovascular risk. *P<0.0001 vs control group at all time points in all study pools and patient categories, except for pool 4 of the “high cardiovascular risk” category where † P=0.0049 and ‡ P=0.0018. mITT, modified intention‐to‐treat; non‐HDL‐C, non‐high‐density lipoprotein cholesterol; Q2W, every 2 weeks.
Figure 4.
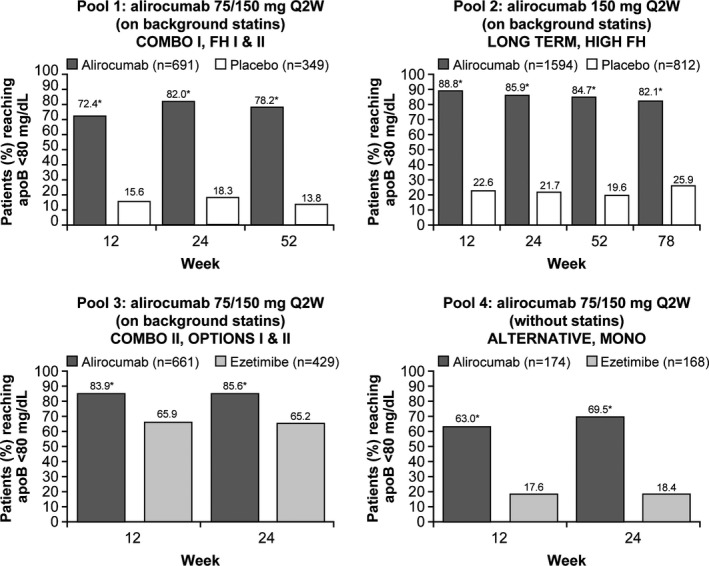
Percent of patients achieving apoB levels <80 mg/dL during the studies (mITT population). *P<0.0001 vs control group at all time points and in all study pools. ApoB indicates apolipoprotein B; mITT, modified intention‐to‐treat; Q2W, every 2 weeks.
Data for each of the 4 individual pools are described as follows.
Pool 1: patients receiving alirocumab 75/150 mg Q2W or placebo with background statins (COMBO I, FH I, and FH II)
At Week 12, before the potential protocol‐directed alirocumab dose increase, alirocumab 75 mg Q2W allowed 63.5%, 81.5%, and 72.4% of patients to achieve levels of non‐HDL‐C <100 mg/dL, non‐HDL‐C <130 mg/dL, and apoB <80 mg/dL, respectively, in all patients pooled regardless of cardiovascular risk categorization (Figures 2A, 3A, and 4). By Week 24, following the potential alirocumab dose increase to 150 mg Q2W at Week 12, the percent of patients achieving these levels rose to 72.9%, 88.0%, and 82.0%, respectively. In contrast, 7.6%, 33.7%, and 18.3% of patients in the placebo group achieved non‐HDL‐C <100 mg/dL, non‐HDL‐C <130 mg/dL, and apoB <80 mg/dL levels, respectively, at Week 24 (P<0.0001 versus control). When stratified by cardiovascular risk, attainment of specified non‐HDL‐C goals with alirocumab 75/150 mg Q2W versus placebo in patients with very‐high or high cardiovascular risk were in keeping with those observed in the whole population (P<0.0001 versus placebo at all time points; Figures 2B, 2C, 3B, and 3C).
Pool 2: patients receiving alirocumab 150 mg Q2W or placebo with background statins (LONG TERM and HIGH FH)
The mean percent reductions at 24 weeks in non‐HDL‐C and apoB levels with alirocumab 150 mg Q2W were numerically greater than the corresponding reductions with alirocumab 75/150 mg Q2W observed in other groups (Table S2). In all patients (ie, regardless of cardiovascular risk) alirocumab 150 mg Q2W allowed 82.8% of patients to achieve non‐HDL‐C <100 mg/dL, with 91.8% achieving non‐HDL‐C <130 mg/dL and 88.8% achieving apoB <80 mg/dL at Week 12 (Figures 2A, 3A, and 4) compared with 7.9%, 36.3%, and 22.6% of patients who received placebo (P<0.0001 versus control). Similar results were obtained when the specified non‐HDL‐C goal attainments were stratified by cardiovascular risks (P<0.0001 versus placebo at all time points; Figures 2B, 2C, 3B, and 3C).
Pool 3: patients receiving alirocumab 75/150 mg Q2W or ezetimibe with background statins (COMBO II, OPTIONS I, and OPTIONS II)
Alirocumab allowed 76.8% of all patients (pooled regardless of cardiovascular risk) to achieve non‐HDL‐C <100 mg/dL at Week 12, rising slightly to 79.1% at Week 24 after the protocol‐directed dose increase (Figure 2A). Corresponding values were 89.5% (Week 12) and 90.6% (Week 24) for non‐HDL‐C <130 mg/dL (Figure 3A), and 83.9% (Week 12) and 85.6% (Week 24) for apoB <80 mg/dL (Figure 4). For each time point, alirocumab allowed a significantly greater proportion of patients to achieve each of the specified levels than ezetimibe (P≤0.0001), except at Week 12 (before the potential protocol‐directed alirocumab dose increase) for non‐HDL‐C <130 mg/dL where no significant difference between alirocumab and ezetimibe was found (P=0.1222; Figure 3A). In patients with very‐high or high cardiovascular risk, achievement of specified non‐HDL‐C goals were generally higher with alirocumab 75/150 mg Q2W versus ezetimibe at all time points (P≤0.0030; Figures 2B, 2C, and 3B), except for non‐HDL‐C <130 mg/dL in patients with high cardiovascular risk where no significant differences between alirocumab and ezetimibe (Figure 3C) were found.
Pool 4: patients receiving alirocumab 75/150 mg Q2W or ezetimibe without background statin (ALTERNATIVE and MONO)
The mean percent reductions in non‐HDL‐C and apoB levels at Week 24 were similar in this group compared with other pools receiving the same alirocumab dose regimen (75/150 mg Q2W; Table S2). However, patients in this pool who were not receiving background statin therapy had higher baseline lipid levels than patients in the pools with background statin (Table S1). Therefore, achievement of the specified lipid levels was less robust in this group (Figures 2A, 3A, and 4). Nevertheless, alirocumab allowed significantly more patients (regardless of cardiovascular risk) to achieve the specified non‐HDL‐C and apoB levels compared with ezetimibe (P<0.0001; Figures 2A, 3A, and 4). Similar results were reported with alirocumab 75/150 mg Q2W in patients with very‐high or high cardiovascular risk for specified non‐HDL‐C goals (P≤0.0220 versus ezetimibe; Figures 2B, 2C, 3B, and 3C). Corresponding results for all goal achievement data analyzed using the ITT population (Figures S2 through S4) were generally similar to the aforementioned results analyzed using the on‐treatment (modified ITT) population.
Safety
Safety data for alirocumab across 14 Phase 2 and Phase 3 studies were previously reported,17, 18 as were data from the 10 Phase 3 ODYSSEY studies included in the present analysis.16, 18 In the 10 Phase 3 studies evaluating Q2W doses of alirocumab, the overall rates of TEAEs, serious TEAEs, and discontinuations because of TEAEs were similar for alirocumab versus control (Table S3). More patients experienced injection‐site reactions in the alirocumab group compared with placebo (placebo‐controlled studies: alirocumab 7.2% versus 5.3% for placebo; ezetimibe‐controlled studies: alirocumab 2.9% versus 2.1% for ezetimibe; Table S3).
Discussion
Non‐HDL‐C provides a measure of the cholesterol content of all pro‐atherogenic particles including LDL‐C, very low‐density lipoprotein cholesterol, intermediate‐density lipoprotein cholesterol, remnant lipoproteins, and lipoprotein (a). One molecule of apoB resides on each atherogenic lipoprotein.19 Therefore, in current US National Lipid Association recommendations and European guidelines, both non‐HDL‐C and apoB are considered important lipid treatment targets alongside LDL‐C.3, 4
This analysis examined the effects of alirocumab on non‐HDL‐C and apoB from 10 ODYSSEY Phase 3 studies including 4983 patients with hypercholesterolemia, pooled into 4 groups according to dose of alirocumab, use of background statin therapy, and study control (placebo or ezetimibe). Alirocumab produced robust and sustainable reductions in non‐HDL‐C and apoB levels, as well as in LDL‐C (the primary endpoint of the studies), and average non‐HDL‐C and apoB levels highly correlated with average LDL‐C throughout the treatment period. Compared with ezetimibe, treatment with alirocumab more than doubled the least‐squares mean reduction in non‐HDL‐C and apoB levels. Substantial reductions were irrespective of concomitant statin therapy and alirocumab dose regimen (75/150 mg Q2W or 150 mg Q2W). Moreover, the effect of alirocumab was evident upon the first assessment from 4 weeks, and was sustained throughout the studies.
In addition, alirocumab allowed a high percentage of patients to achieve non‐HDL‐C and apoB levels that correspond to guideline‐directed goals, which were sustained throughout the studies. For example, compared with statins alone (ie, in patients receiving placebo), alirocumab allowed a more than 2‐fold higher achievement of non‐HDL‐C levels of <130 mg/dL and an almost 10‐fold higher achievement of the more stringent non‐HDL‐C target of <100 mg/dL at Week 24. Moreover, in the absence of background statins, alirocumab produced an almost 3‐fold increase in the percent of patients achieving non‐HDL‐C <130 mg/dL and an almost 6‐fold increase in the percent achieving <100 mg/dL compared with ezetimibe. With concomitant statin therapy, alirocumab also allowed a significantly greater percentage of patients to achieve the specified non‐HDL‐C levels than ezetimibe. These were consistent overall with the results from analysis where patients were grouped according to cardiovascular risk categories. Results from the present analysis are in general agreement with achievement of LDL‐C goals in a previous analysis of 8 ODYSSEY studies in patients receiving concomitant statin (corresponding to pools 1–3 in the current analysis).9 In that analysis, LDL‐C goal attainment was investigated in patients grouped according to whether the patient was at very high (LDL‐C goal <70 mg/dL) or high risk (goal <100 mg/dL) and overall 75.2–79.0% of patients achieved these risk‐based LDL‐C goals.15
LDL‐C in isolation may be an inadequate measure of total ASCVD risk, as it fails to account for cholesterol carried by other lipoproteins, such as triglyceride‐rich lipoproteins. When triglyceride levels are high, the levels of remnant atherogenic lipoproteins are also elevated; in these circumstances, the risk predicted by LDL‐C alone is underestimated.1 In addition, discordance between LDL‐C, non‐HDL‐C, and apoB levels may exist in a significant proportion of patients with dyslipidemia, including those with metabolic syndrome, type 2 diabetes mellitus, and obesity.20, 21, 22 For example, the Very Large Database of Lipids 2 study showed that, among patients achieving an LDL‐C goal of ≤70 mg/dL, 15% may still have a non‐HDL‐C level ≥100 mg/dL, increasing to 22% among patients with high triglyceride levels (150–199 mg/dL).22
Such discordance means that residual ASCVD risk may be overlooked with LDL‐C‐centric treatment.1 A number of studies have demonstrated that non‐HDL‐C and apoB are superior markers of ASCVD risk compared with LDL‐C alone.19, 23, 24, 25, 26, 27, 28, 29 Indeed, some studies suggest that apoB levels may have the strongest association with risk.23, 24, 26
Because most ASCVD outcomes trials have utilized LDL‐C as the primary lipid outcome parameter, the conclusions of the current analysis are limited by the lack of studies demonstrating the correlation of non‐HDL‐C or apoB levels as a primary endpoint with ASCVD risk. Nevertheless, a meta‐analysis of ASCVD outcomes trials has supported the association between reduced non‐HDL‐C and apoB levels with reduced ASCVD events.30 Moreover, the randomized, double‐blind Helsinki Heart study, one of the few ASCVD outcomes studies that evaluated non‐HDL‐C as the primary lipid outcome, demonstrated an association between reduction in non‐HDL‐C levels and cardiovascular events.31 Furthermore, a recently published post‐hoc analysis from the 10 ODYSSEY trials used in the present study showed that reductions in non‐HDL‐C and apoB were associated with improved cardiovascular outcomes, regardless of the treatment received during the trials.32
At the time of writing, the correlation between the lipid effects of alirocumab and ASCVD events are unproven. However, the ongoing ODYSSEY OUTCOMES trial (NCT01663402) is evaluating the potential benefits of alirocumab in reducing major cardiovascular events in patients with acute coronary syndrome within 1 year who have not achieved lipid management goals with intense statin therapy.
Conclusion
Non‐HDL‐C and apoB are useful in assessment of ASCVD risk, and are specified as treatment targets by international lipid guidelines. Data from this analysis of 4983 patients derived from 4 pooled groups support the role of alirocumab in effectively reducing levels of non‐HDL‐C, and apoB levels, as well as allowing substantially better achievement of non‐HDL‐C and apoB levels that correspond to guideline‐directed goals compared with placebo or ezetimibe.
Sources of Funding
This analysis was funded by Sanofi and Regeneron Pharmaceuticals, Inc. The following people from the study sponsors provided editorial comments on the manuscript: Veronica Lee (Sanofi), and William J. Sasiela and Rita Samuel (both Regeneron Pharmaceuticals, Inc.). The authors were responsible for all content and editorial decisions, and received no honoraria related to the development of this publication. Medical writing assistance and editorial support, under the direction of the authors, were provided by Mark Holland, PhD and Emmanuel Ogunnowo, PhD (Prime, Knutsford, Cheshire, UK), funded by Sanofi and Regeneron Pharmaceuticals, Inc.
Disclosures
Dr Bays has served as a consultant and/or speaker to Alnylam, Amarin, Amgen, AstraZeneca, Eisai, Eli Lilly, Merck, Novartis, NovoNordisk, Regeneron Pharmaceuticals, Inc., Sanofi, and Takeda; and has received research grants from Amarin, Amgen, Ardea, Arisaph, Catabasis, Cymabay, Eisai, Elcelyx, Eli Lilly, Esperion, Hanmi, Hisun, F. Hoffman LaRoche, Home Access, Janssen, Johnson and Johnson, Merck, Necktar, Novartis, Novo Nordisk, Omthera, Orexigen, Pfizer, Pronova, Regeneron Pharmaceuticals, Inc., Sanofi, Takeda, TIMI, VIVUS, and Wpu Pharmaceuticals. Dr Leiter has received research support from Amgen, AstraZeneca, Eli Lilly, Kowa, Merck, Pfizer, Regeneron Pharmaceuticals, Inc., Sanofi, and The Medicines Company; speakers' bureau fees from Amgen, AstraZeneca, Merck, and Sanofi; and advisory panel fees from Aegerion, Amgen, AstraZeneca, Eli Lilly, Merck, Regeneron Pharmaceuticals, Inc., and Sanofi. Professor Colhoun has received research grants from Roche, Pfizer, Eli Lilly, Boehringer Ingelheim, and AstraZeneca; speakers’ bureau fees from Pfizer; honoraria from Pfizer; has ownership interest in Roche; and has received consultant/advisory board fees from Pfizer, Sanofi Aventis, Regeneron Pharmaceuticals, Inc., Novartis, and Eli Lilly. Dr Thompson is a consultant to Medical Affairs at Regeneron. Dr Bessac is an employee of and stockholder in Sanofi. Dr Pordy is an employee of and stockholder in Regeneron Pharmaceutics, Inc. Dr Toth has received speakers’ bureau fees from Abbvie, Amarin, AstraZeneca, GSK, Kowa, and Merck and Co; and consultant/advisory board fees from Atherotech, Kowa, Amgen, AstraZeneca, Liposcience, and Merck and Co.
Supporting information
Data S1. Supplemental methods.
Table S1. Overview of Studies Included in the Pooled Analysis and Baseline Characteristics (n=4983 Patients With Hypercholesterolemia)
Table S2. Change From Baseline in Lipid Parameters at Week 24 (ITT Population)
Table S3. Safety Analysis (Pool of 10 Phase 3 Trials*)
Figure S1. Change in non‐HDL‐C and apoB levels over time (ITT population).
Figure S2. Percent of patients achieving non‐HDL‐C levels of <100 mg/dL during the studies, overall and by cardiovascular risk (ITT population).
Figure S3. Percent of patients achieving non‐HDL‐C levels of <130 mg/dL during the studies, overall and by cardiovascular risk (ITT population).
Figure S4. Percent of patients achieving apoB levels <80 mg/dL during the studies (ITT population).
(J Am Heart Assoc. 2017;6:e005639 DOI: 10.1161/JAHA.117.005639.)28862926
This work was reported in part at the National Lipid Association Annual Meeting, June 11 to 14, 2015, in Chicago, IL.
References
- 1. Hoenig MR. Implications of the obesity epidemic for lipid‐lowering therapy: non‐HDL cholesterol should replace LDL cholesterol as the primary therapeutic target. Vasc Health Risk Manag. 2008;4:143–156. [DOI] [PMC free article] [PubMed] [Google Scholar]
- 2. Davidson MH, Ballantyne CM, Jacobson TA, Bittner VA, Braun LT, Brown AS, Brown WV, Cromwell WC, Goldberg RB, McKenney JM, Remaley AT, Sniderman AD, Toth PP, Tsimikas S, Ziajka PE, Maki KC, Dicklin MR. Clinical utility of inflammatory markers and advanced lipoprotein testing: advice from an expert panel of lipid specialists. J Clin Lipidol. 2011;5:338–367. [DOI] [PubMed] [Google Scholar]
- 3. Bays HE, Jones PH, Orringer CE, Brown WV, Jacobson TA. National lipid association annual summary of clinical lipidology 2016. J Clin Lipidol. 2016;10:S1–S43. [DOI] [PubMed] [Google Scholar]
- 4. Catapano AL, Graham I, De Backer G, Wiklund O, Chapman MJ, Drexel H, Hoes A, Jennings C, Landmesser U, Pedersen TR, Reiner Ž, Riccardi G, Taskinen MR, Tokgozoglu L, Verschuren W, Vlachopoulos C, Wood D, Zamorano JL. 2016 ESC/EAS guidelines for the management of dyslipidaemias. Eur Heart J. 2016;37:2999–3058. [DOI] [PubMed] [Google Scholar]
- 5. Stone NJ, Robinson JG, Lichtenstein AH, Bairey Merz CN, Blum CB, Eckel RH, Goldberg AC, Gordon D, Levy D, Lloyd‐Jones DM, McBride P, Schwartz JS, Shero ST, Smith SC Jr, Watson K, Wilson PW; American College of Cardiology/American Heart Association Task Force on Practice Guidelines . 2013 ACC/AHA guideline on the treatment of blood cholesterol to reduce atherosclerotic cardiovascular risk in adults: a report of the American College of Cardiology/American Heart Association Task Force on Practice Guidelines. J Am Coll Cardiol. 2014;63:2889–2934. [DOI] [PubMed] [Google Scholar]
- 6. Lloyd‐Jones DM, Morris PB, Ballantyne CM, Birtcher KK, Daly DD Jr, DePalma SM, Minissian MB, Orringer CE, Smith SC Jr. 2016 ACC expert consensus decision pathway on the role of non‐statin therapies for LDL‐cholesterol lowering in the management of atherosclerotic cardiovascular disease risk: a report of the American College of Cardiology Task Force on Clinical Expert Consensus Documents. J Am Coll Cardiol. 2016;68:92–125. [DOI] [PubMed] [Google Scholar]
- 7. Bays H, Gaudet D, Weiss R, Ruiz JL, Watts GF, Gouni‐Berthold I, Robinson J, Zhao J, Hanotin C, Donahue S. Alirocumab as add‐on to atorvastatin versus other lipid treatment strategies: ODYSSEY OPTIONS I randomized trial. J Clin Endocrinol Metab. 2015;100:3140–3148. [DOI] [PMC free article] [PubMed] [Google Scholar]
- 8. Kereiakes DJ, Robinson JG, Cannon CP, Lorenzato C, Pordy R, Chaudhari U, Colhoun HM. Efficacy and safety of the proprotein convertase subtilisin/kexin type 9 inhibitor alirocumab among high cardiovascular risk patients on maximally tolerated statin therapy: the ODYSSEY COMBO I study. Am Heart J. 2015;169:906–915.e913. [DOI] [PubMed] [Google Scholar]
- 9. Farnier M, Jones P, Severance R, Averna M, Steinhagen‐Thiessen E, Colhoun HM, Du Y, Hanotin C, Donahue S. Efficacy and safety of adding alirocumab to rosuvastatin versus adding ezetimibe or doubling the rosuvastatin dose in high cardiovascular‐risk patients: the ODYSSEY OPTIONS II randomized trial. Atherosclerosis. 2016;244:138–146. [DOI] [PubMed] [Google Scholar]
- 10. Kastelein JJ, Ginsberg HN, Langslet G, Hovingh GK, Ceska R, Dufour R, Blom D, Civeira F, Krempf M, Lorenzato C, Zhao J, Pordy R, Baccara‐Dinet MT, Gipe DA, Geiger MJ, Farnier M. ODYSSEY FH I and FH II: 78 week results with alirocumab treatment in 735 patients with heterozygous familial hypercholesterolaemia. Eur Heart J. 2015;36:2996–3003. [DOI] [PMC free article] [PubMed] [Google Scholar]
- 11. Moriarty PM, Thompson PD, Cannon CP, Guyton JR, Bergeron J, Zieve FJ, Bruckert E, Jacobson TA, Kopecky SL, Baccara‐Dinet MT, Du Y, Pordy R, Gipe DA. Efficacy and safety of alirocumab vs ezetimibe in statin‐intolerant patients, with a statin rechallenge arm: the ODYSSEY ALTERNATIVE randomized trial. J Clin Lipidol. 2015;9:758–769. [DOI] [PubMed] [Google Scholar]
- 12. Roth EM, Taskinen MR, Ginsberg HN, Kastelein JJ, Colhoun HM, Robinson JG, Merlet L, Pordy R, Baccara‐Dinet MT. Monotherapy with the PCSK9 inhibitor alirocumab versus ezetimibe in patients with hypercholesterolemia: results of a 24 week, double‐blind, randomized Phase 3 trial. Int J Cardiol. 2014;176:55–61. [DOI] [PubMed] [Google Scholar]
- 13. Ginsberg HN, Rader DJ, Raal FJ, Guyton JR, Baccara‐Dinet MT, Lorenzato C, Pordy R, Stroes E. Efficacy and safety of alirocumab in patients with heterozygous familial hypercholesterolemia and LDL‐C of 160 mg/dl or higher. Cardiovasc Drugs Ther. 2016;30:473–483. [DOI] [PMC free article] [PubMed] [Google Scholar]
- 14. Robinson JG, Farnier M, Krempf M, Bergeron J, Luc G, Averna M, Stroes ES, Langslet G, Raal FJ, El Shahawy M, Koren MJ, Lepor NE, Lorenzato C, Pordy R, Chaudhari U, Kastelein JJP. Efficacy and safety of alirocumab in reducing lipids and cardiovascular events. N Engl J Med. 2015;372:1489–1499. [DOI] [PubMed] [Google Scholar]
- 15. Farnier M, Gaudet D, Valcheva V, Minini P, Miller K, Cariou B. Efficacy of alirocumab in high cardiovascular risk populations with or without familial hypercholesterolemia: pooled analysis of eight ODYSSEY Phase 3 clinical program trials. Int J Cardiol. 2016;223:750–757. [DOI] [PubMed] [Google Scholar]
- 16. Gaudet D, Watts GF, Robinson JG, Minini P, Sasiela WJ, Edelberg J, Louie MJ, Raal FJ. Effect of alirocumab on lipoprotein(a) over ≥1.5 years (from the Phase 3 ODYSSEY program). Am J Cardiol. 2017;119:40–46. [DOI] [PubMed] [Google Scholar]
- 17. Jones PH, Bays HE, Chaudhari U, Pordy R, Lorenzato C, Miller K, Robinson JG. Safety of alirocumab (a PCSK9 monoclonal antibody) from 14 randomized trials. Am J Cardiol. 2016;118:1805–1811. [DOI] [PubMed] [Google Scholar]
- 18. Robinson JG, Rosenson RS, Farnier M, Chaudhari U, Sasiela WJ, Merlet L, Miller K, Kastelein JJ. Safety of very low low‐density lipoprotein cholesterol levels with alirocumab: pooled data from randomized trials. J Am Coll Cardiol. 2017;69:471–482. [DOI] [PubMed] [Google Scholar]
- 19. Kastelein JJ, van der Steeg WA, Holme I, Gaffney M, Cater NB, Barter P, Deedwania P, Olsson AG, Boekholdt SM, Demicco DA, Szarek M, LaRosa JC, Pedersen TR, Grundy SM. Lipids, apolipoproteins, and their ratios in relation to cardiovascular events with statin treatment. Circulation. 2008;117:3002–3009. [DOI] [PubMed] [Google Scholar]
- 20. Kilgore M, Muntner P, Woolley JM, Sharma P, Bittner V, Rosenson RS. Discordance between high non‐HDL cholesterol and high LDL‐cholesterol among US adults. J Clin Lipidol. 2014;8:86–93. [DOI] [PubMed] [Google Scholar]
- 21. Wilkins JT, Li RC, Sniderman A, Chan C, Lloyd‐Jones DM. Discordance between apolipoprotein B and LDL‐cholesterol in young adults predicts coronary artery calcification: the CARDIA study. J Am Coll Cardiol. 2016;67:193–201. [DOI] [PMC free article] [PubMed] [Google Scholar]
- 22. Elshazly MB, Martin SS, Blaha MJ, Joshi PH, Toth PP, McEvoy JW, Al‐Hijji MA, Kulkarni KR, Kwiterovich PO, Blumenthal RS, Jones SR. Non‐high‐density lipoprotein cholesterol, guideline targets, and population percentiles for secondary prevention in 1.3 million adults: the VLDL‐2 study (very large database of lipids). J Am Coll Cardiol. 2013;62:1960–1965. [DOI] [PubMed] [Google Scholar]
- 23. Pencina MJ, D'Agostino RB, Zdrojewski T, Williams K, Thanassoulis G, Furberg CD, Peterson ED, Vasan RS, Sniderman AD. Apolipoprotein B improves risk assessment of future coronary heart disease in the Framingham Heart Study beyond LDL‐C and non‐HDL‐C. Eur J Prev Cardiol. 2015;22:1321–1327. [DOI] [PubMed] [Google Scholar]
- 24. Thanassoulis G, Williams K, Ye K, Brook R, Couture P, Lawler PR, de Graaf J, Furberg CD, Sniderman A. Relations of change in plasma levels of LDL‐C, non‐HDL‐C and apoB with risk reduction from statin therapy: a meta‐analysis of randomized trials. J Am Heart Assoc. 2014;3:e000759 DOI: 10.1161/JAHA.113.000759. [DOI] [PMC free article] [PubMed] [Google Scholar]
- 25. Boekholdt SM, Arsenault BJ, Mora S, Pedersen TR, LaRosa JC, Nestel PJ, Simes RJ, Durrington P, Hitman GA, Welch KM, DeMicco DA, Zwinderman AH, Clearfield MB, Downs JR, Tonkin AM, Colhoun HM, Gotto AM Jr, Ridker PM, Kastelein JJ. Association of LDL cholesterol, non‐HDL cholesterol, and apolipoprotein B levels with risk of cardiovascular events among patients treated with statins: a meta‐analysis. JAMA. 2012;307:1302–1309. [DOI] [PubMed] [Google Scholar]
- 26. Sniderman AD, Williams K, Contois JH, Monroe HM, McQueen MJ, de Graaf J, Furberg CD. A meta‐analysis of low‐density lipoprotein cholesterol, non‐high‐density lipoprotein cholesterol, and apolipoprotein B as markers of cardiovascular risk. Circ Cardiovasc Qual Outcomes. 2011;4:337–345. [DOI] [PubMed] [Google Scholar]
- 27. Robinson JG, Wang S, Smith BJ, Jacobson TA. Meta‐analysis of the relationship between non‐high‐density lipoprotein cholesterol reduction and coronary heart disease risk. J Am Coll Cardiol. 2009;53:316–322. [DOI] [PubMed] [Google Scholar]
- 28. Emerging Risk Factors Collaboration ; Di Angelantonio E, Sarwar N, Perry P, Kaptoge S, Ray KK, Thompson A, Wood AM, Lewington S, Sattar N, Packard CJ, Collins R, Thompson SG, Danesh J. Major lipids, apolipoproteins, and risk of vascular disease. JAMA. 2009;302:1993–2000. [DOI] [PMC free article] [PubMed] [Google Scholar]
- 29. Arsenault BJ, Rana JS, Stroes ES, Despres JP, Shah PK, Kastelein JJ, Wareham NJ, Boekholdt SM, Khaw KT. Beyond low‐density lipoprotein cholesterol: respective contributions of non‐high‐density lipoprotein cholesterol levels, triglycerides, and the total cholesterol/high‐density lipoprotein cholesterol ratio to coronary heart disease risk in apparently healthy men and women. J Am Coll Cardiol. 2009;55:35–41. [DOI] [PubMed] [Google Scholar]
- 30. Robinson JG, Wang S, Jacobson TA. Meta‐analysis of comparison of effectiveness of lowering apolipoprotein B versus low‐density lipoprotein cholesterol and nonhigh‐density lipoprotein cholesterol for cardiovascular risk reduction in randomized trials. Am J Cardiol. 2012;110:1468–1476. [DOI] [PubMed] [Google Scholar]
- 31. Frick MH, Elo O, Haapa K, Heinonen OP, Heinsalmi P, Helo P, Huttunen JK, Kaitaniemi P, Koskinen P, Manninen V, Mäenpää H, Mälkönen M, Mänttäri M, Norola S, Pasternack A, Pikkarainen J, Romo M, Sjöblom T, Nikkilä EA. Helsinki Heart Study: primary‐prevention trial with gemfibrozil in middle‐aged men with dyslipidemia. Safety of treatment, changes in risk factors, and incidence of coronary heart disease. N Engl J Med. 1987;317:1237–1245. [DOI] [PubMed] [Google Scholar]
- 32. Ray KK, Ginsberg HN, Davidson MH, Pordy R, Bessac L, Minini P, Eckel RH, Cannon CP. Reductions in atherogenic lipids and major cardiovascular events: a pooled analysis of 10 ODYSSEY trials comparing alirocumab with control. Circulation. 2016;134:1931–1943. [DOI] [PMC free article] [PubMed] [Google Scholar]
Associated Data
This section collects any data citations, data availability statements, or supplementary materials included in this article.
Supplementary Materials
Data S1. Supplemental methods.
Table S1. Overview of Studies Included in the Pooled Analysis and Baseline Characteristics (n=4983 Patients With Hypercholesterolemia)
Table S2. Change From Baseline in Lipid Parameters at Week 24 (ITT Population)
Table S3. Safety Analysis (Pool of 10 Phase 3 Trials*)
Figure S1. Change in non‐HDL‐C and apoB levels over time (ITT population).
Figure S2. Percent of patients achieving non‐HDL‐C levels of <100 mg/dL during the studies, overall and by cardiovascular risk (ITT population).
Figure S3. Percent of patients achieving non‐HDL‐C levels of <130 mg/dL during the studies, overall and by cardiovascular risk (ITT population).
Figure S4. Percent of patients achieving apoB levels <80 mg/dL during the studies (ITT population).